AleaSoft, June 15, 2020. In the third week of June, the European electricity markets prices will continue to rise, as already happened the previous week in most markets. The decrease in wind energy production will be the cause of the rise, in addition to the gradual recovery in demand. In the second week of June, the prices fell in some markets, such as MIBEL and Nord Pool. In the latter, on Saturday, June 13, the lowest daily price in the last nine years, of €1.48/MWh, was reached.
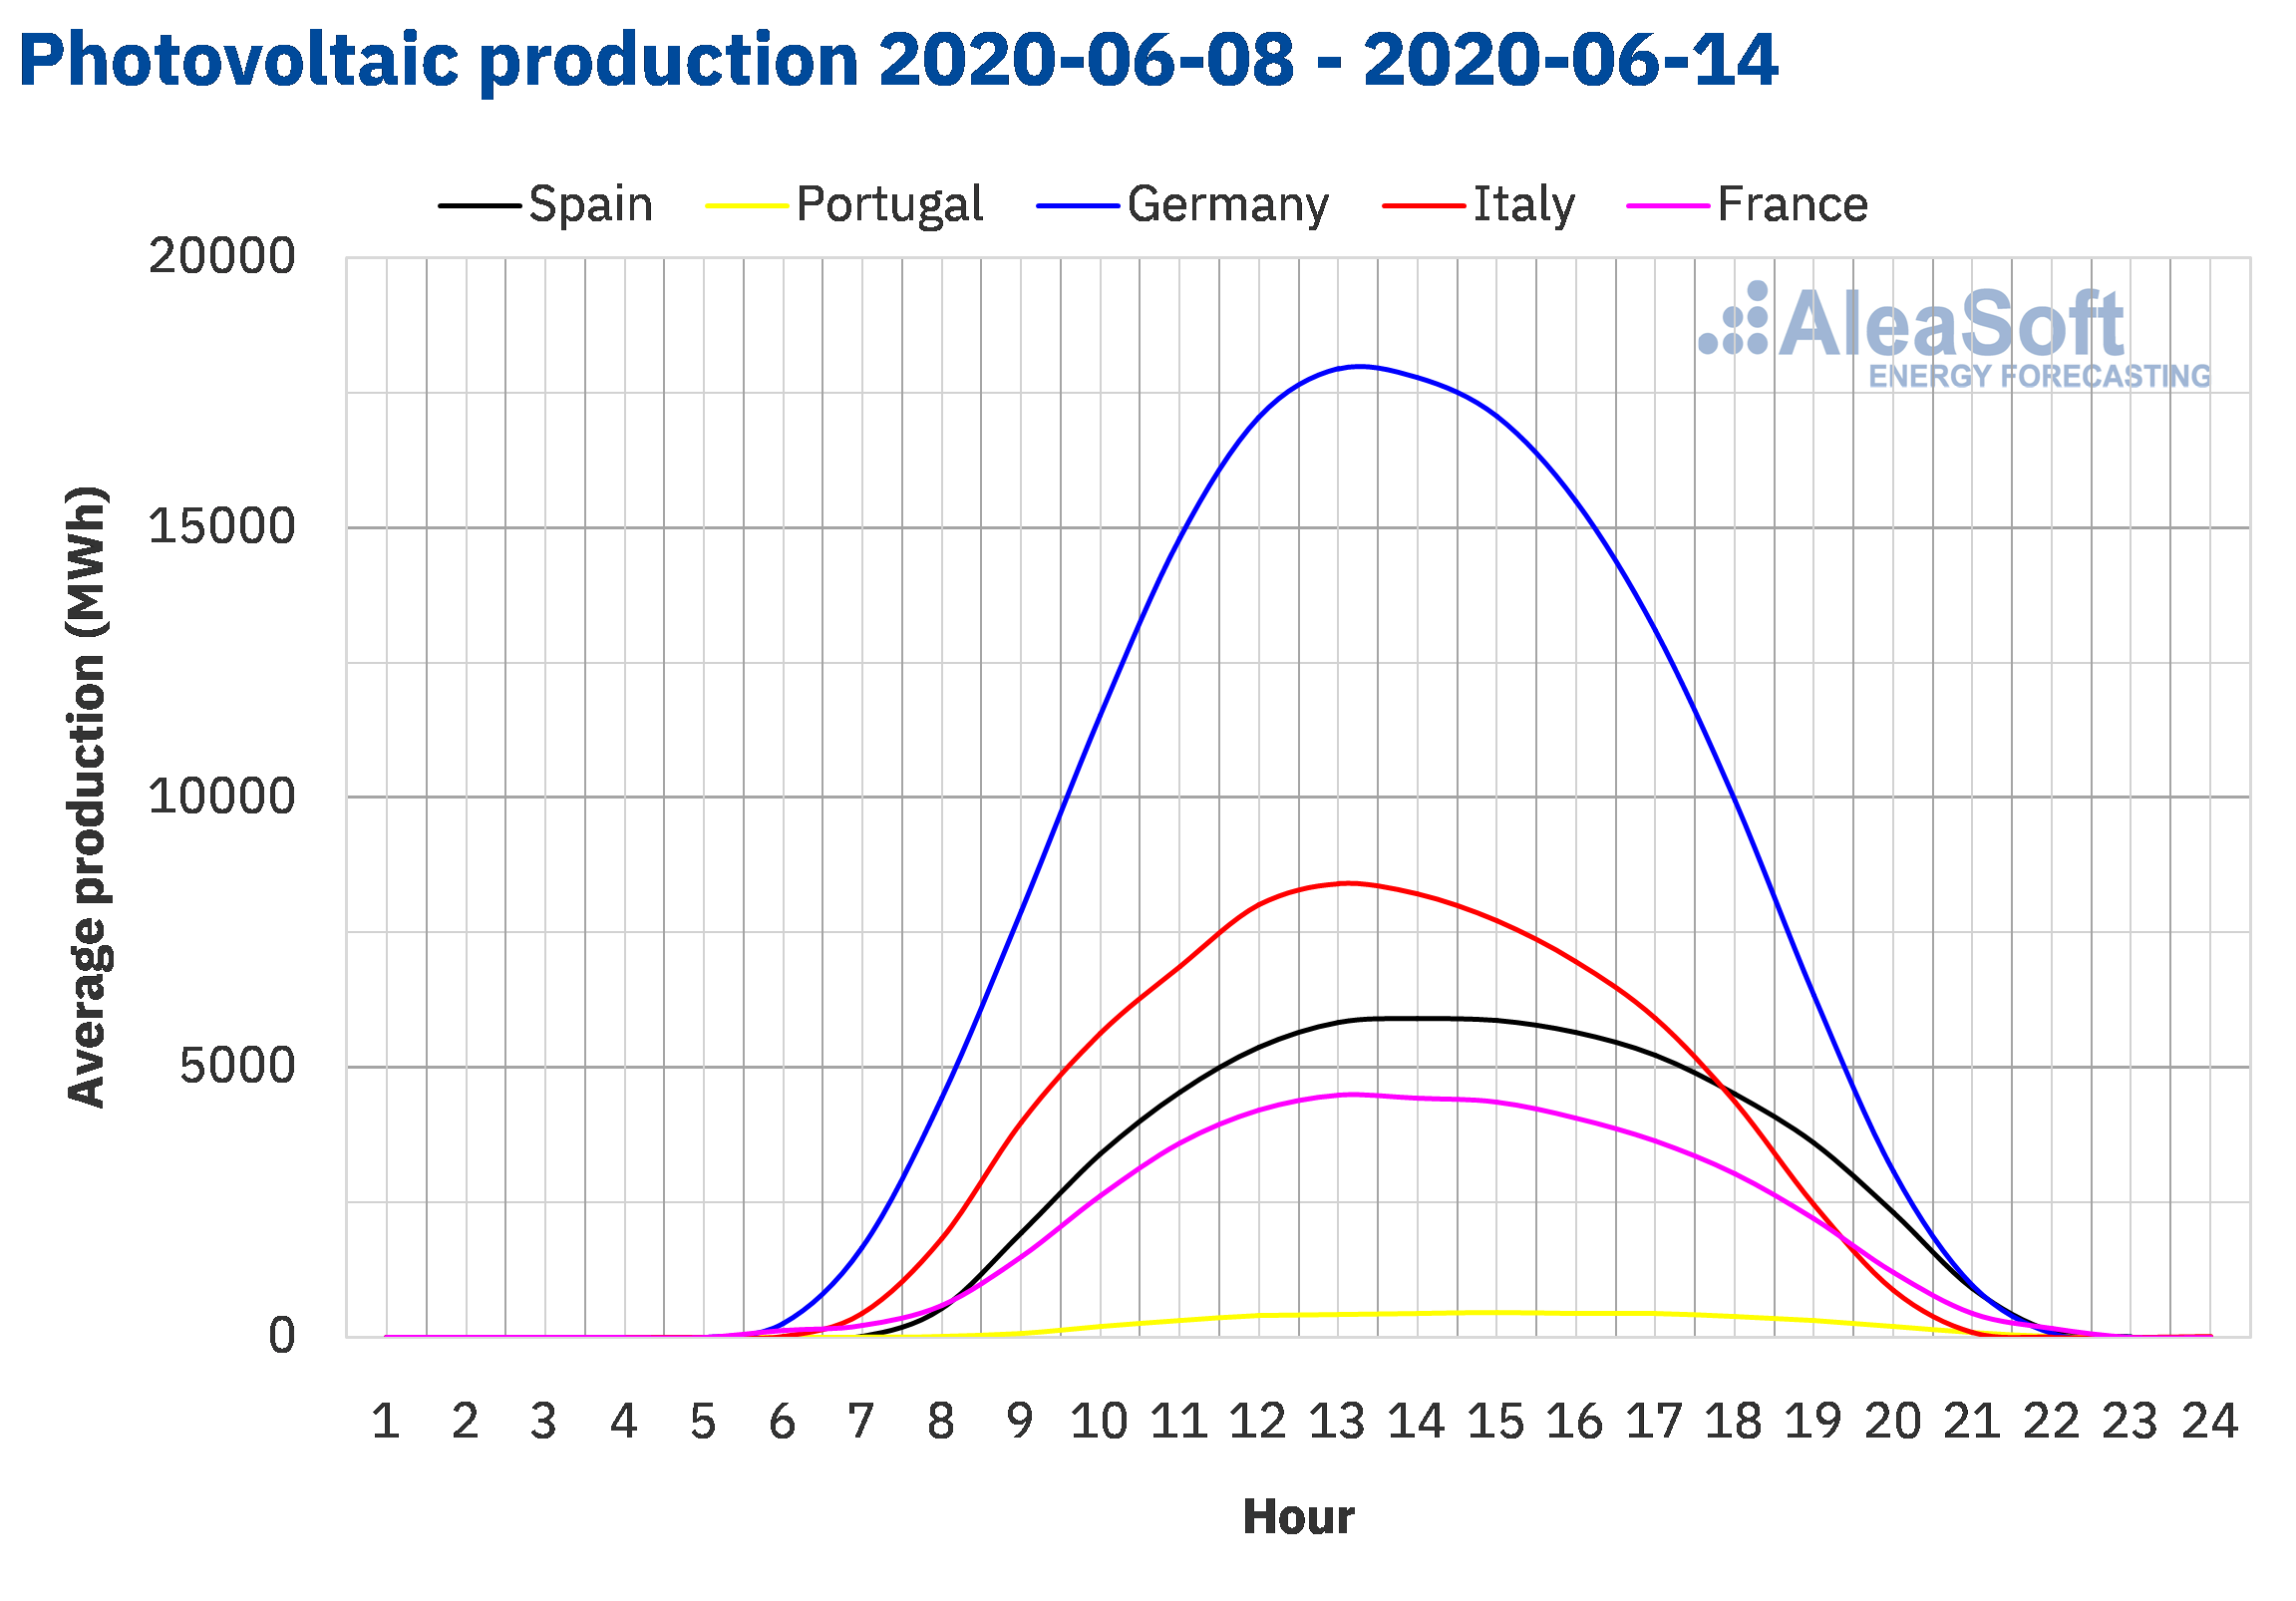
Photovoltaic and solar thermal energy production and wind energy production
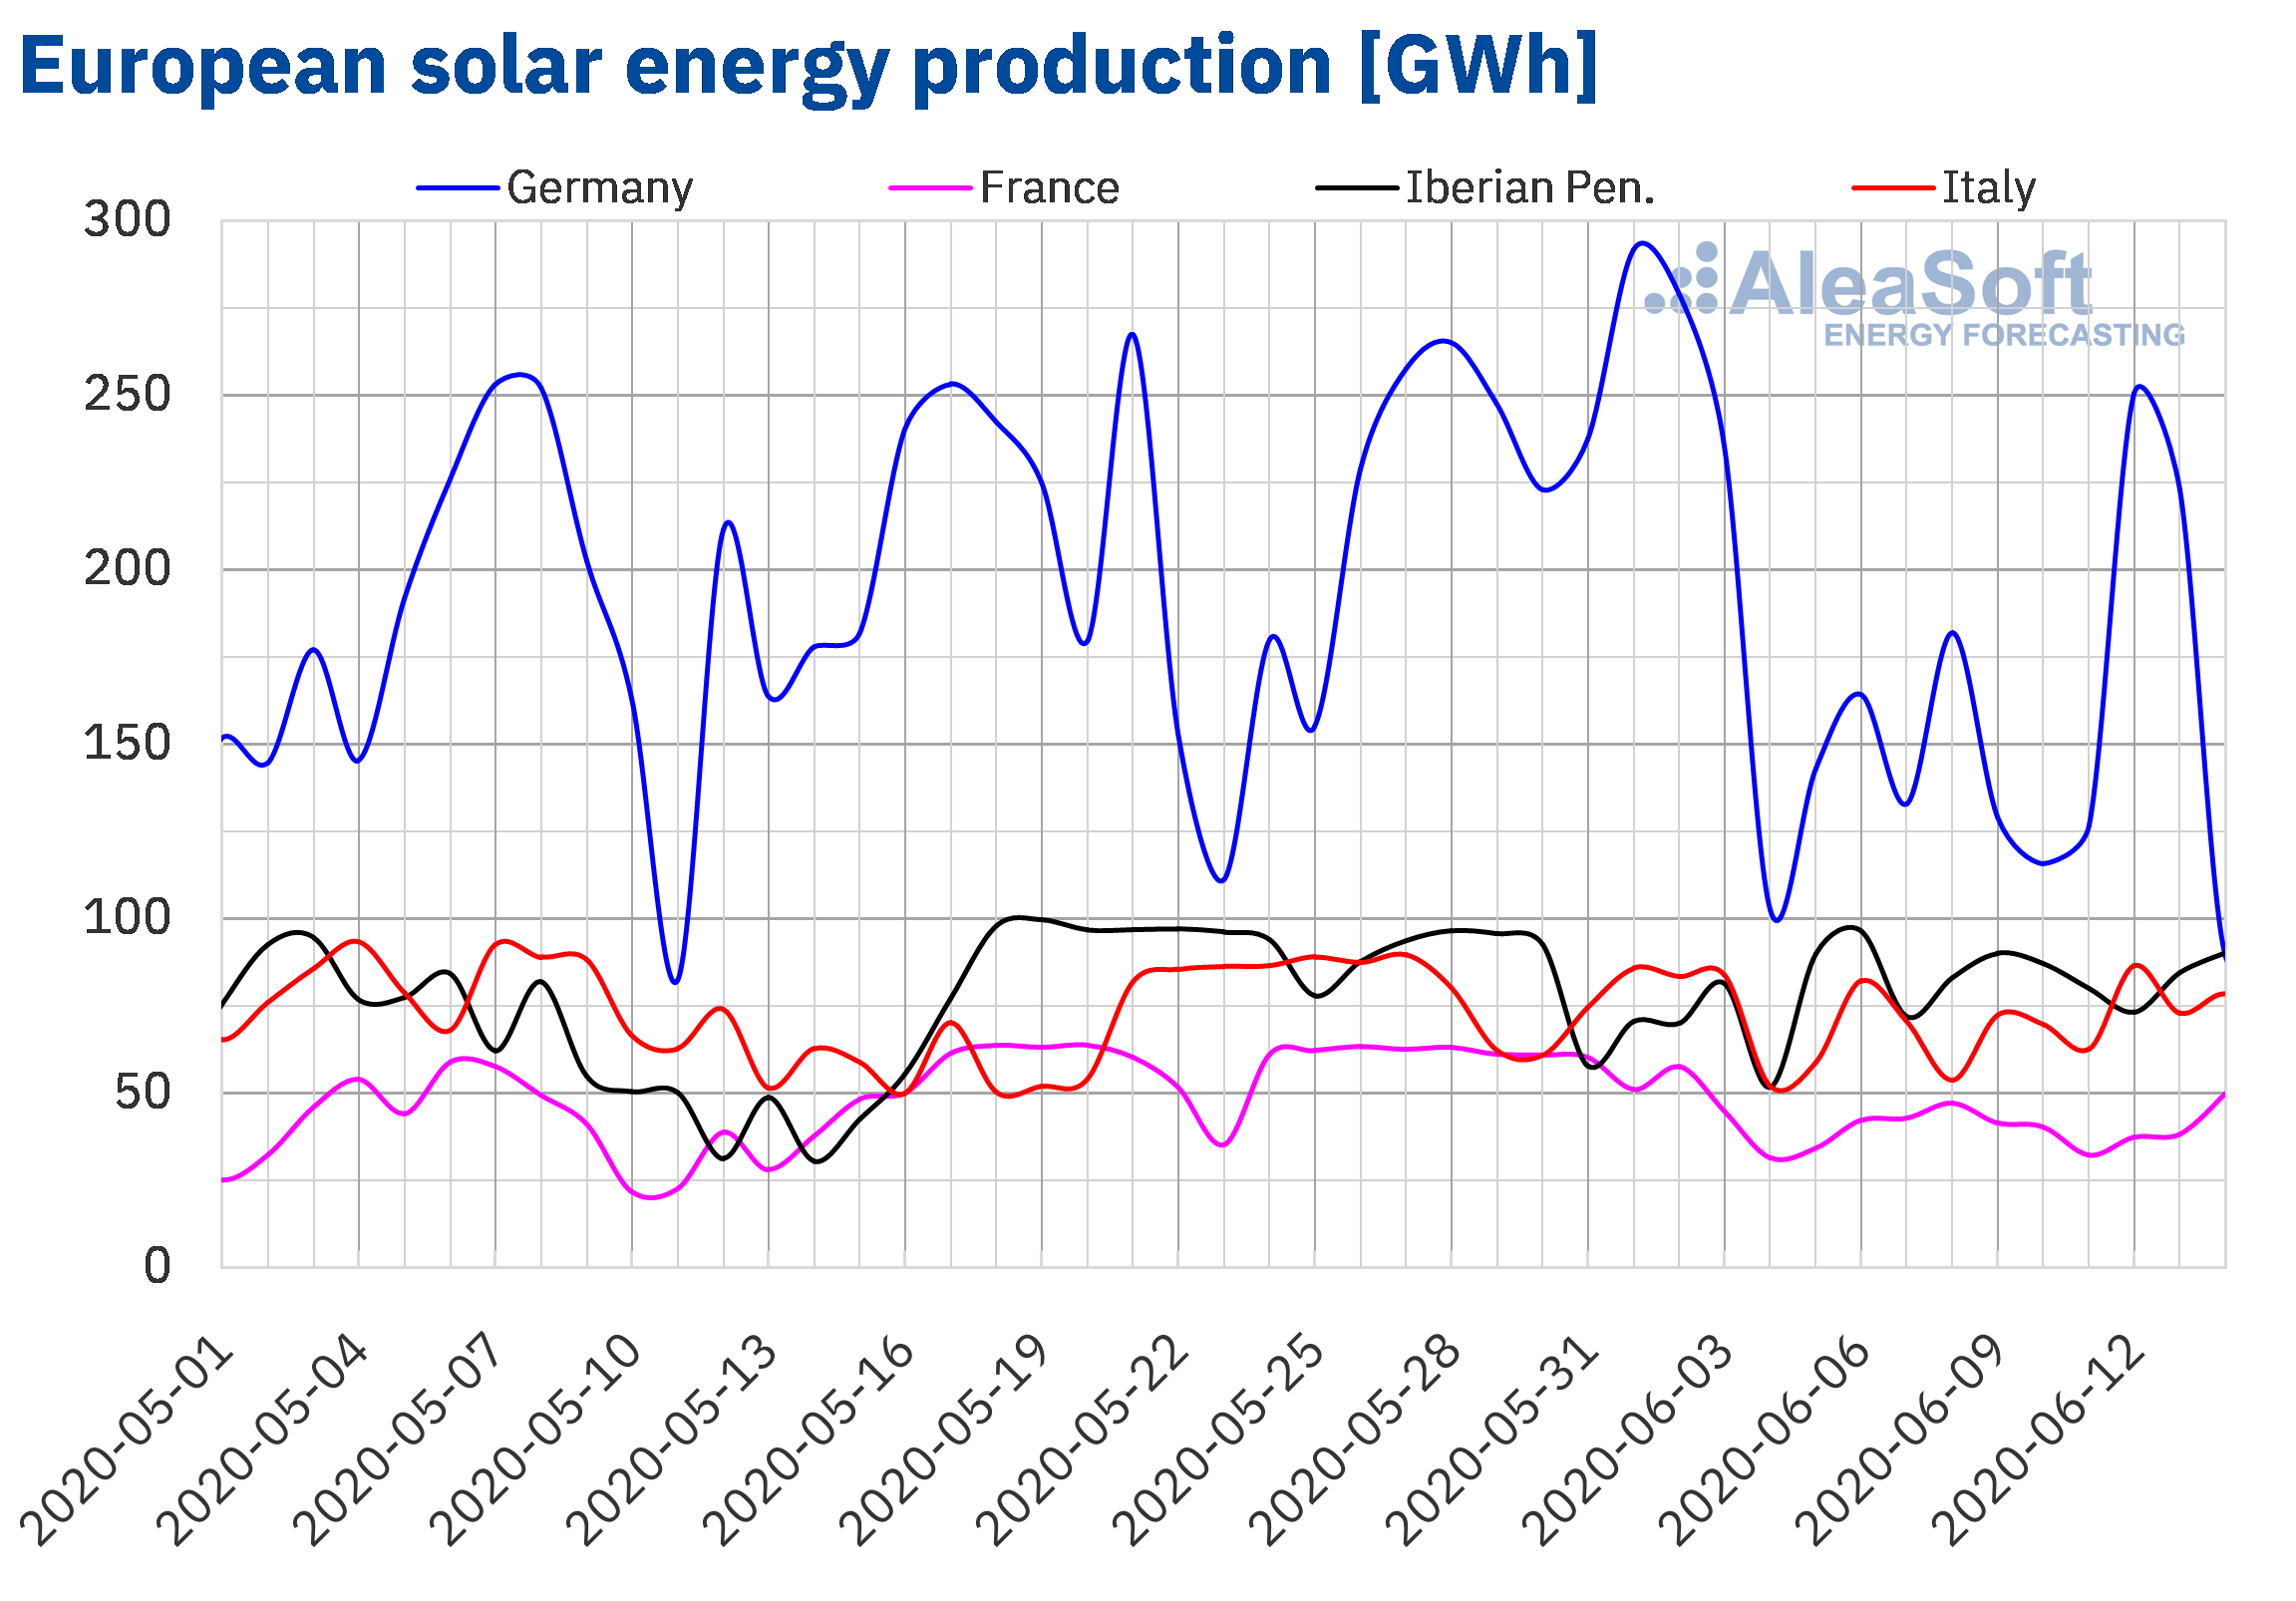
The solar energy production of the week ended on Sunday, June 14, was 17% lower in the German market compared to the first week of June. In the French market it decreased by 5.8% and in the Italian market by 3.9%. On the contrary, in Portugal and Spain the week ended with an increase in this renewable energy production of 16% and 10% respectively.
In the year‑on‑year analysis, during the 14 days elapsed in June, the solar energy production decreased by 14% in the German market, while in the French and the Italian it remained with little variation, less than ‑1%. On the contrary, in the Iberian Peninsula the production during this period was 29% higher than that of the same period of 2019.
For this week the AleaSoft‘s solar energy production forecasting indicates a decrease in solar energy production in the Spanish market, while for Germany and Italy a recovery is expected.
 Source: Prepared by AleaSoft using data from ENTSO-E, RTE, REN, REE and TERNA.
 Source: Prepared by AleaSoft using data from ENTSO-E, RTE, REN, REE and TERNA.
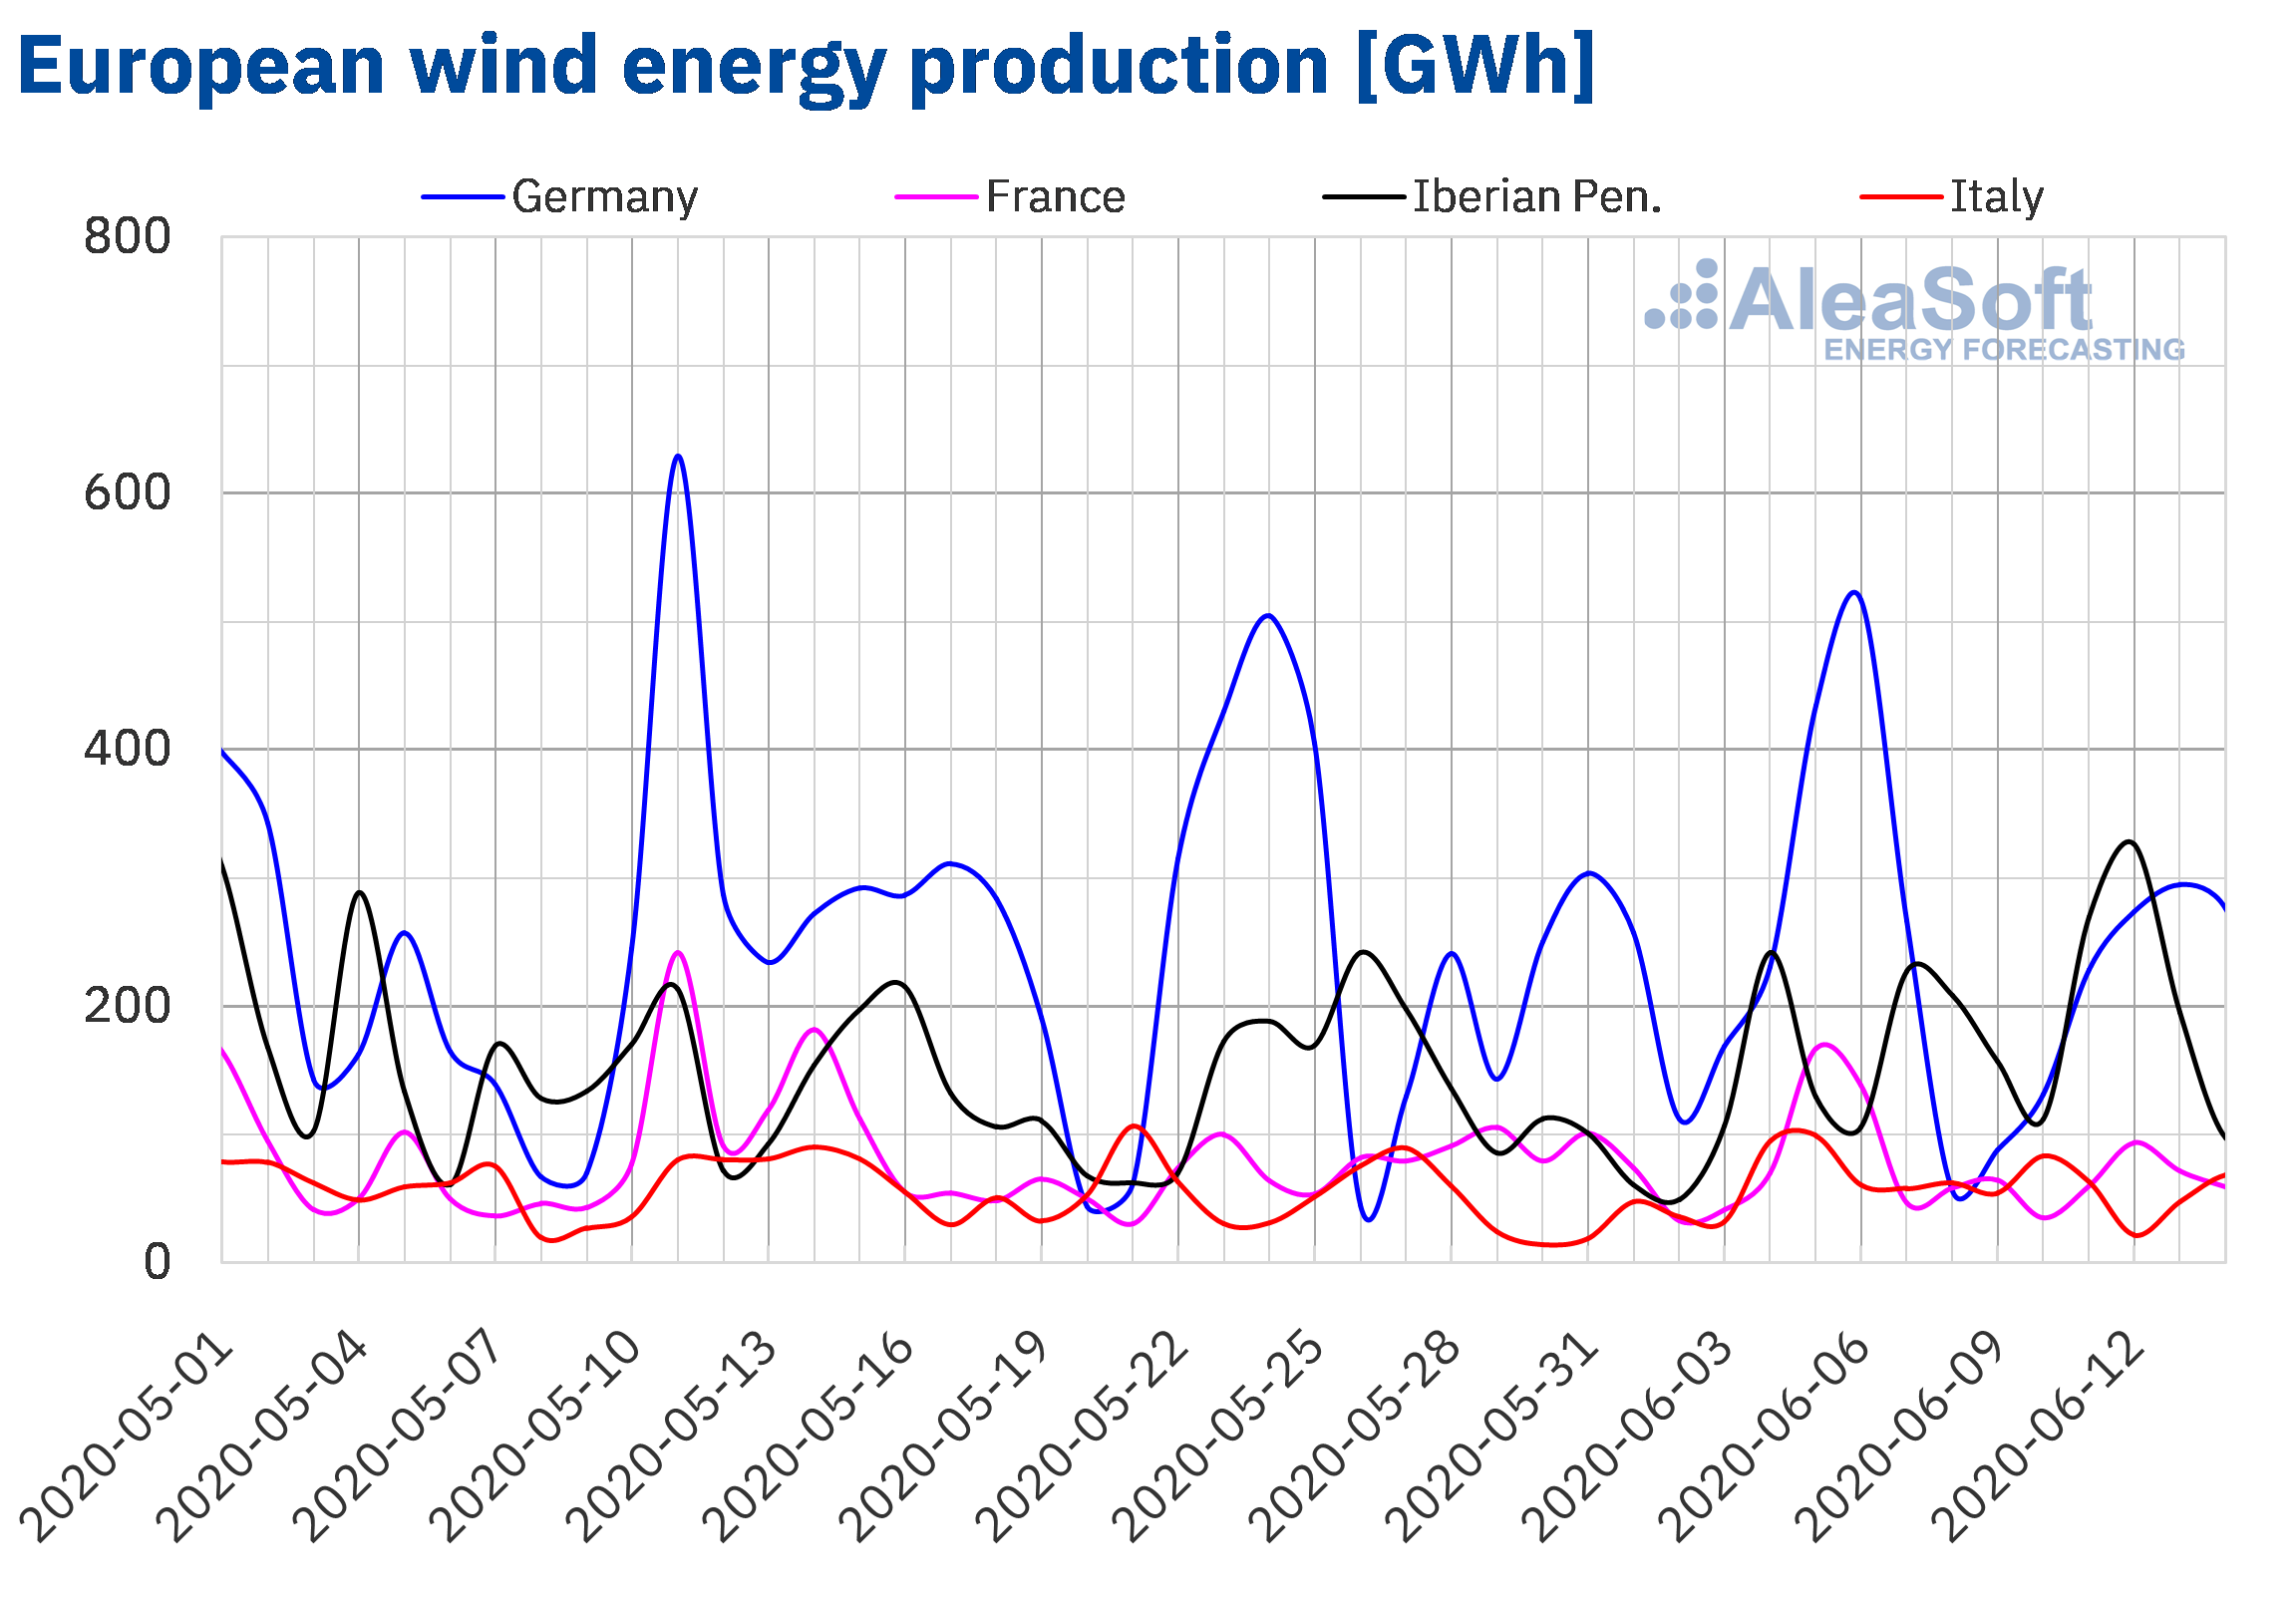
During the second week of June, the wind energy production also increased in the Iberian Peninsula, by 74% in the Portuguese market and by 44% in the Spanish market, compared to the previous week. In contrast, in Germany, France and Italy the wind energy generation decreased by 32%, 23% and 6.4% respectively.
So far in June, the wind energy production was 21% and 3.7% lower in the markets of Portugal and Germany, respectively, compared to the same days of June 2019. On the opposite extreme, the production with this technology increased in the Italian market by 97%, in the Spanish market by 12% and in the French market by 3.6%.
For this week the AleaSoft‘s wind energy production forecasting indicates a reduction in wind energy production in all the analysed European markets.
 Source: Prepared by AleaSoft using data from ENTSO-E, RTE, REN, REE and TERNA.
Electricity demand
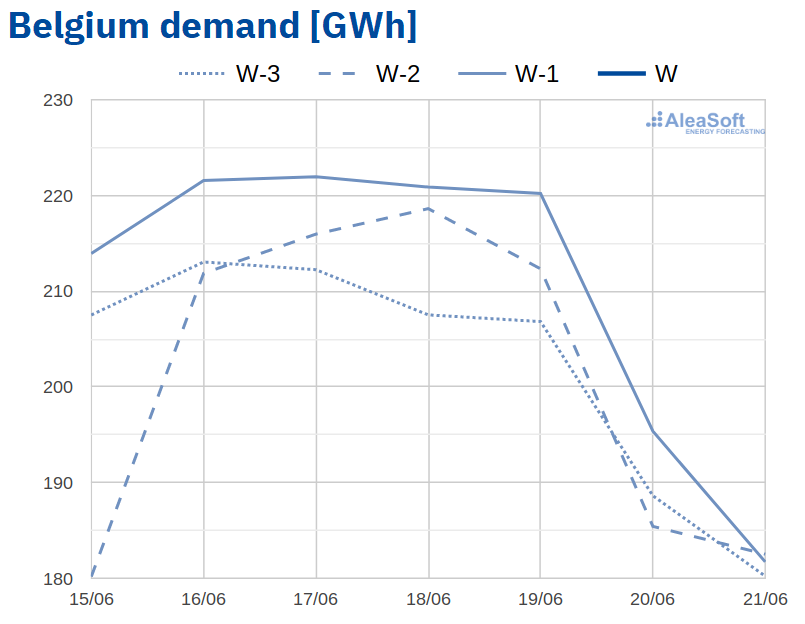
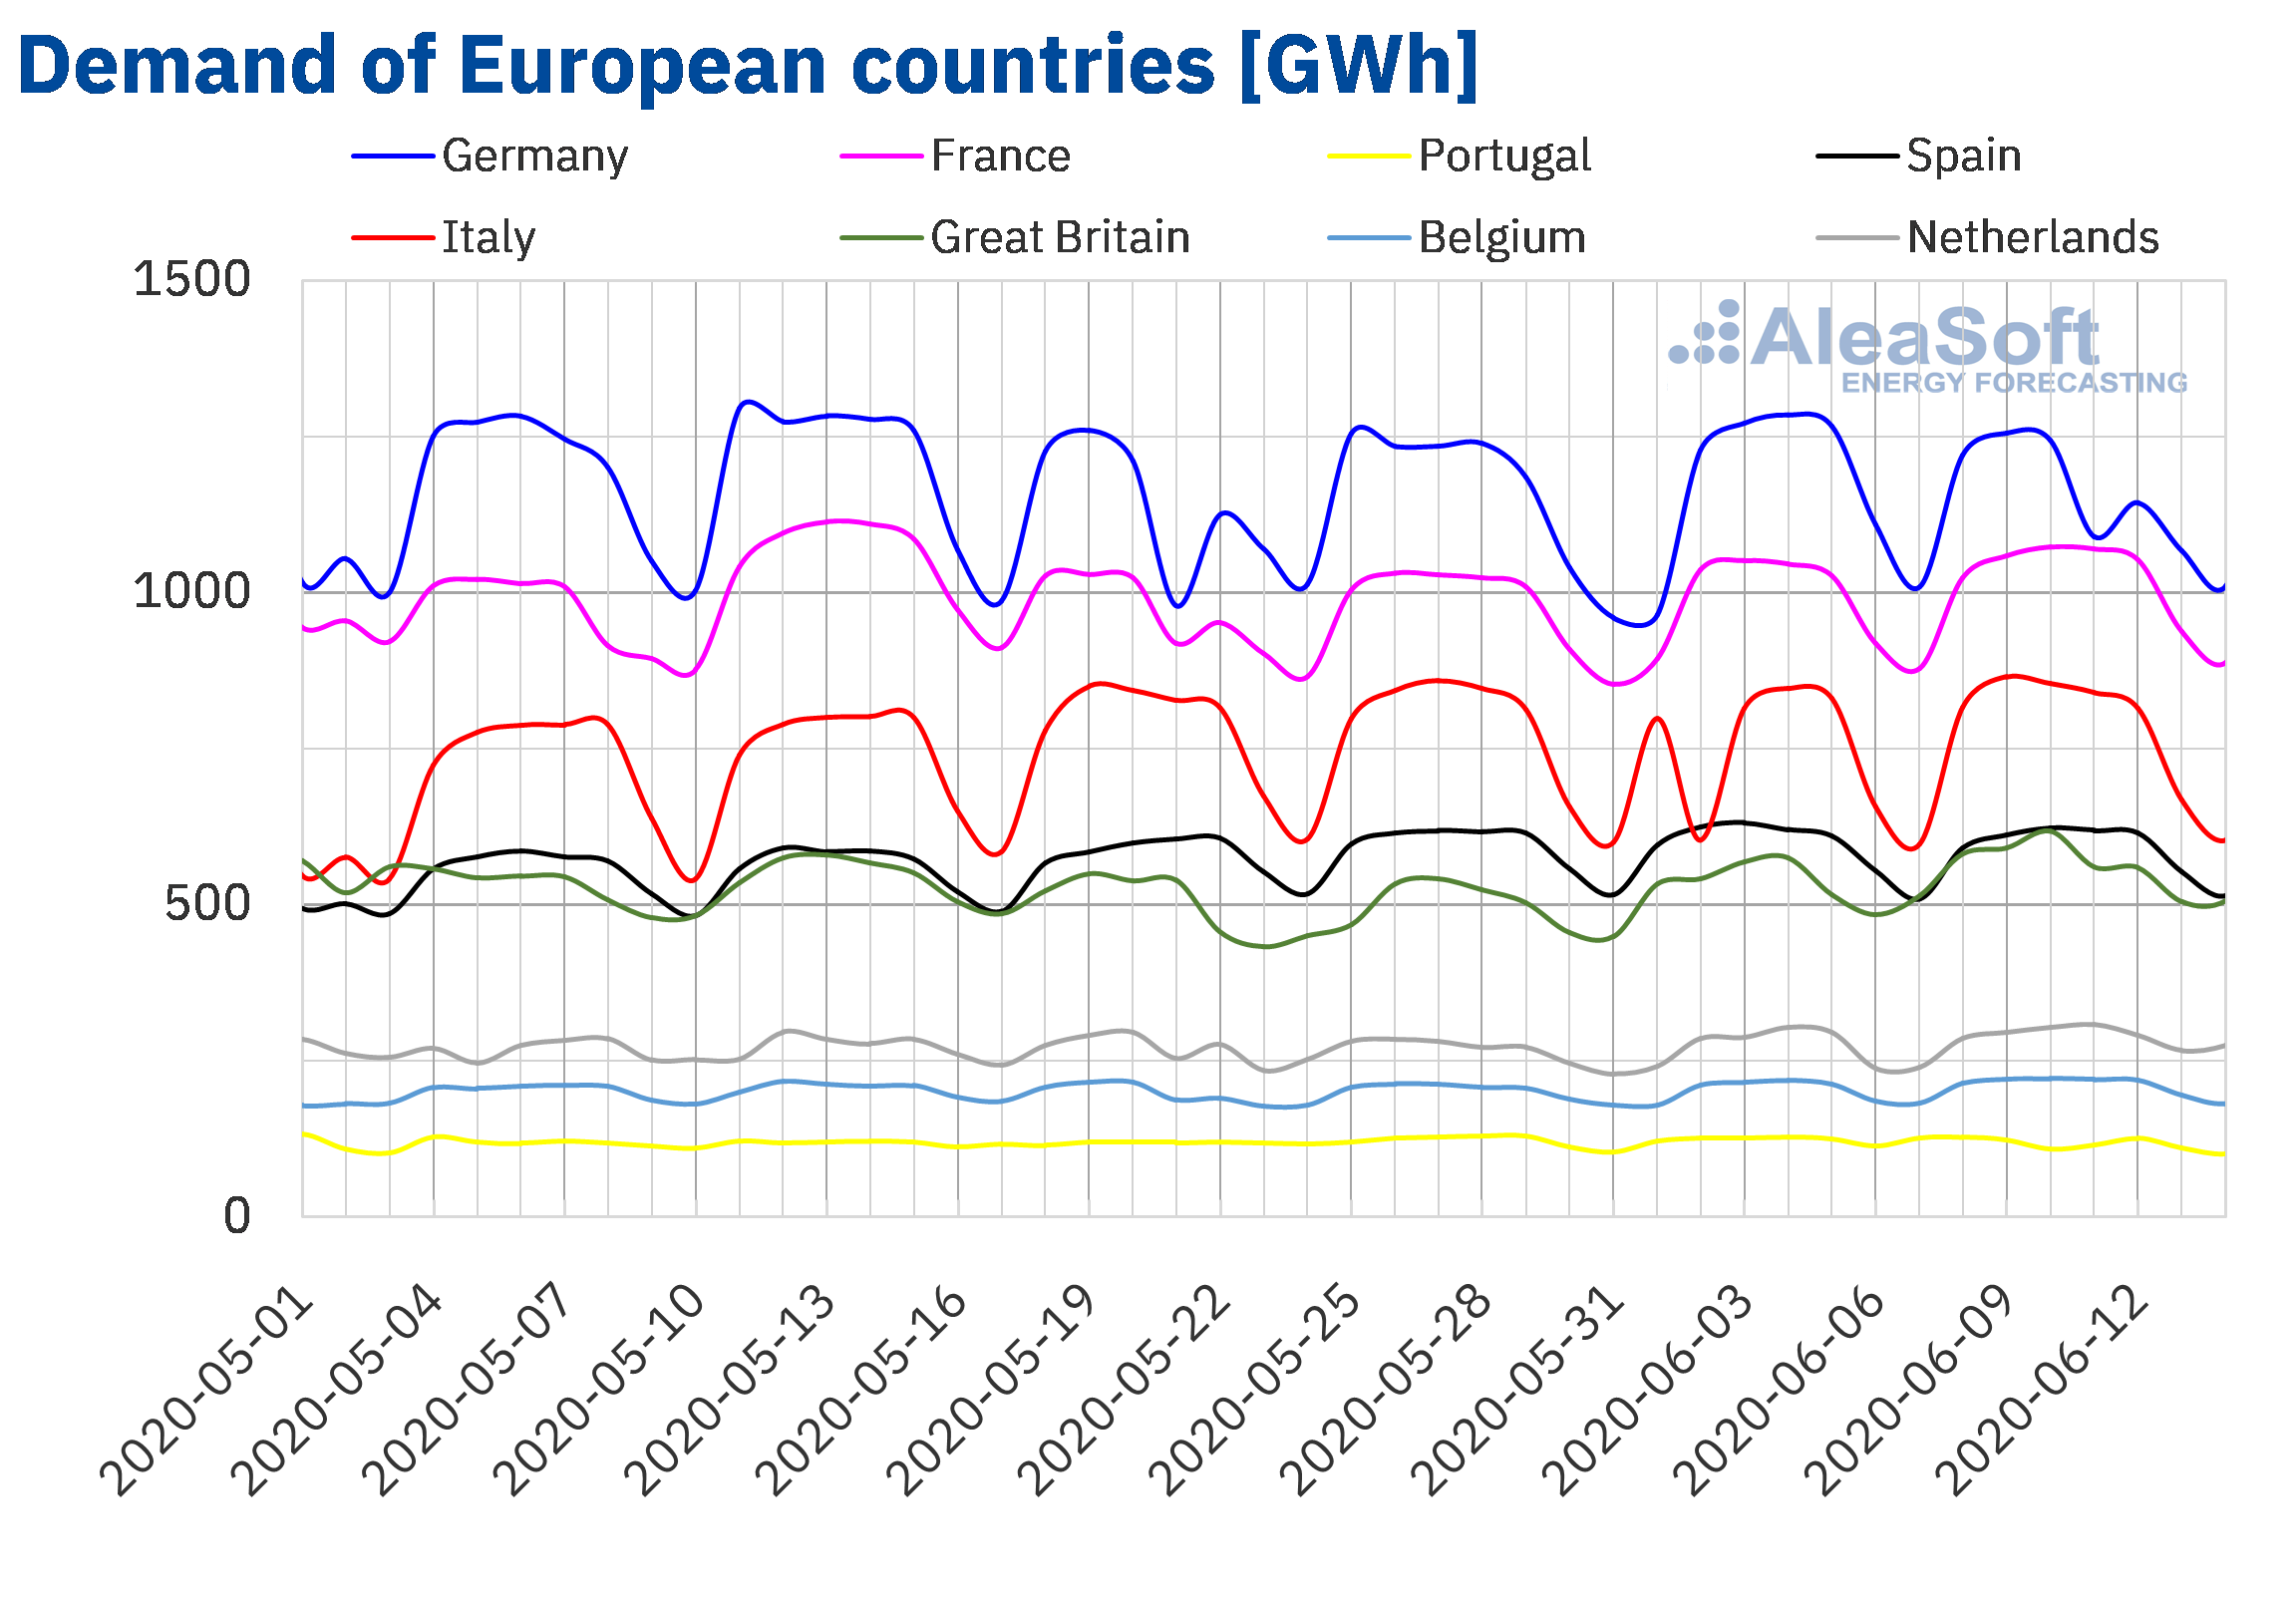
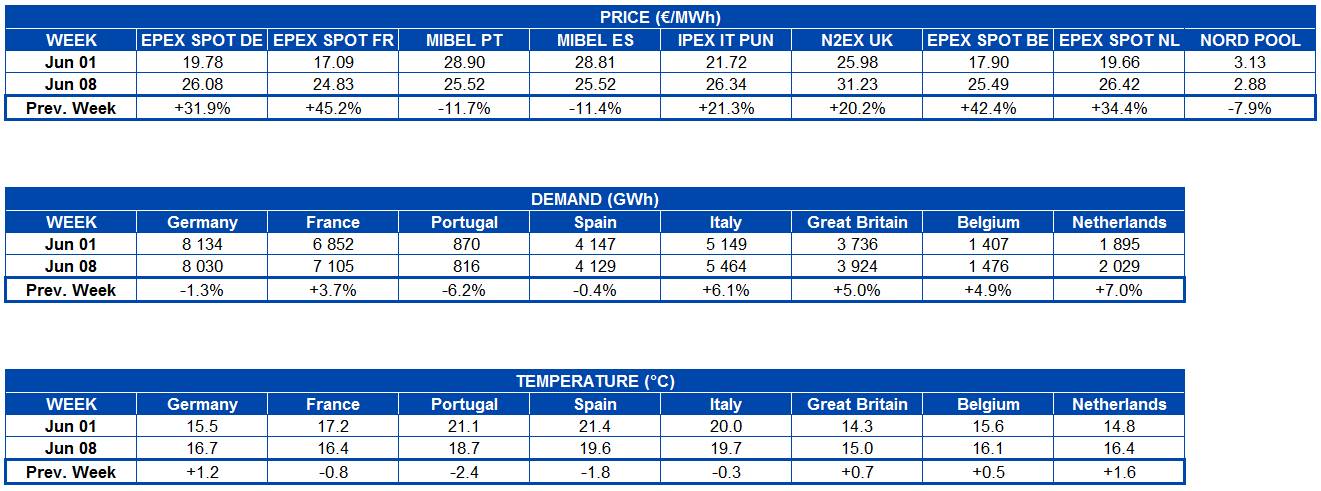
The electricity demand showed signs of recovery during the past week of June 8, as confinement measures in the European countries were eased. This factor, combined with the effect of the holiday of June 1, Pentecost Monday, were the main causes of the increases in France, Belgium and the Netherlands. The rises were more than 3% from the week of June 1 in France, Italy, Great Britain, Belgium and the Netherlands. In France it increased by 3.7%. In the case of Italy, the holiday of the Republic Day of Italy, celebrated on June 2, led to an increase in demand of 6.1%. Great Britain relaxed some mobility measures in the last two weeks, which contributed to the recovery of electricity demand for the second consecutive week, reaching a rise of 5.0%. The increase in the Belgian market was 4.9% compared to the first week of June, due to the holiday of June 1 and the entry into phase 3 of recovery that began on Monday, June 8.
 Source: Prepared by AleaSoft using data from ELIA.
On the other hand, in Germany and Portugal the electricity demand registered falls of 1.3% and 6.2% respectively, due to the effect of the Corpus Christi holiday celebrated on last Thursday, June 11 .
In the electricity markets observatories, created at AleaSoft, it is possible to analyse the evolution of the electricity demand in recent weeks. The data of the Europe’s electricity markets is updated daily.
The AleaSoft’s electricity demand forecasting indicates that this week the electricity demand will exceed that of last week in most of Europe, following the withdrawal of mobility restrictions in the Schengen area by the European Union, from this Monday, June 15. In particular, there will be noticeable increases in countries that finished the controls at the Europe’s internal borders, such as Germany, France and Belgium. In Spain this effect will be more visible when it reopens its borders with other Schengen countries next Sunday, June 21, and even more from July 1 when the borders with Portugal will be opened.
 Source: Prepared by AleaSoft using data from ENTSO-E, RTE, REN, REE, TERNA, National Grid and ELIA.
European electricity markets
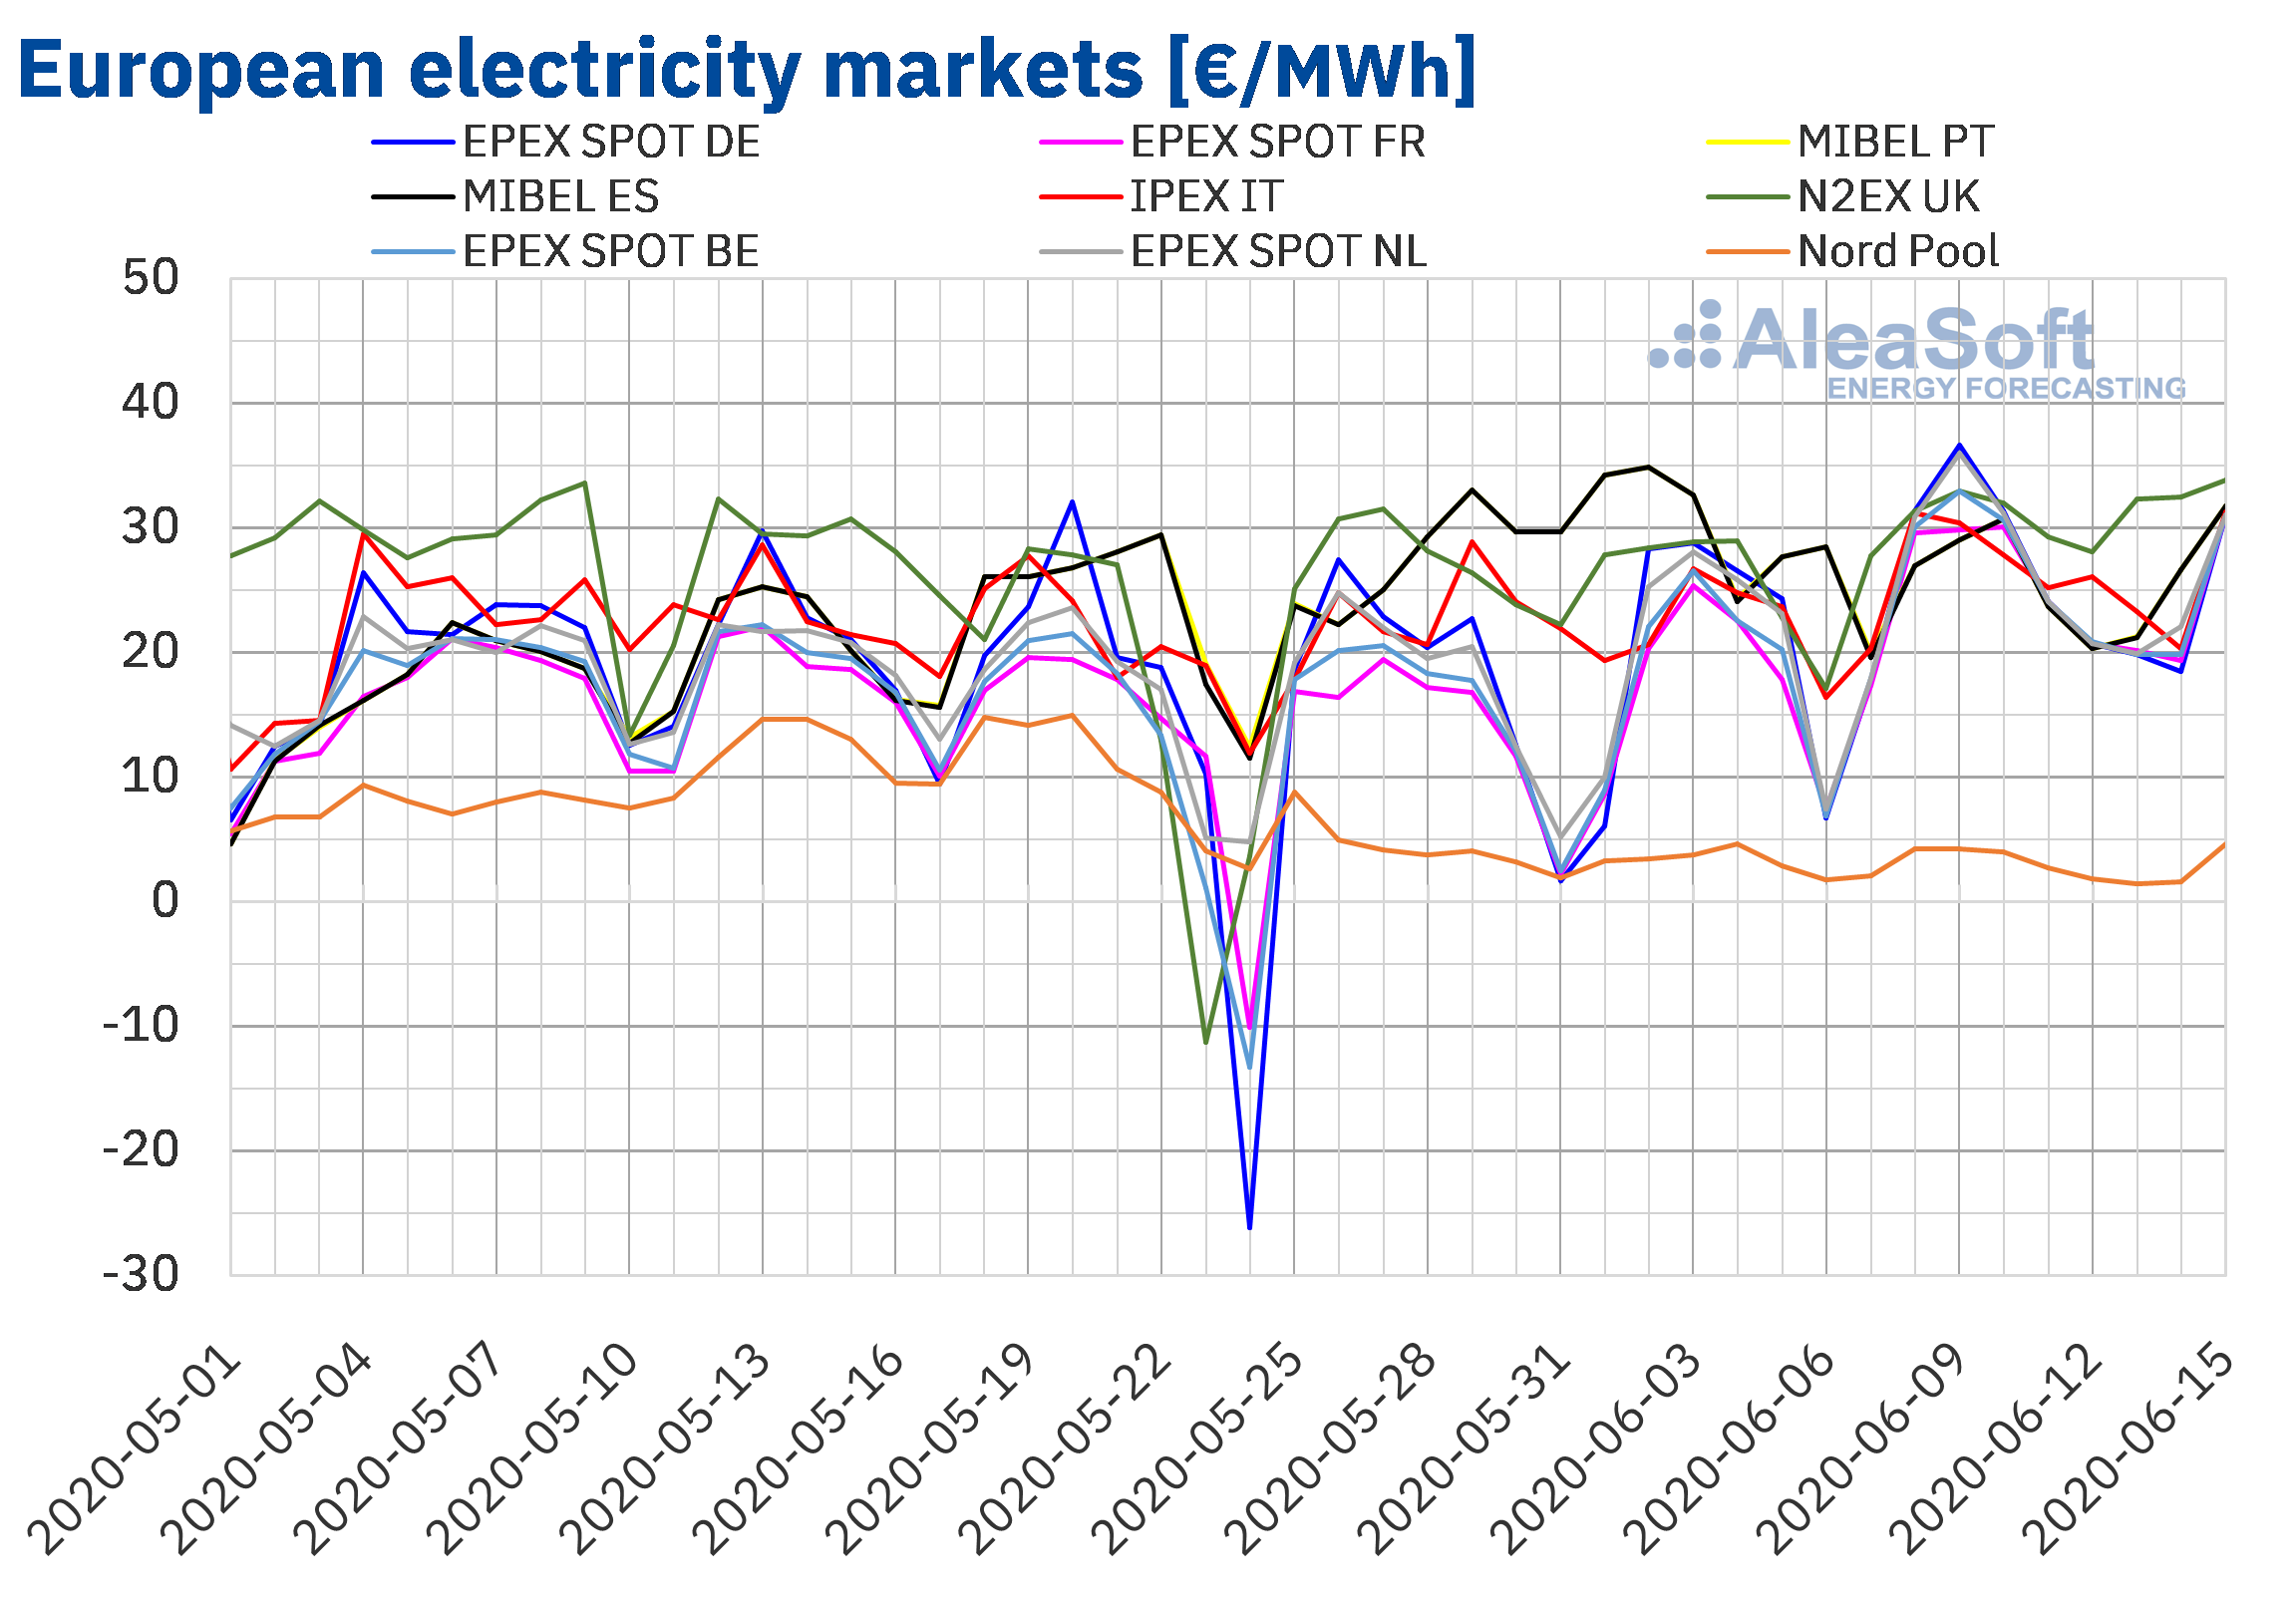
The week of June 8, the prices increased in most of the analysed European electricity markets compared to the previous week. The exceptions were the Nord Pool market of the Nordic countries and the MIBEL market of Spain and Portugal, with decreases of 7.9%, 11% and 12% respectively. The market with the highest price rise, of 45%, was the EPEX SPOT market of France, followed by the EPEX SPOT market of Belgium and the Netherlands with increases of 42% and 34% respectively. While the market where the price rose the least, by 20%, was the N2EX market of Great Britain.
The market with the lowest average price during the past week, of €2.88/MWh, was once again the Nord Pool market. While the market with the highest average price, of €31.23/MWh, was the N2EX market, followed by the EPEX SPOT market of the Netherlands, with €26.42/MWh. In the rest of the markets, average prices between €24.83/MWh of the EPEX SPOT market of France and €26.34/MWh of the IPEX market of Italy were reached.
The week of June 8, the decline in renewable energy production in Europe allowed the prices to rise in most electricity markets. The exceptions were the MIBEL and Nord Pool markets. In the case of the MIBEL market, the solar energy production and, especially the wind energy production increased in the Iberian Peninsula, which allowed the decrease in prices in Spain and Portugal. In the case of the Nord Pool market, the high hydroelectric energy production, due to the thaw, favoured the drop in prices. In this market, on Saturday, June 13, the lowest average price of the last nine years, of €1.48/MWh, was reached.
 Source: Prepared by AleaSoft using data from OMIE, EPEX SPOT, N2EX, IPEX and Nord Pool.
The AleaSoft‘s price forecasting indicates that this week of June 15 prices will be higher than last week in most European electricity markets, including the MIBEL market, due to the general decline in wind energy production in Europe and the gradual recovery of the electricity demand as the measures taken to combat COVID‑19 are softened.

Electricity futures
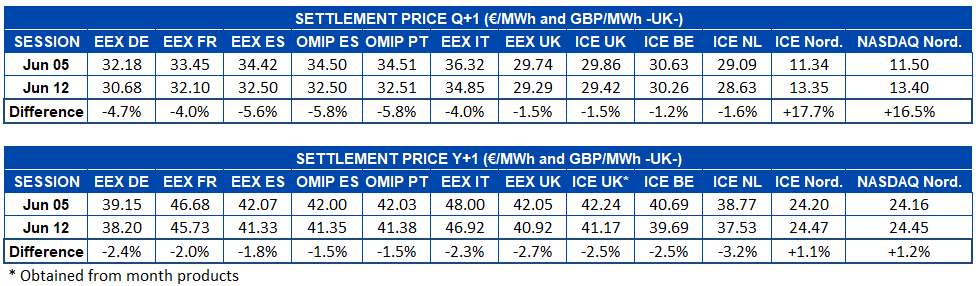
Between the sessions of June 5 and 12, the electricity futures prices for the next quarter registered decreases in most of the markets analysed at AleaSoft. The exceptions were the ICE and NASDAQ markets of the Nordic countries, which registered price increases of around 17% in both cases. As for the decreases, the OMIP market of Spain and Portugal was the one with the greatest variation, of ‑5.8% in both countries, closely followed by the EEX market of Spain with a ‑5.6% difference between the settlements of the two weeks. The rest of the markets had declines of between 4.7% and 1.2%.
The electricity futures prices for 2021 had a similar behaviour to those of the quarterly product. The prices fell in almost all markets except in the Nordic countries. In this case, the ICE market of the Netherlands was the one with the greatest variation in prices, with a 3.2% reduction between the sessions of June 5 and June 12. Although the Iberian market led the decreases in the quarterly product, in the case of the annual product it was the one that registered the smallest decrease in its prices, with a drop of 1.5% in both Spain and Portugal, followed by the variation of the EEX market of Spain, of ‑1.8%.
Brent, fuels and CO2
The Brent oil futures prices for the month of August 2020 in the ICE market, the first days of the week of June 8, remained above $40/bbl and were higher than those of the same days of the first week of June. However, on Thursday, June 11, there was a decrease of 7.6% compared to the previous day. That day the settlement price was $38.55/bbl, the second lowest so far this month, after the one registered on June 1. On Friday there was a slight recovery, of 0.5%, until reaching a settlement price of $38.73/bbl, which was still 8.4% lower than that of the same day of the previous week.
The first days of the week of June 8, the news about the agreement according to which the OPEC+ would maintain its production cuts in July, the increase in official sale prices of Saudi Arabia and the effects of the tropical storm Cristobal on the production in the Gulf of Mexico contributed to the prices remaining above $40/bbl.
However, the negative global economic data and the increase in the United States’ crude reserves exerted a downward influence on prices, returning them to the values of the beginning of the month.
The TTF gas futures prices in the ICE market for the month of July 2020 the first days of last week fell until reaching the minimum settlement price of the week, of €4.80/MWh, on Wednesday, June 10. But, on Thursday and Friday this trend was reversed. As a result, on Friday, June 12, there was a settlement price of €5.27/MWh, the highest for the week, but 7.6% lower than that of the previous Friday.
Regarding the TTF gas prices in the spot market, on Tuesday of last week they reached an index price of €5.14/MWh. This price was 50% higher than that of the previous Tuesday and the highest since the first half of May. But on Wednesday and Thursday the prices fell until reaching an index price of €4.52/MWh on Thursday, June 11, the lowest of the week and 5.9% lower than that of the previous Thursday. The last days of last week, the prices recovered and the index price of the weekend was €4.89/MWh. For this Monday, June 15, the recovery continued and the index price is €5.01/MWh.
On the other hand, the settlement prices of the API 2 coal futures in the ICE market for the month of July 2020, the second week of June, fell from $47.15/t of Monday to $44.65/t of Thursday. The settlement price of Thursday was the lowest so far this month. But on Friday the prices recovered, settling at $45.50/t.
Regarding the CO2 emission rights futures in the EEX market for the reference contract of December 2020, the second week of June, the settlement prices took values between €22.91/t of Wednesday, June 10, and €22.00/t of Friday, June 12. Although declines were registered most of the days, the weekly average, of €22.48/t, was higher than that of the week of June 1, of €22.11/t.
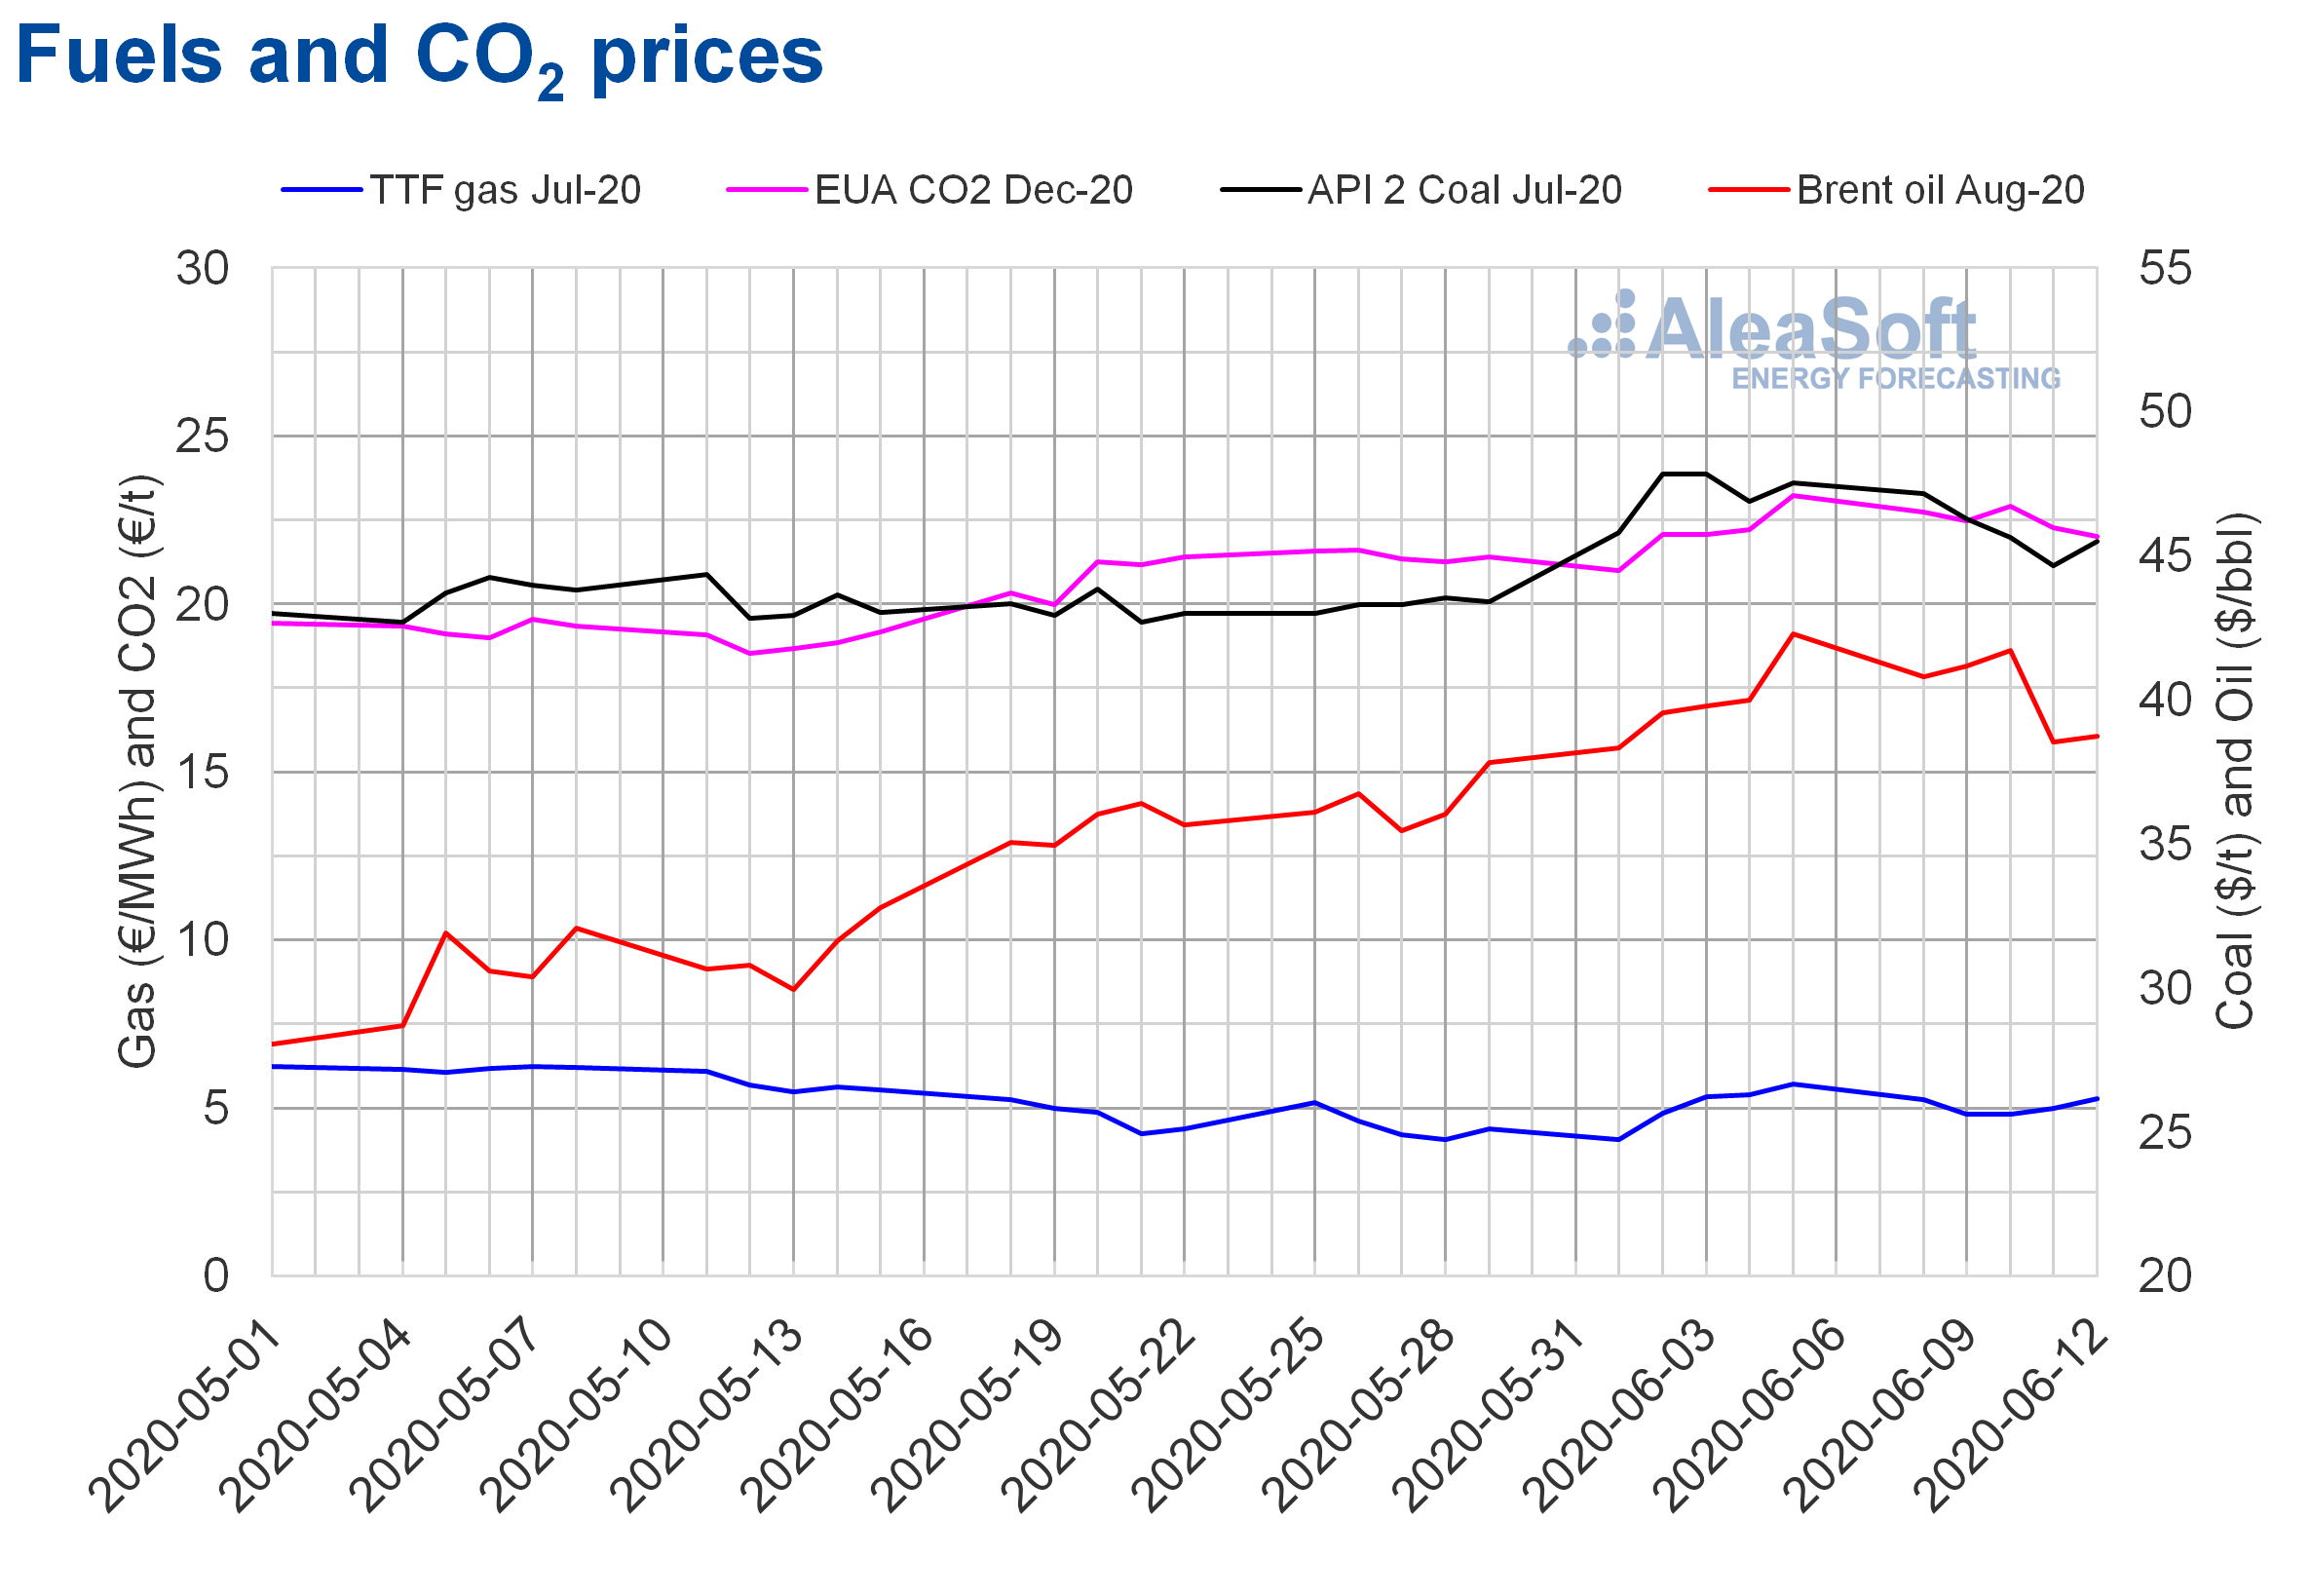 Source: Prepared by AleaSoft using data from ICE and EEX.
AleaSoft analysis on the effects on the electricity markets due to the coronavirus crisis
On June 25, the third part of the Webinar “Influence of coronavirus on electricity demand and the European electricity markets” will be imparted at AleaSoft. The topics to be discussed will be the evolution of the European energy markets and the financing of renewable energy projects during the coronavirus crisis. The speakers will be Pablo Otín, CEO and co‑founder, at Powertis, Miguel Ángel Amores, Manager of Renewable Energy, at Triodos Bank and Oriol Saltó, Manager of Data Analysis and Modelling, at AleaSoft.
The evolution of the main energy markets can also be monitored at the AleaSoft’s observatory. This tool includes updated information of the demand, the prices and other market variables that are visualised using comparative charts of the last weeks.
Source: AleaSoft Energy Forecasting.