AleaSoft, July 13, 2020. In the second week of July, the prices of most European electricity markets rose, reaching in some cases daily values above €40/MWh and hourly values above €50/MWh. The demand increased in general and the wind and solar energy production fell in a large part of the markets. Added to this was the increase in CO2 prices, which stood above €29/t for most of the week.
Photovoltaic and solar thermal energy production and wind energy production
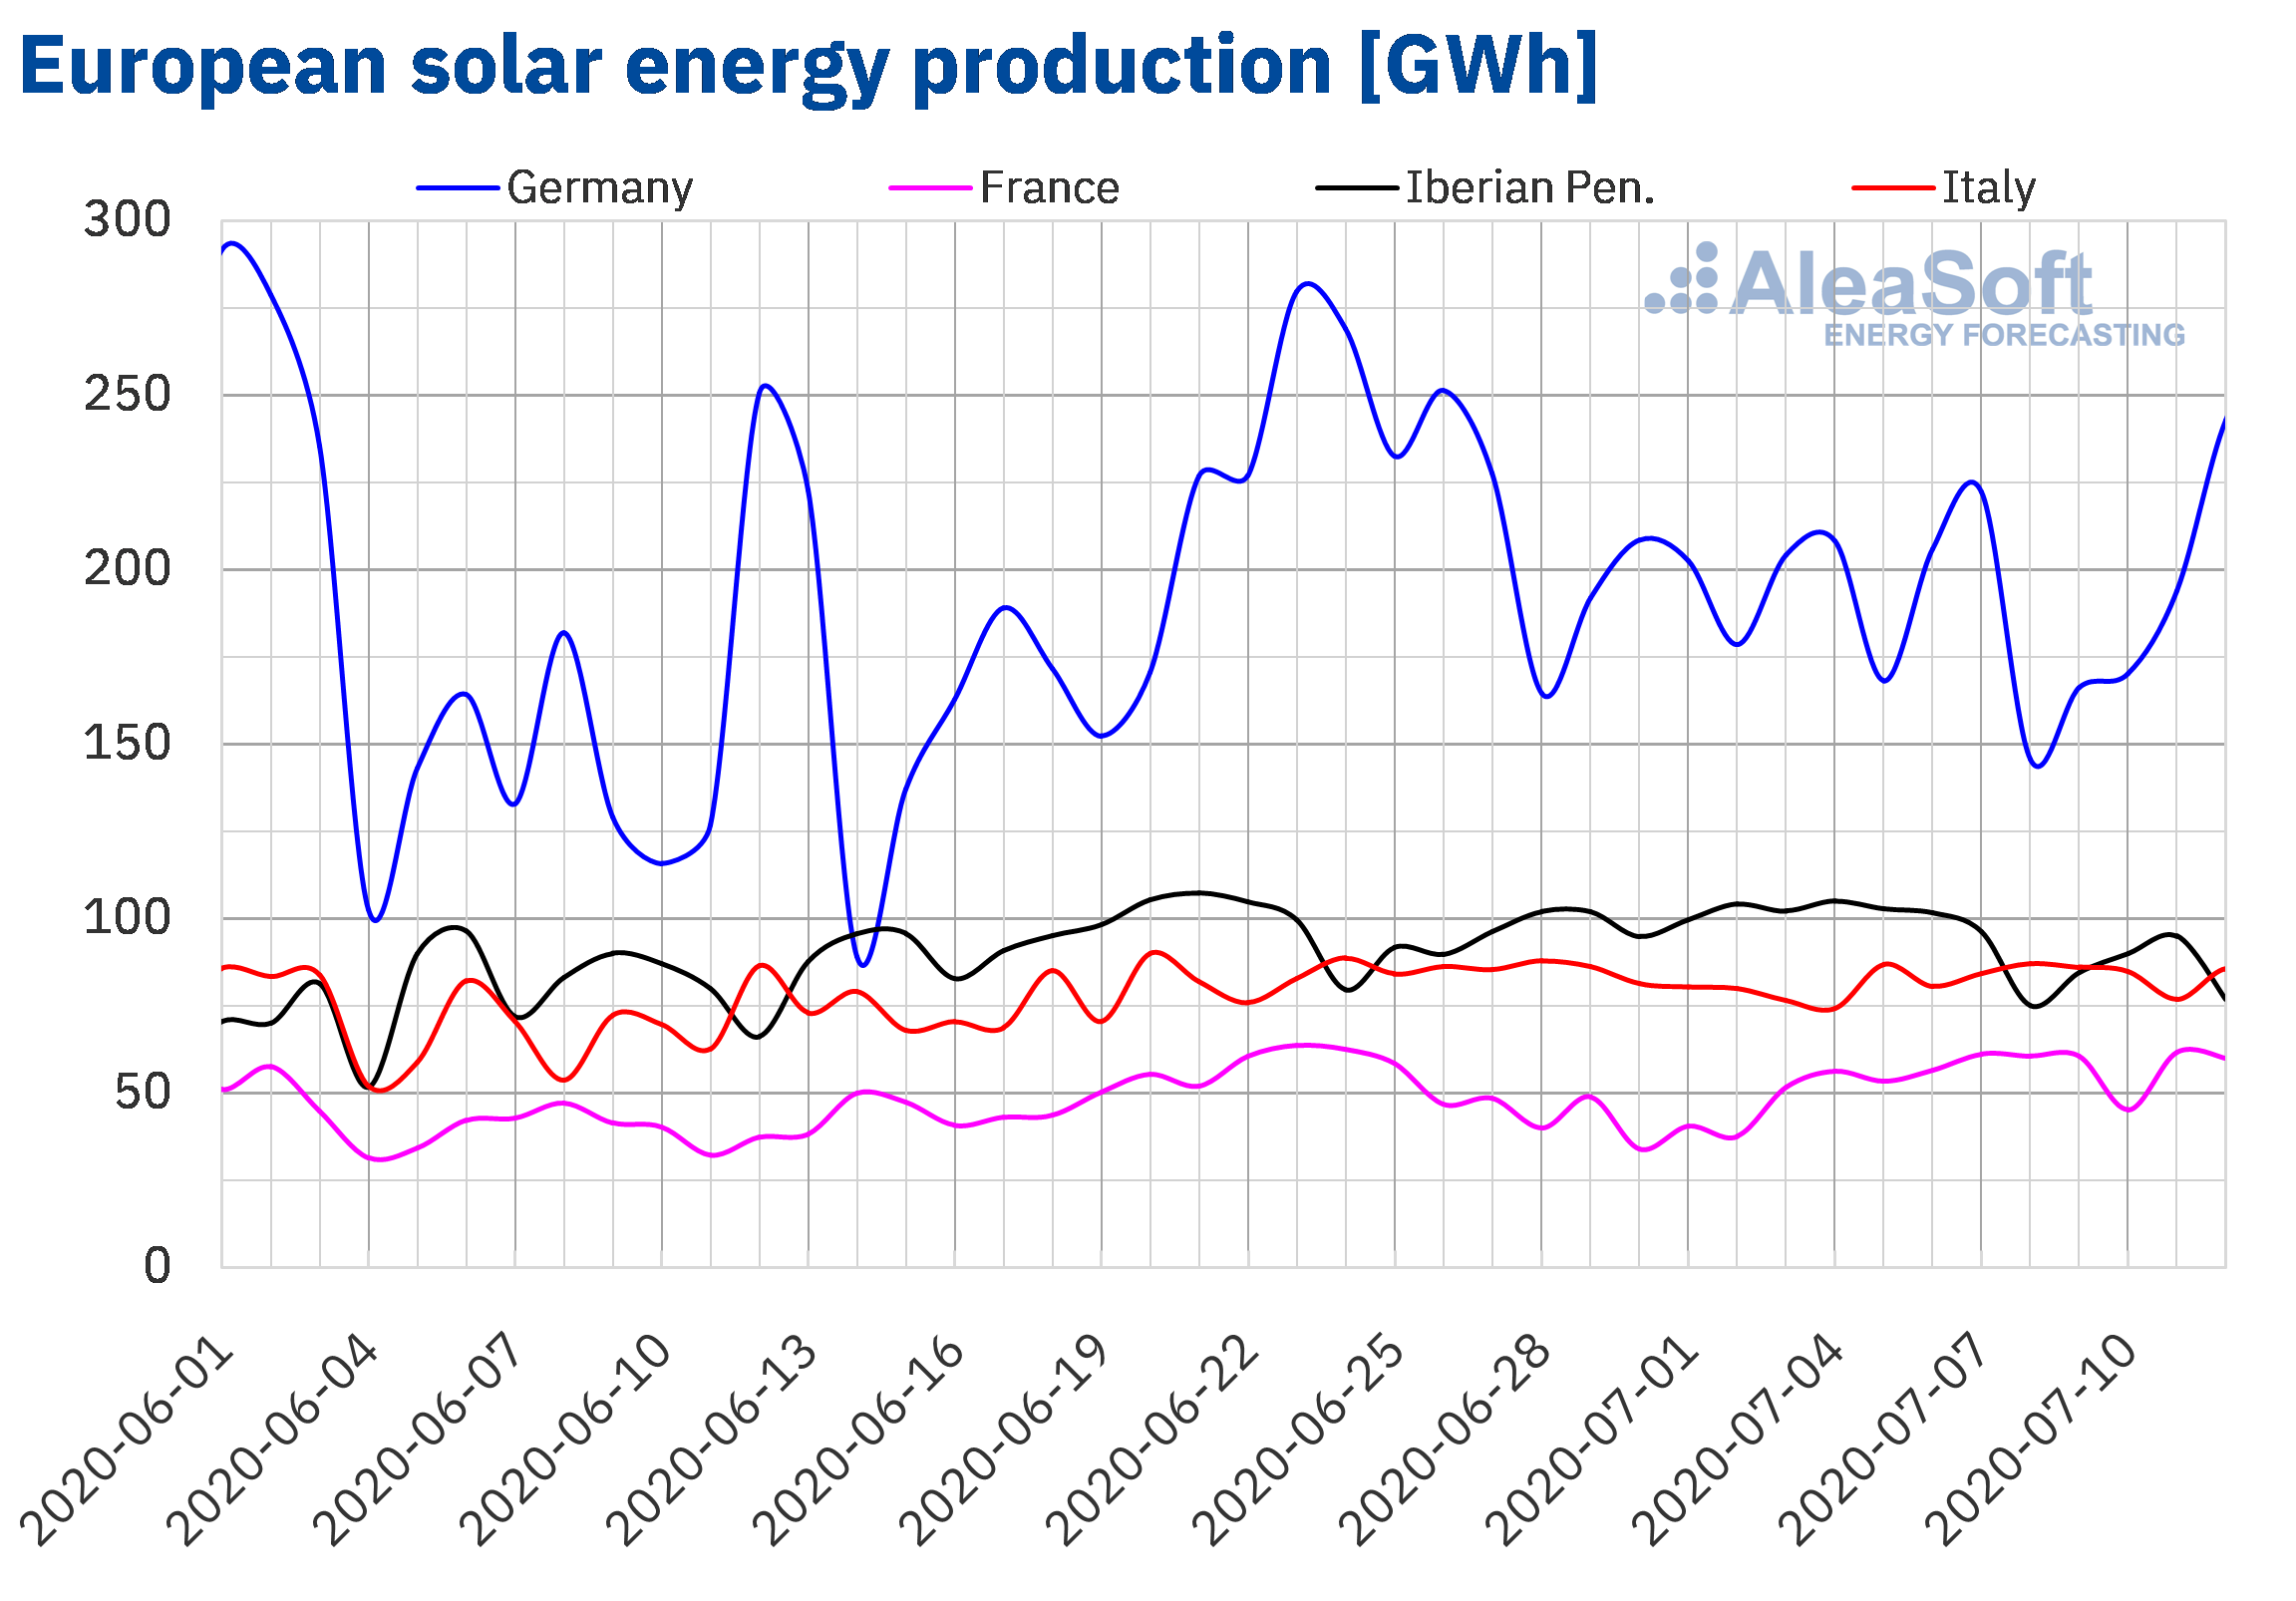
During the week number 28 of the year, the solar energy production decreased in the Iberian Peninsula and Germany compared to the previous week. In the German market the reduction in production was 1.1% while in the Iberian Peninsula it was 13%. On the contrary, in the French market the solar energy production increased by 26% and in the Italian market by 3.5%.
During the first 12 days of July, the solar energy production increased in all the markets analysed at AleaSoft compared to the same days of July 2019. In mainland Spain, where the photovoltaic and solar thermal technologies are included, the production with these technologies was 71% higher, while in the Portuguese market the production rose 39% during this period. In the rest of the markets, the production increased between 2.4% and 17%.
For the week number 29, the AleaSoft‘s solar energy production forecasting indicates a decrease in solar energy production in the Spanish market and in the Italian market, while an increase is expected for the German market.
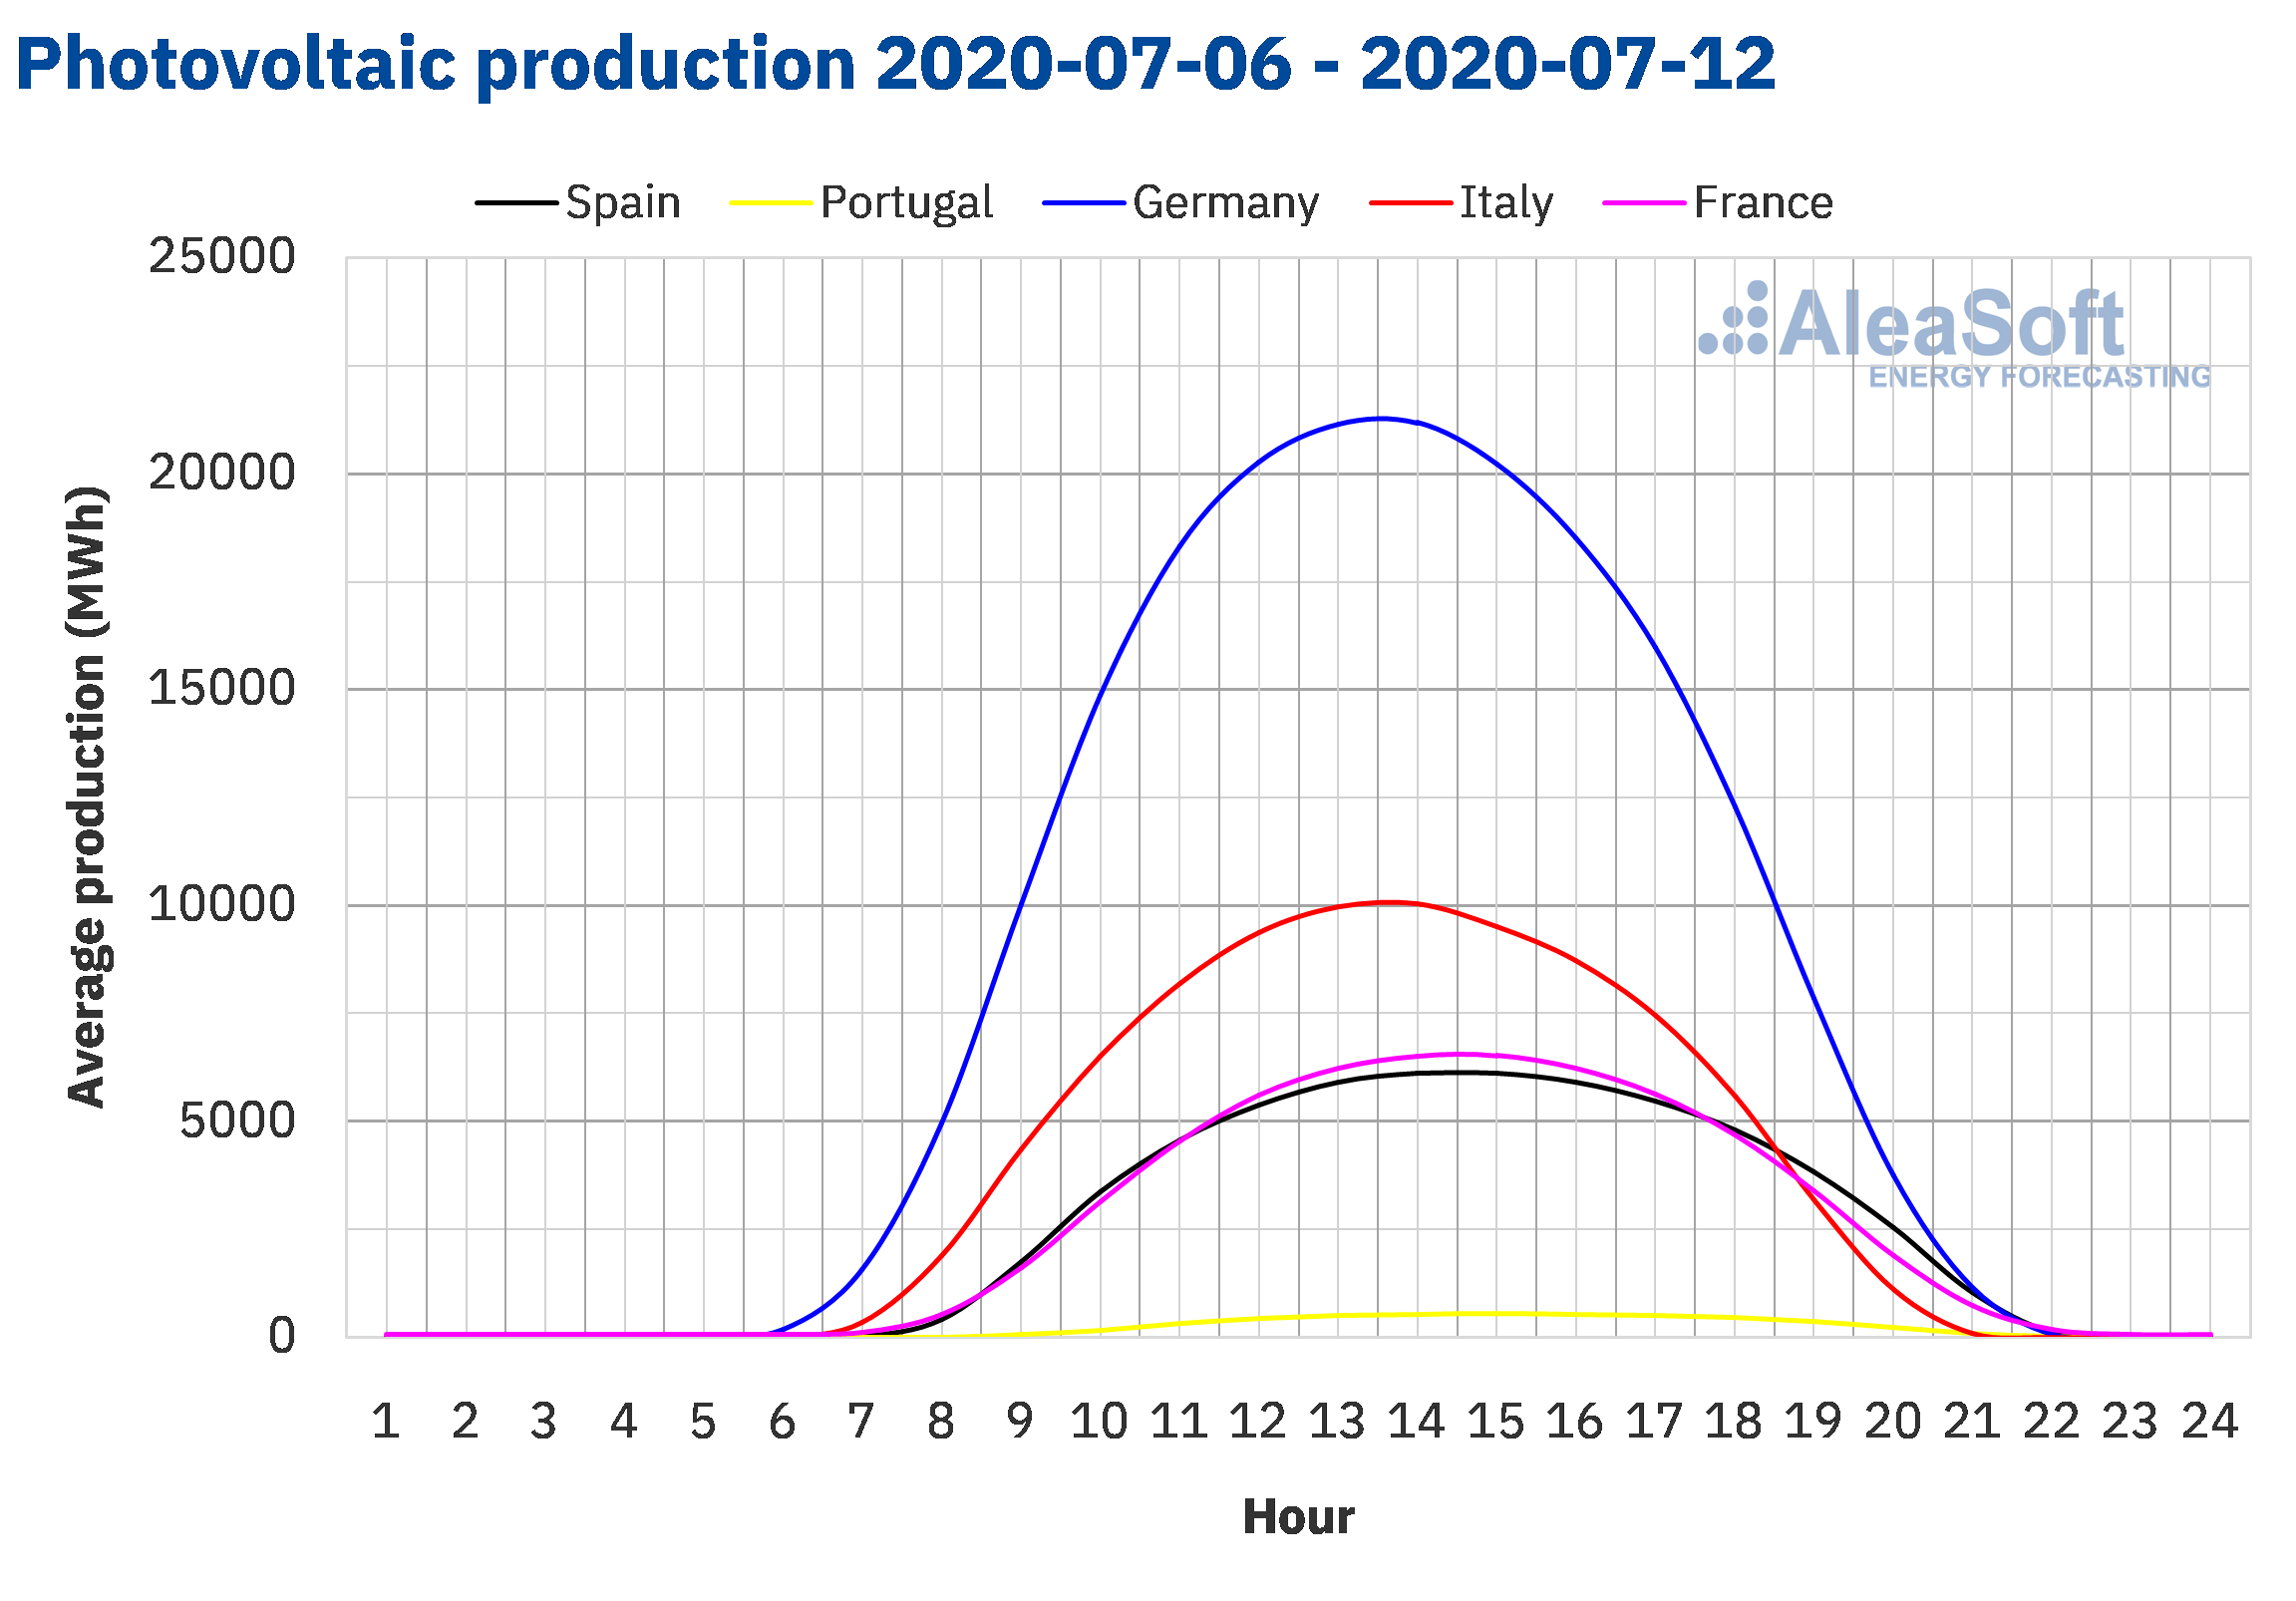
 Source: Prepared by AleaSoft using data from ENTSO-E, RTE, REN, REE and TERNA.
 Source: Prepared by AleaSoft using data from ENTSO-E, RTE, REN, REE and TERNA.
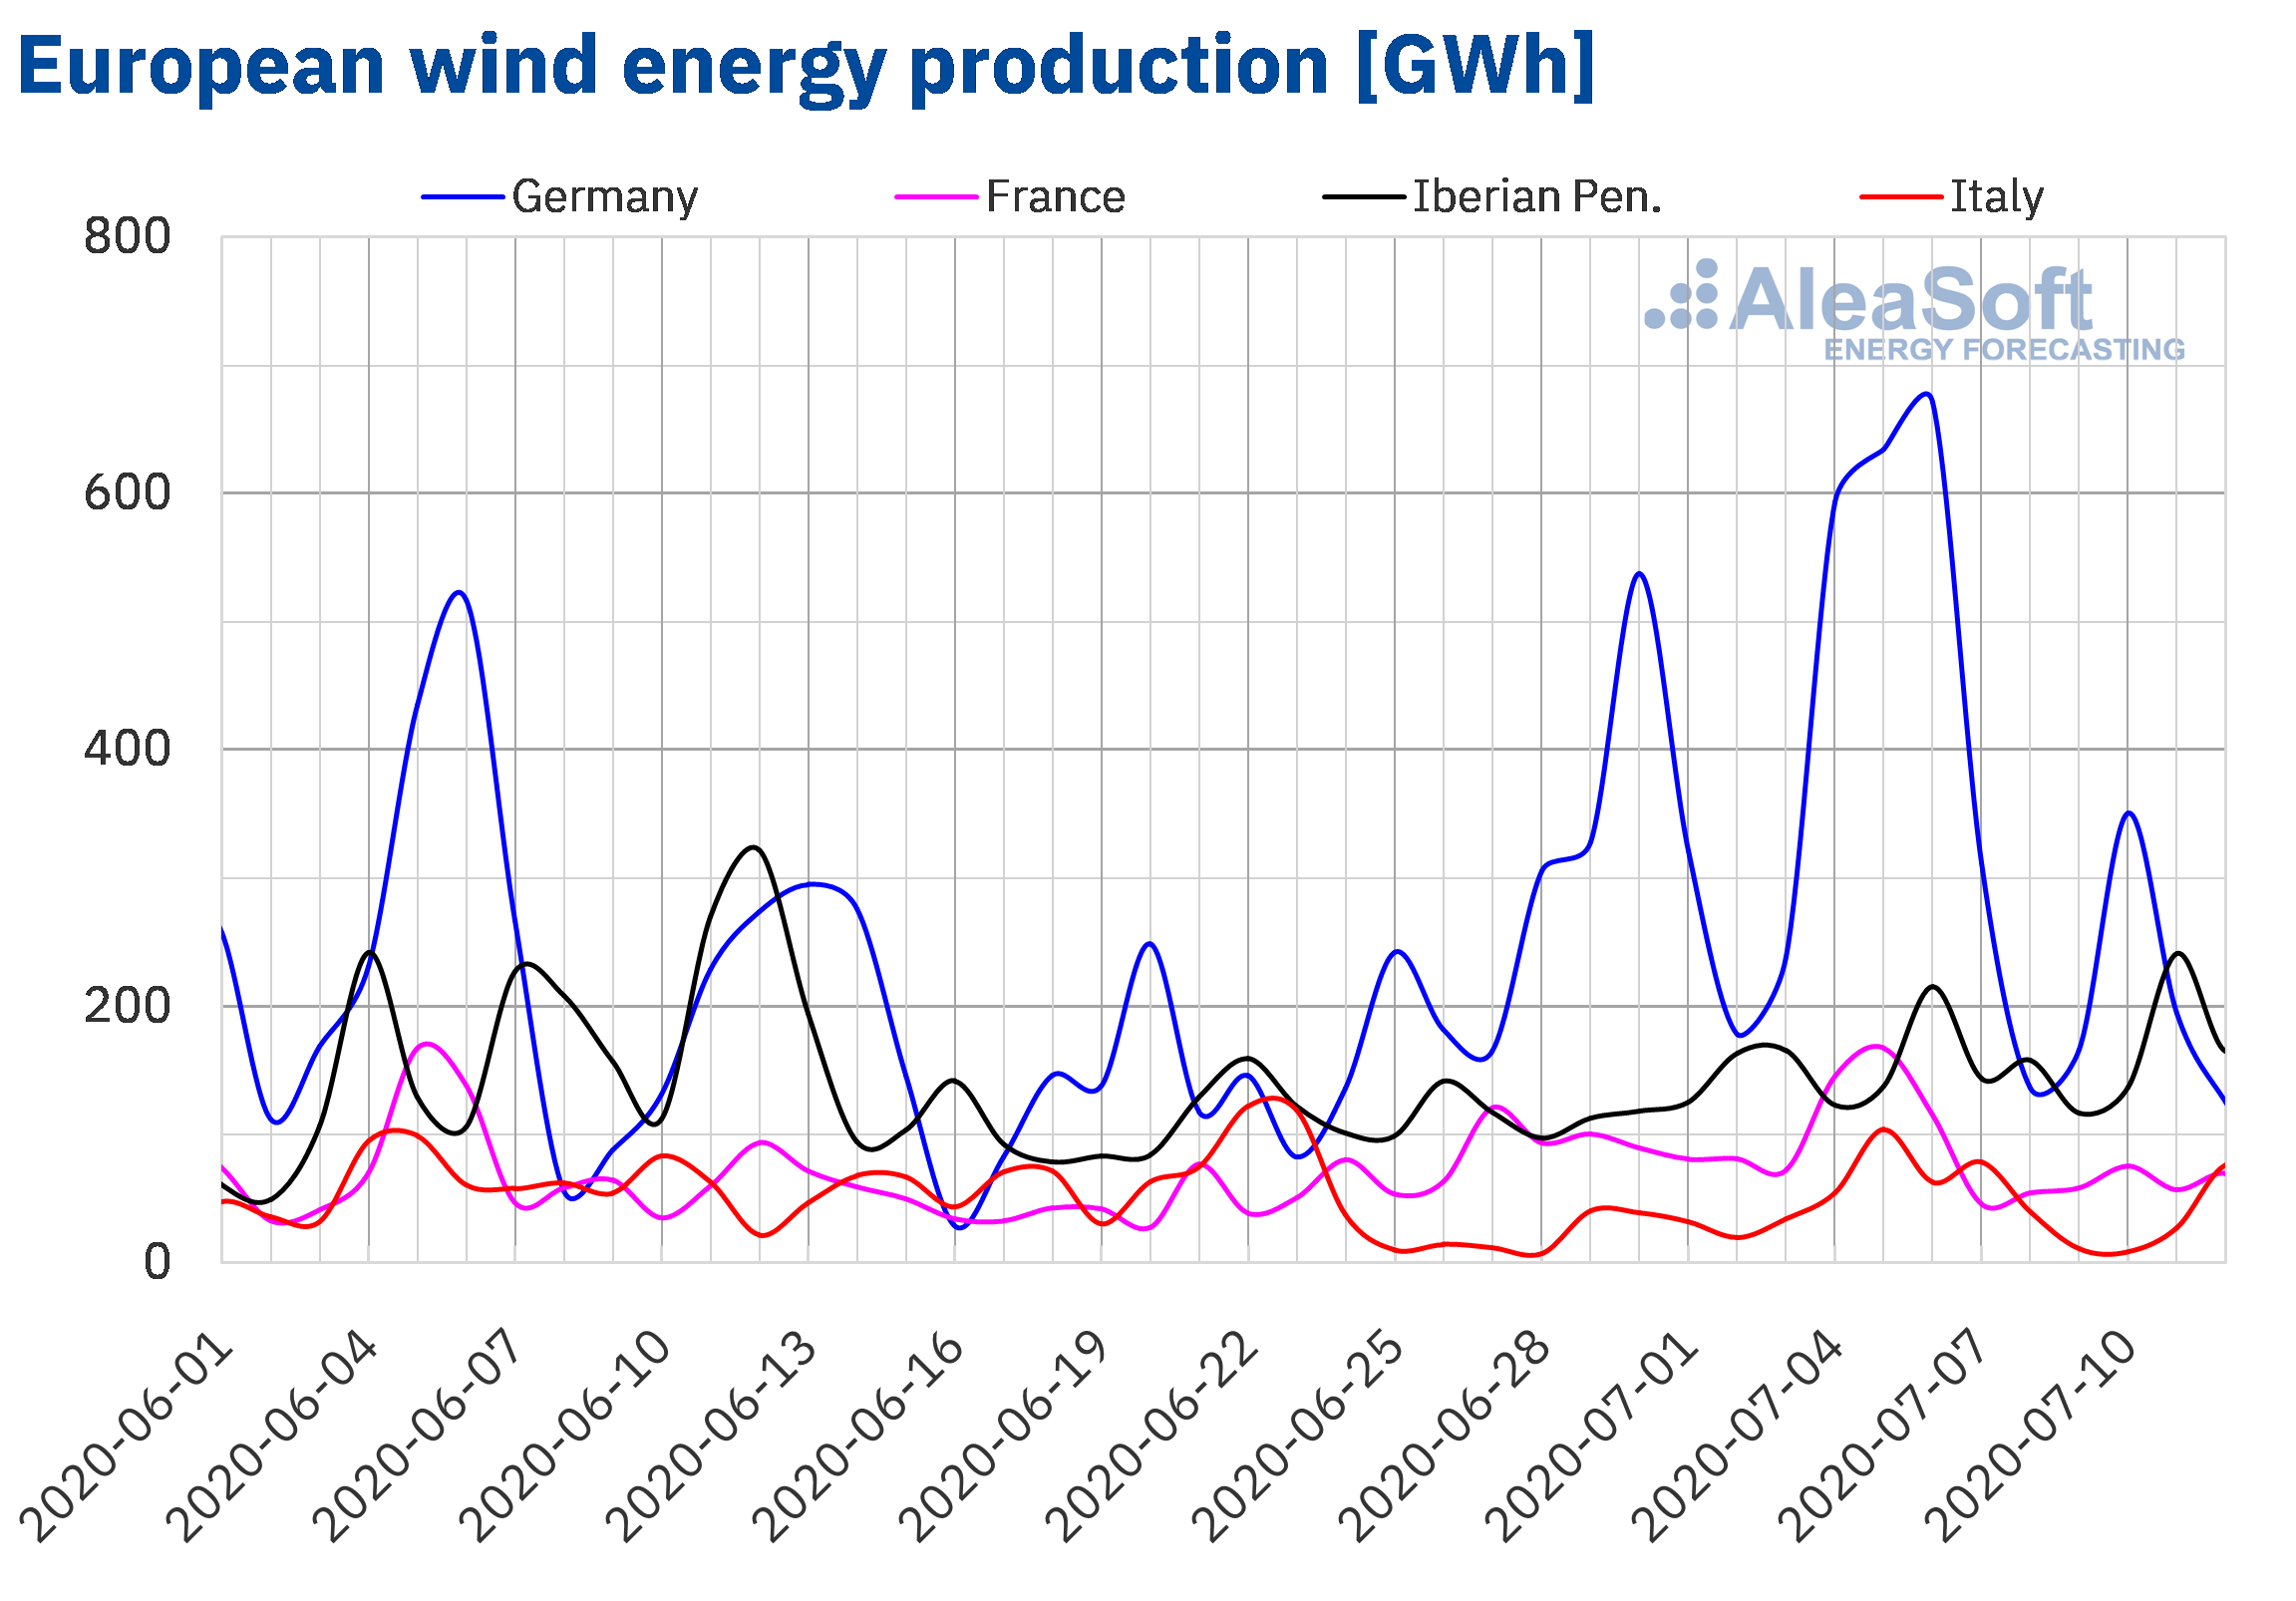
Between July 6 and 12, the wind energy production increased by 40% in the Spanish market compared to the period from Monday, June 29, to Sunday, July 5. In the rest of the European markets analysed at AleaSoft, the production with this technology decreased between 6.3% and 35%.
In the year‑on‑year analysis, between July 1 and 12, the wind energy production was higher in all the markets analysed at AleaSoft. The greatest difference between these periods was registered in the Portuguese market, where the production grew by 65%. In the markets of France and Spain the increases were 62% and 48% respectively. In the Italian market it increased by 25% and in the German market by 20%.
For the week of July 13, the AleaSoft‘s wind energy production forecasting indicates an increase in wind energy production in the Iberian and Italian markets. On the contrary, in the markets of Germany and France a reduction in production is expected compared to that of the week of July 6.
 Source: Prepared by AleaSoft using data from ENTSO-E, RTE, REN, REE and TERNA.
Electricity demand
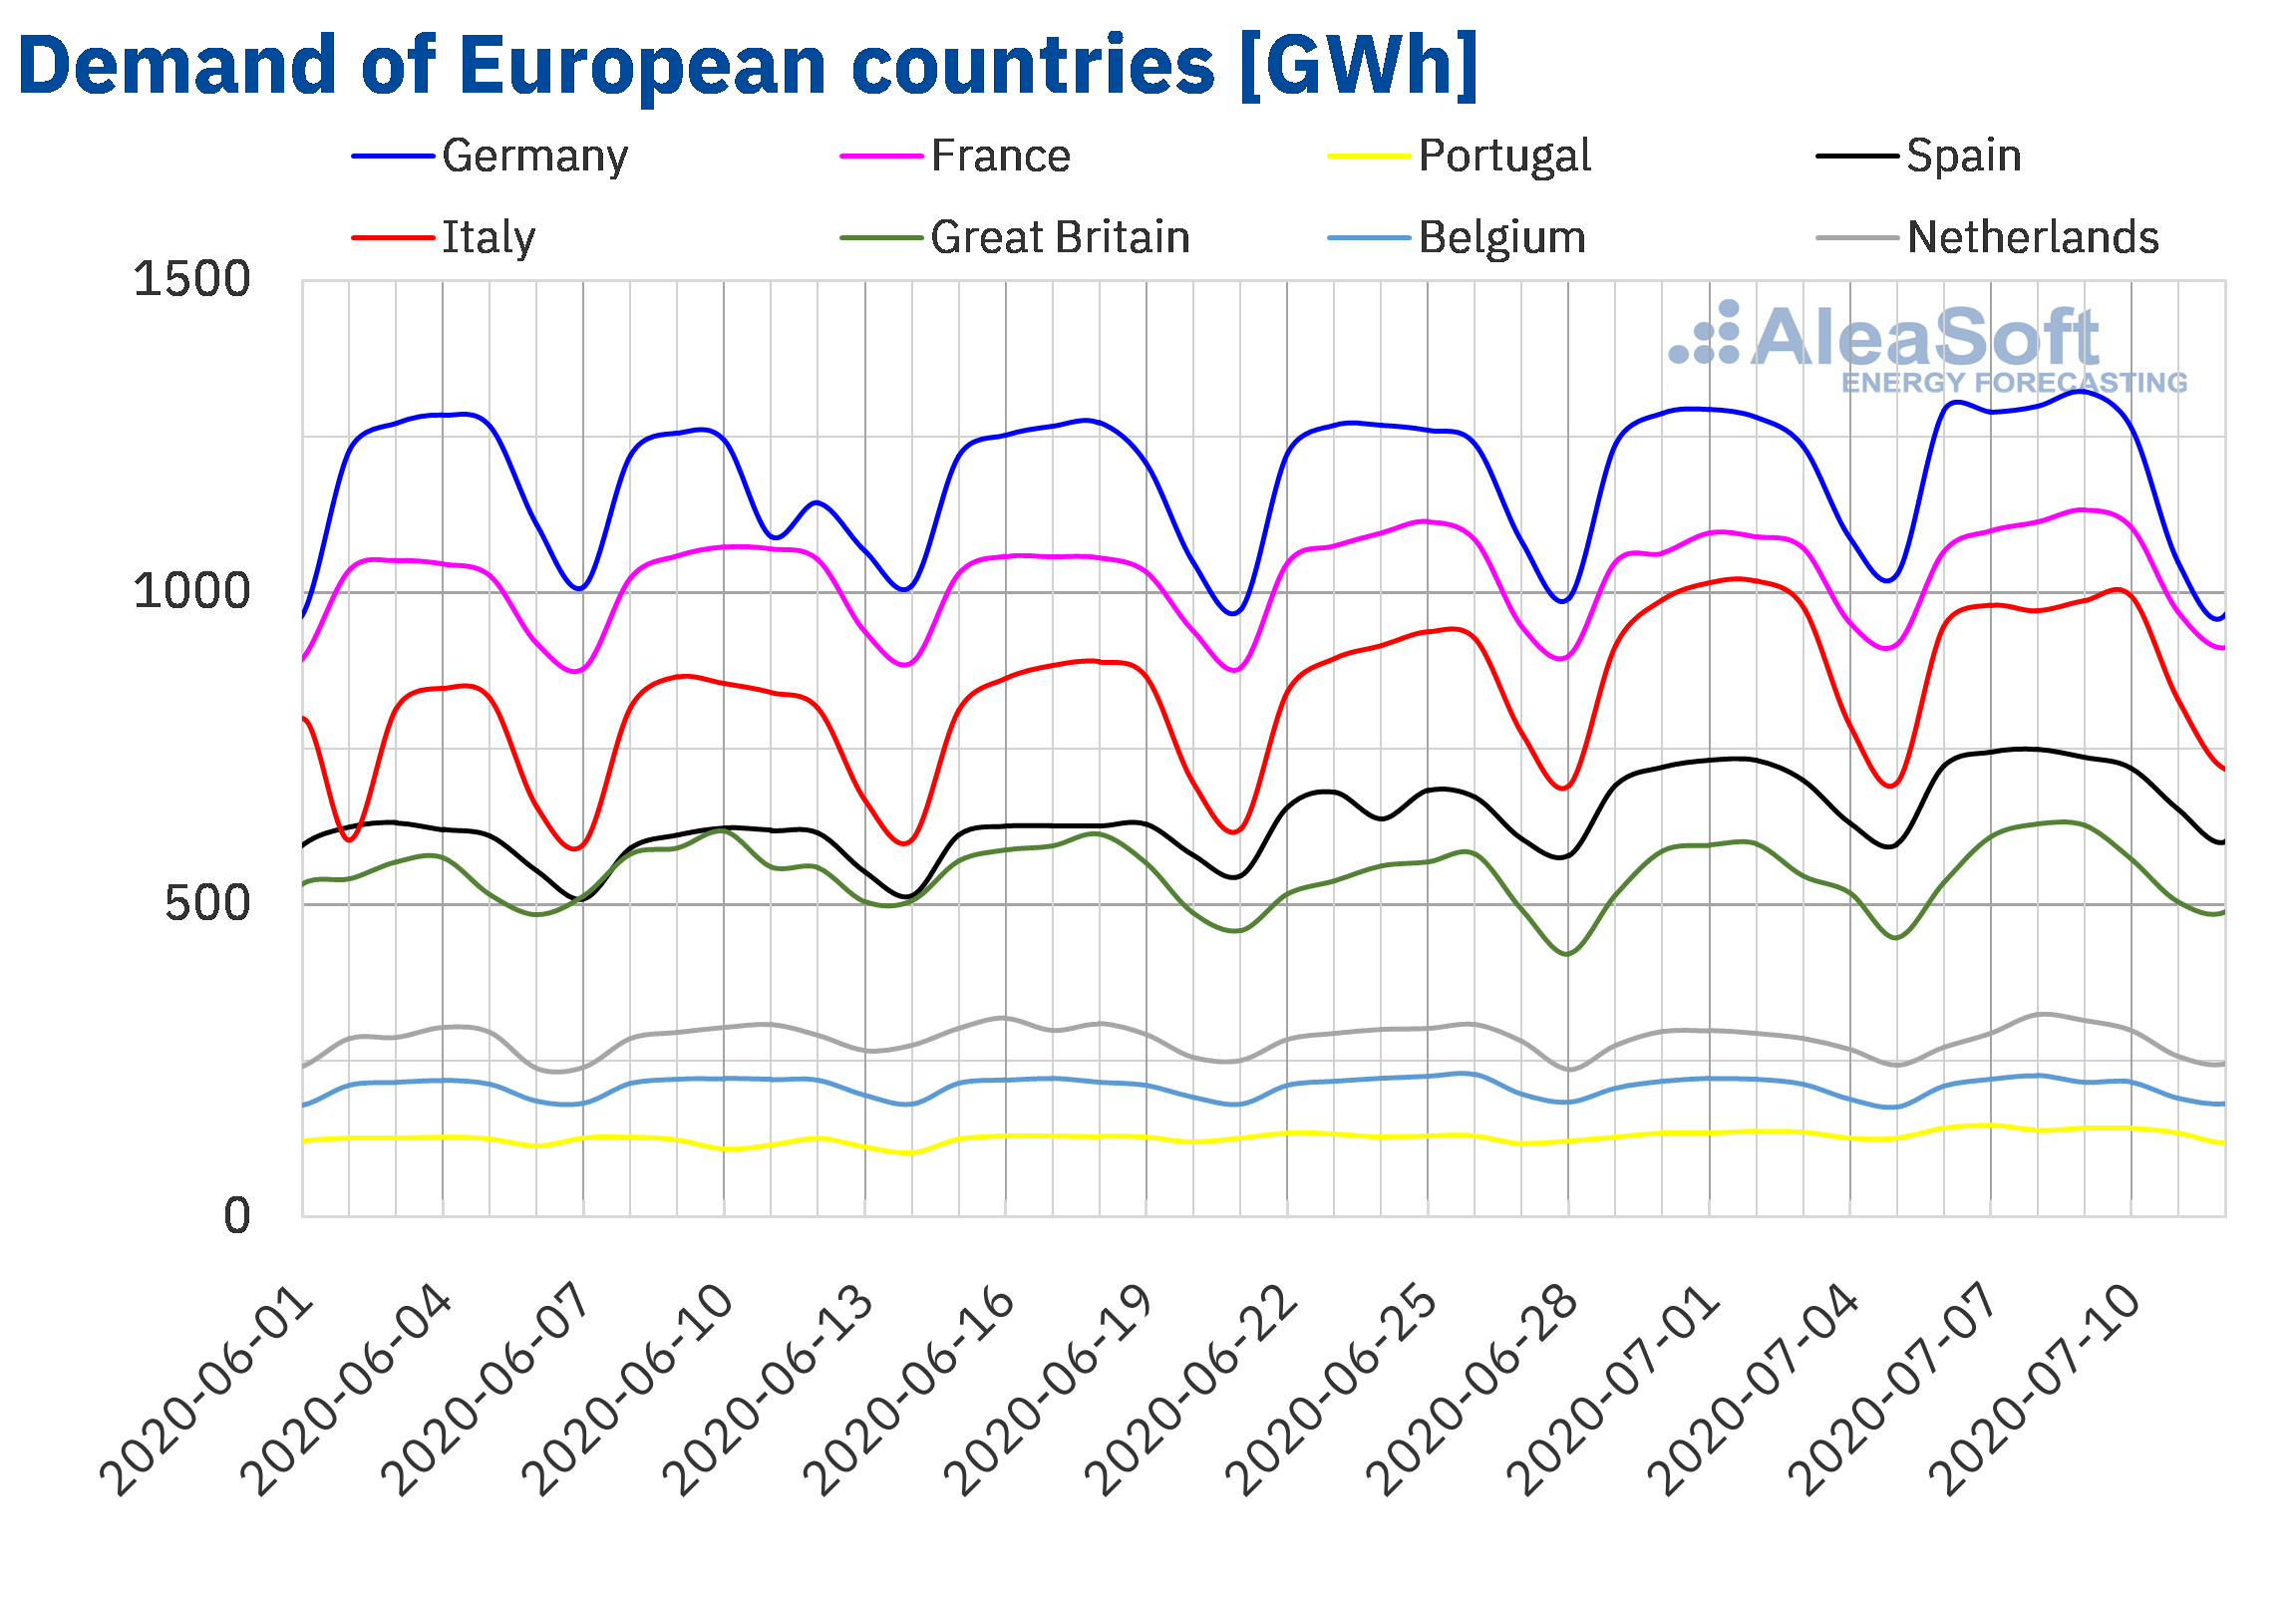
In the week of July 6, the electricity demand recovered in all the analysed European markets compared to the week of June 29. The largest increase was 4.6% in the Portuguese market, with important increases during Monday and Tuesday compared to the same days of the previous week. Great Britain was the second market with the largest variation in demand, of 4.2%. Other markets that had increases above 2.0% were those of France, Spain and the Netherlands.
For a more detailed analysis of the behaviour of the electricity demand in Europe, the AleaSoft‘s electricity markets observatories are available.
At AleaSoft, the electricity demand is expected to decrease during the week of July 13 in most of the analysed European electricity markets.
 Source: Prepared by AleaSoft using data from ENTSO-E, RTE, REN, REE, TERNA, National Grid and ELIA.
European electricity markets
The week of July 6, the prices increased in most of the analysed European electricity markets compared to those of the week of June 29. The exception was the IPEX market of Italy with a decrease of 2.6%. On the other hand, the market with the highest price rise, of 44%, was the EPEX SPOT market of Germany, followed by the Nord Pool market of the Nordic countries, with an increase of 31%. While the market where the price rose the least, by 0.3%, was the MIBEL market of Spain, followed by the MIBEL market of Portugal, with a variation of 0.4%. In the rest of the markets, the price increases were between 19% of the EPEX SPOT market of France and 26% of the EPEX SPOT market of the Netherlands.
The week of July 6, the market with the lowest average price, of €2.42/MWh, was the Nord Pool market. The rest of the analysed markets were quite coupled and presented weekly averages above €30/MWh. The reached average prices were between €31.34/MWh of the EPEX SPOT market of the Netherlands and €35.57/MWh of the IPEX market.
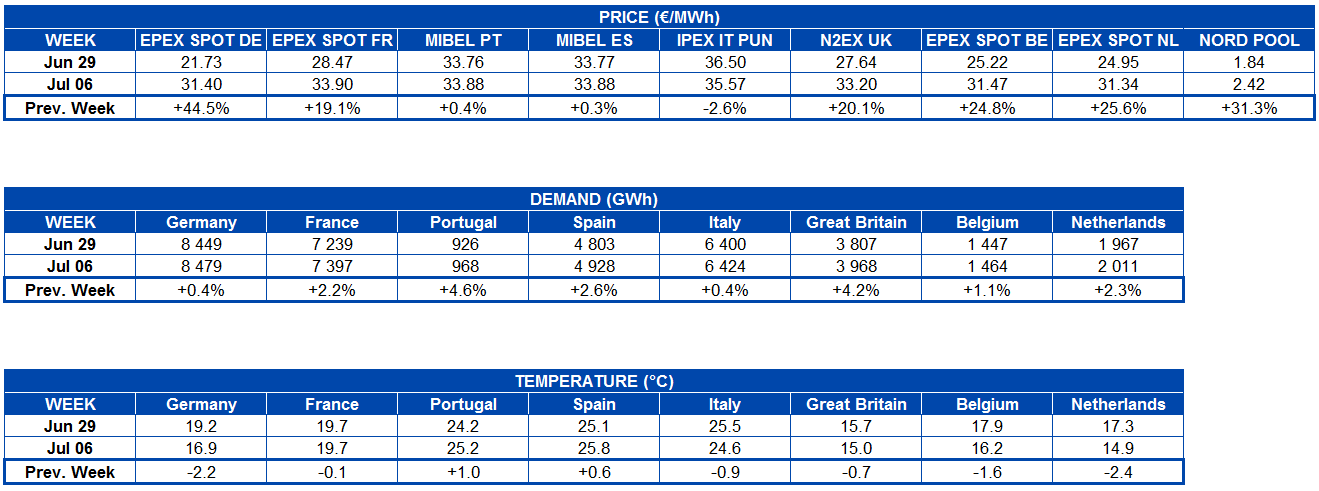
The price increases in the electricity markets were related to the general increase in electricity demand in Europe, the decrease in solar energy production in some markets and the decrease in wind energy production around midweek. The increase in CO2 prices also favoured this behaviour of the electricity markets. The combination of these factors led to daily prices close to or above €40/MWh being reached on July 8 and 9 in most markets. The highest daily price, of €42.42/MWh, was that of Thursday, July 9, in the EPEX SPOT market of Germany. This daily price was the highest reached in the German market since the end of January and it contrasts with the price of €14.28/MWh of Monday, July 6, of this same market.

On July 6, the high wind energy production led to negative hourly prices in the markets of Germany, Belgium, Denmark, Finland, Great Britain, Ireland, the Netherlands, Sweden, Estonia, Latvia, Lithuania and three areas in Norway. In the case of Norway and the Baltic countries, negative hourly prices had not been reached since at least 2013. These prices were favoured by the high wind energy production of that day, in addition to high levels of hydroelectric energy production in the case of the Nordic countries.
However, on July 8 and 9, the hourly prices exceeded €50/MWh for some hours of the markets of Germany, Belgium, France, Great Britain and Italy due to the reduction in wind energy production.
 Source: Prepared by AleaSoft using data from OMIE, EPEX SPOT, N2EX, IPEX and Nord Pool.
The AleaSoft‘s price forecasting indicates that the week of July 13 the prices will increase in the EPEX SPOT markets due to the decrease in wind energy production. While in the IPEX and MIBEL markets, where the production with this technology is expected to increase, the prices will decrease.
Electricity futures
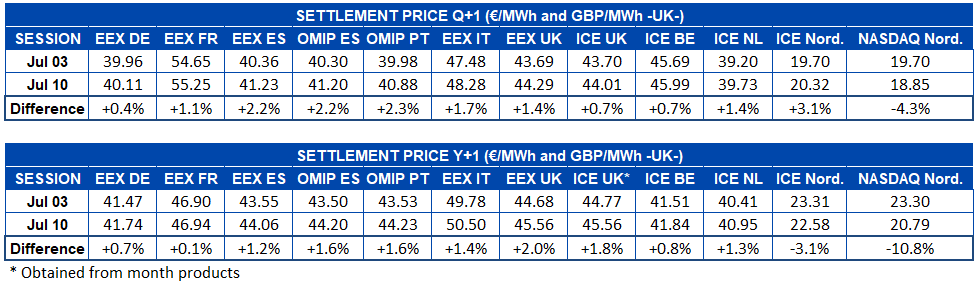
The electricity futures prices for the next quarter, Q4‑20, during the week of July 6 registered increases in almost all the markets analysed at AleaSoft. The exception was the NASDAQ market of the Nordic countries, in which the prices fell by 4.3% compared to the settlement price of the session of Friday, July 3. In the rest of the markets, the price increased and, coincidentally, it was the ICE market of the Nordic countries that registered the greatest percentage rise, with a variation of 3.1%. Regarding absolute values, the OMIP market of Spain and Portugal presented the greatest increase, of €0.90/MWh in both cases.
Regarding the electricity futures price for the year 2021, increases were also registered during the 28th week of the year. In this case, both the ICE market and the NASDAQ market of the Nordic countries opposed this behaviour, registering decreases of 3.1% and 11%, respectively. The EEX market of France was the one with the least variation, with an increase of only 0.1%. On the other hand, the EEX market of Great Britain was the one with the highest increase, with an increase of 2.0%.
Brent, fuels and CO2
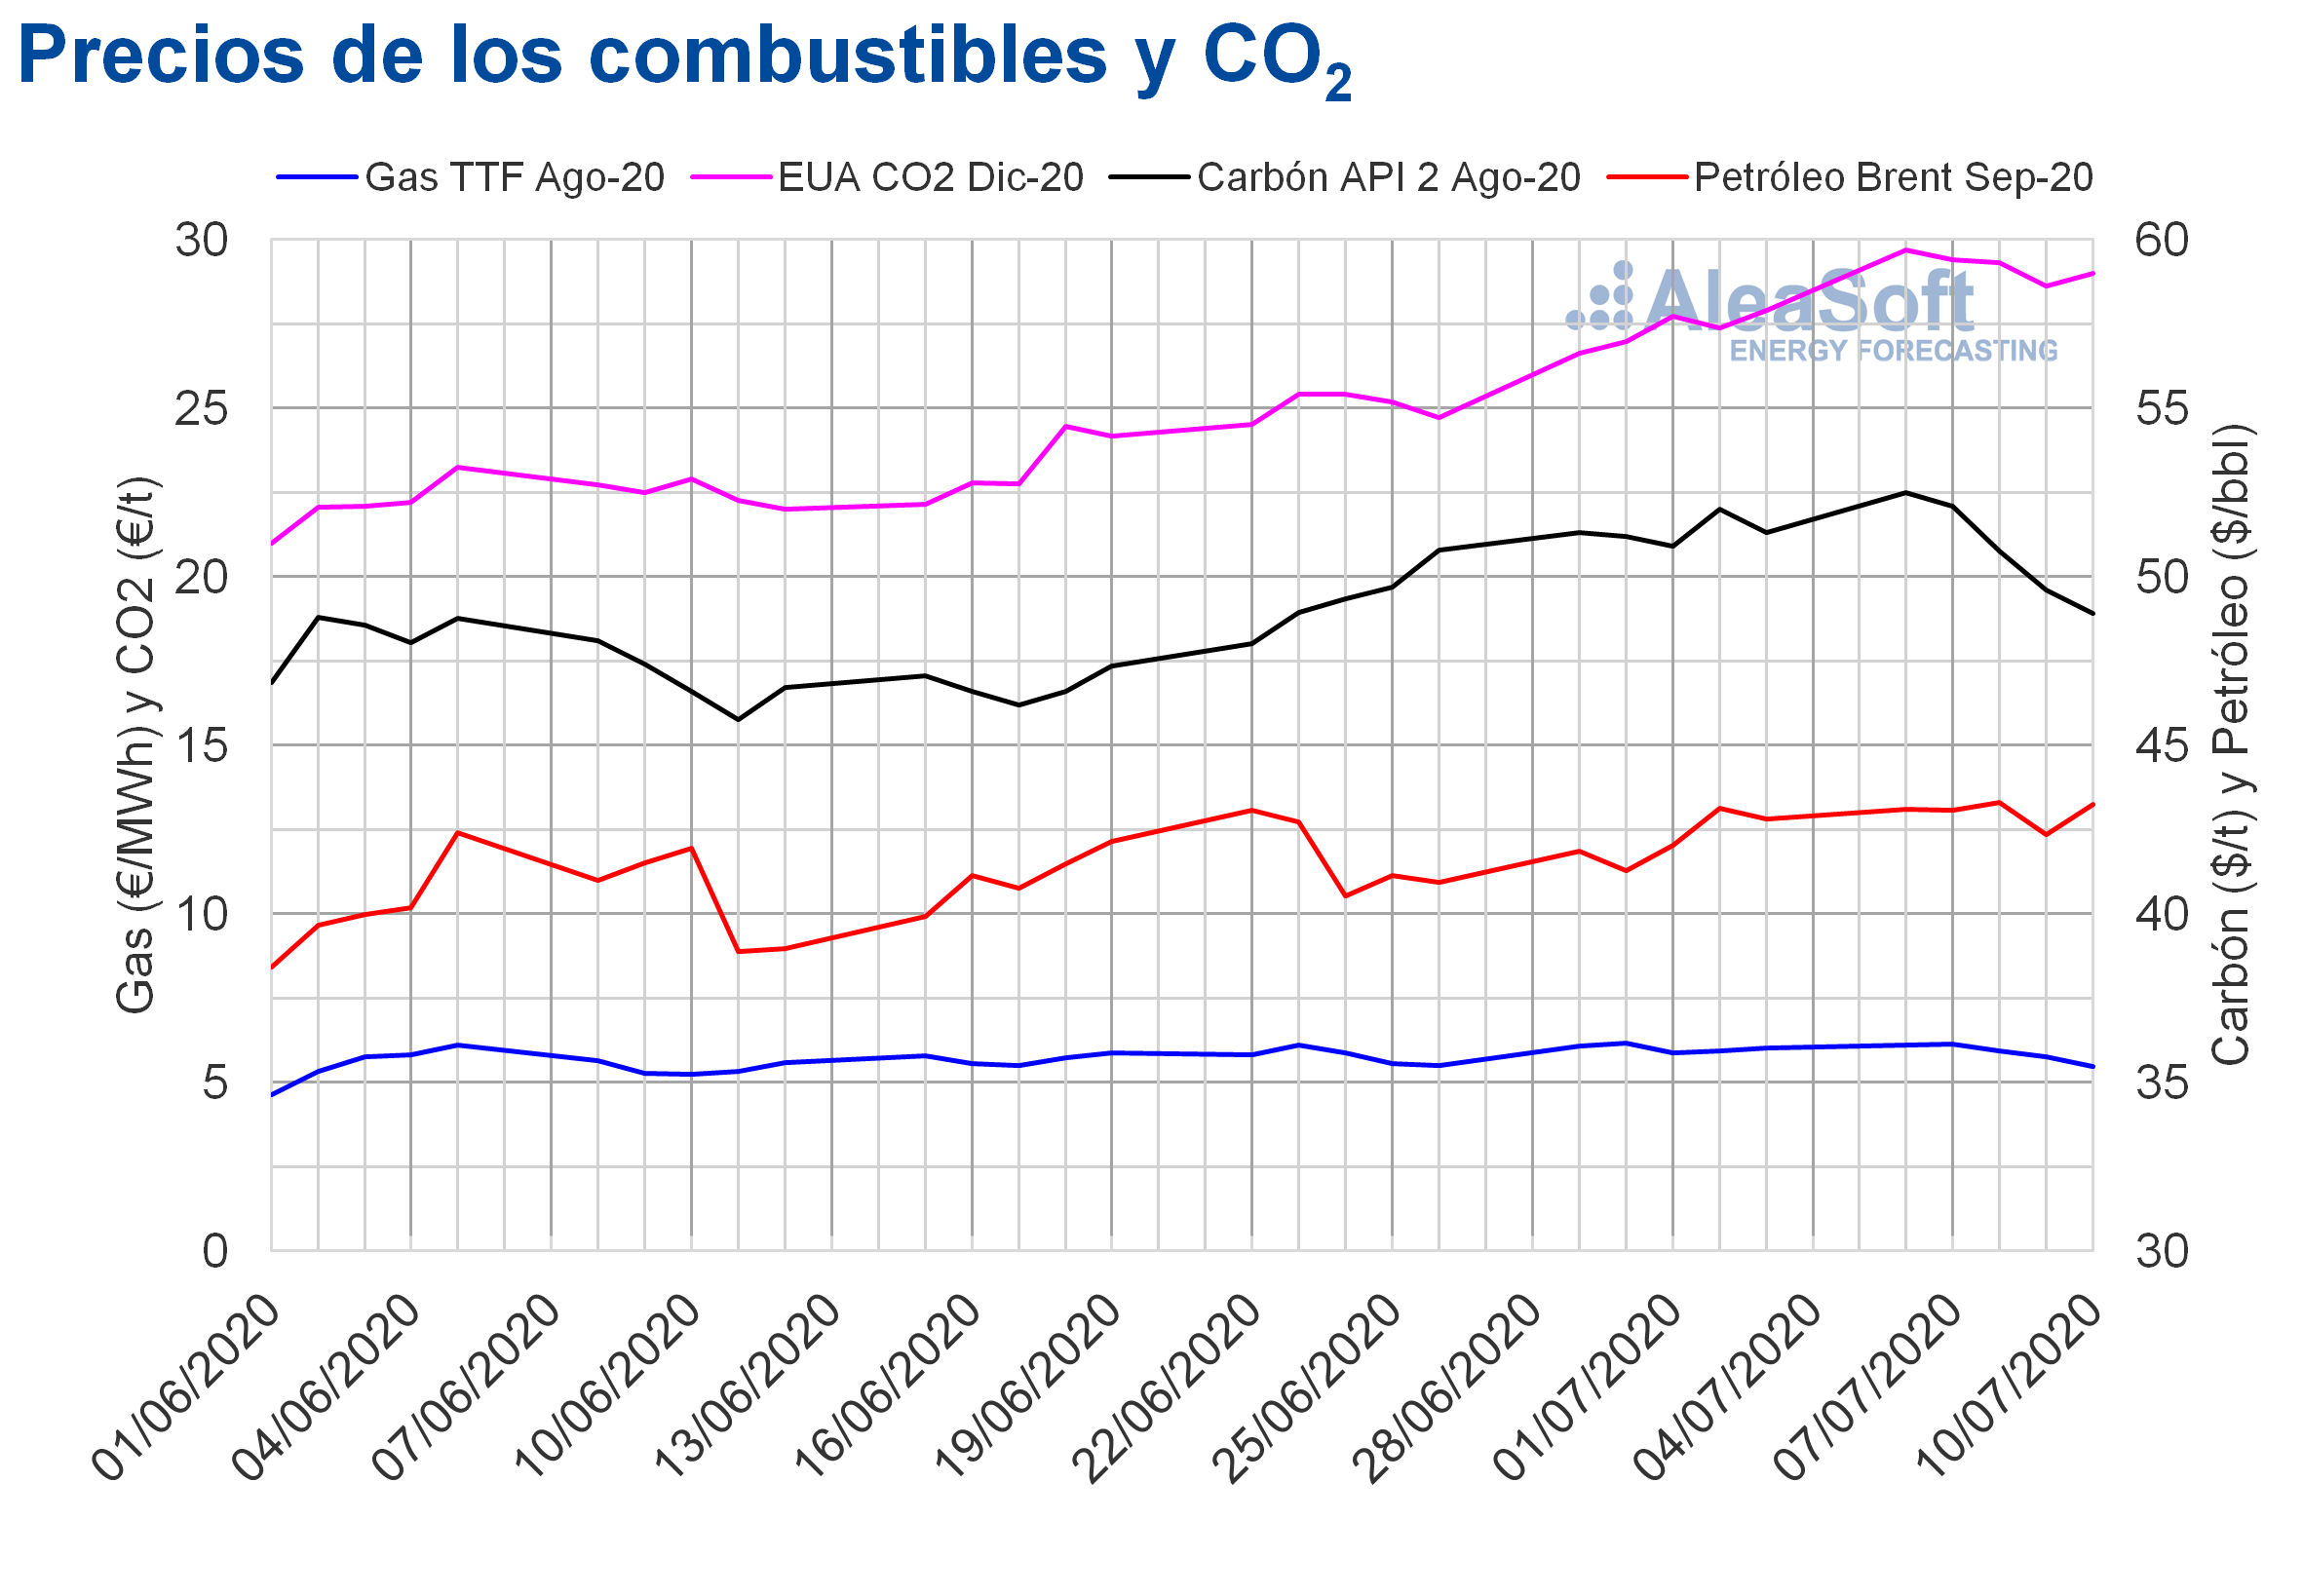
The Brent oil futures for the month of September 2020 in the ICE market, most of the week of July 6, had settlement prices above $43/bbl, with the exception of Thursday, July 9, when the price fell by 2.2% to $42.35/bbl. The maximum settlement price of the week, of $43.29/bbl, was reached on Wednesday, July 8, and it was the highest since early March.
The recovery of Friday, July 10, to exceed $43/bbl again, after Thursday’s decline, is related to the upward revision by the International Energy Agency of its forecast on oil demand for 2020. However, the increase in COVID‑19 cases in the Americas jeopardises this recovery in demand.
On the other hand, in the coming days the evolution of the prices will be conditioned by the news related to the OPEC+ meeting scheduled for next Wednesday, July 15. At this meeting, a decision must be made regarding the continuity of the production cuts from the month of August. Furthermore, the increase in tensions in Libya may also affect the supply from this country, exerting an upward influence on prices.
As for the TTF gas futures in the ICE market for the month of August 2020, after reaching the maximum settlement price of the week, of €6.12/MWh, on Tuesday, July 7, their prices started a downward trend. As a consequence, on Friday, July 10, the settlement price was €5.48/MWh, 9.2% lower than that of Friday, July 3, and the lowest since €5.32/MWh of June 11.
Regarding the TTF gas prices in the spot market, they started the week of July 6 with an upward trend until reaching an index price of €5.62/MWh on Wednesday, July 8. But then the prices fell to €4.60/MWh of the weekend. This price was the lowest from €4.52/MWh of June 11. On Monday, July 13, the index price recovered to €4.71/MWh.
On the other hand, the API 2 coal futures prices in the ICE market for the month of August 2020, on July 6, registered a settlement price of $52.50/t, the highest since the end of March. But, subsequently, the prices began to drop until reaching a settlement price of $48.90/t on Friday, July 10. This was 4.7% lower than that of Friday of the week of June 29 and the lowest in the last two weeks.
As for the CO2 emission rights futures prices in the EEX market for the reference contract of December 2020, they started the week of July 6 with the highest settlement price since the beginning of August 2019, of €29.69/t. But afterwards, the prices began to fall until reaching a settlement price of €28.62/t on Thursday, July 9. However, on Friday the prices recovered 1.4%, settling at €29.01/t. Despite the downward trend of most of the week, the prices of each day were higher than those of the same days of the week of June 29.
 Source: Prepared by AleaSoft using data from ICE and EEX.
AleaSoft analysis on the effects on the electricity markets due to the coronavirus crisis
At AleaSoft the webinar “Energy markets in the recovery of the economic crisis” is being organised for September 17. The energy markets are currently in a recovery phase after the declines that occurred in the most critical part of the pandemic. However, there is uncertainty about its evolution due to the new outbreaks of the epidemic that are taking place, which could intensify in the autumn when the in person school year begins, and due to the pessimistic prospects for the growth of the economy. This will be one of the topics that will be addressed in the webinar together with the status of the financing of the renewable energy projects, analysing both the impact during the crisis and the prospects for the economic and the energy markets recovery.
In this context, at AleaSoft the long‑term price curves were updated with the most recent scenarios of recovery from the coronacrisis.
The evolution of the electricity markets can also be consulted at the AleaSoft‘s energy markets observatories, which include daily updated data of the main variables of the thirteen largest electricity markets in Europe, as well as spot and futures markets for oil, gas and coal, and CO2 emission rights.
Source: AleaSoft Energy Forecasting.