October 10th, 2017 – In the third quarter of 2017, the price of the Spanish wholesale electricity market OMIE was clearly above the price in the same period of 2016, specifically 6.67 €/MWh above. The main cause is still the low hydro and wind energy production, with values in this last quarter not seen in the last decade. However, it should be noted that the price differences with 2016 were greatly reduced compared to the differences observed in the first half of the year, when these distances with the last year were 21.17 €/MWh on average and coincided with the French nuclear power plants crisis and the increase of electricity exports to the neighboring country.
Evolution of the most important variables of the Spanish market in the third quarter of 2017
According to data published by REE (Red Eléctrica de España), the electricity demand in Spain, excluding the island territories and Ceuta and Melilla, in the third quarter of 2017 was 0.1% lower than the same quarter of 2016. The less extreme temperatures of this summer, 0.7°C lower on average, were the main reason of the lower demand. In fact, once the effects of temperature and working patterns were corrected, the year-on-year variation of the demand was positive, +0.1%. The Spanish economy is expected to grow by 3.2% year-on-year in this quarter.
Looking month by month, July and August had the higher year-on-year demand growth values, 0.9% and 1.6%, respectively. While in September, the demand fall by 3.0% with respect to the same month of 2016, pushed down mainly by a fall of the temperatures of 1.4°C with respect to the same month of the previous year.
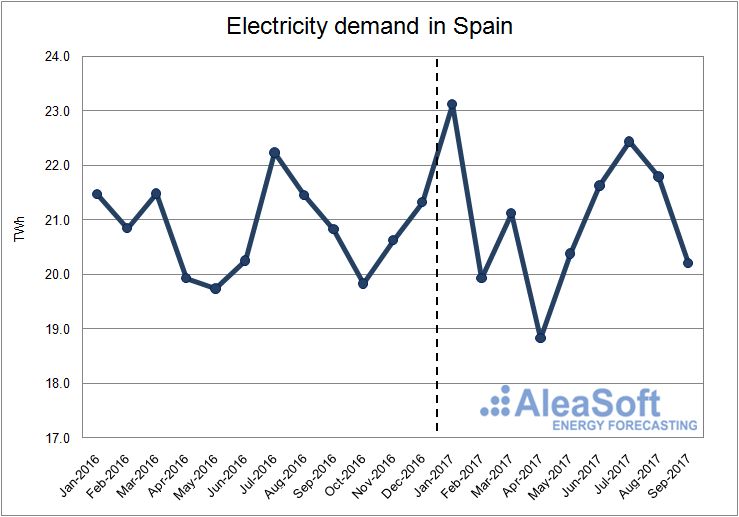
Evolution of electricity demand in Spain.
Data source: REE.
Wind energy production declined by 3.8% year-on-year in this third quarter. It followed a downward trend in the year-on-year comparison that was already seen in the first two quarters of 2017, though the trend was clearly decelerated in this third quarter. Due to the intrinsic volatility of the wind energy and the typically low values in summer, we saw large year-on-year falls in the production, 9.4% in August, and large increases, 4.8% in September.
According to data published by REE, until August, the wind power installed in mainland Spain during 2017 decreased by 59 MW.
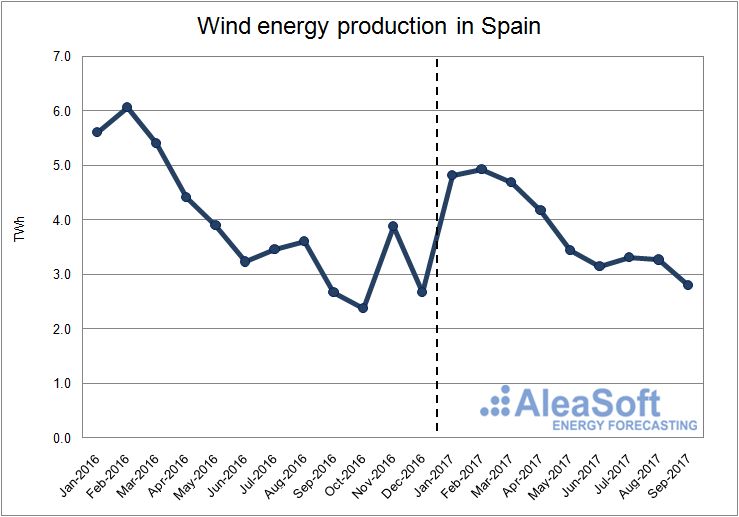
Evolution of wind production in Spain.
Data source: REE.
The third quarter of 2017 was the summer with lower hydroelectric production of the last decade, with a production 4.4% lower than in the summer of 2009 that, until now, was the lowest of the last ten years. Month by month, the lowest values were registered in July and August, while in September the trend changed and the production started to recover weakly.
Compared to the third quarter of 2016, the decrease of the hydroelectric production was of 41.6%.

Evolution of hydroelectric production in Spain.
Data source: REE.
Nuclear production slightly decreased by 0.5% so far this year, compared to the same period of 2016.
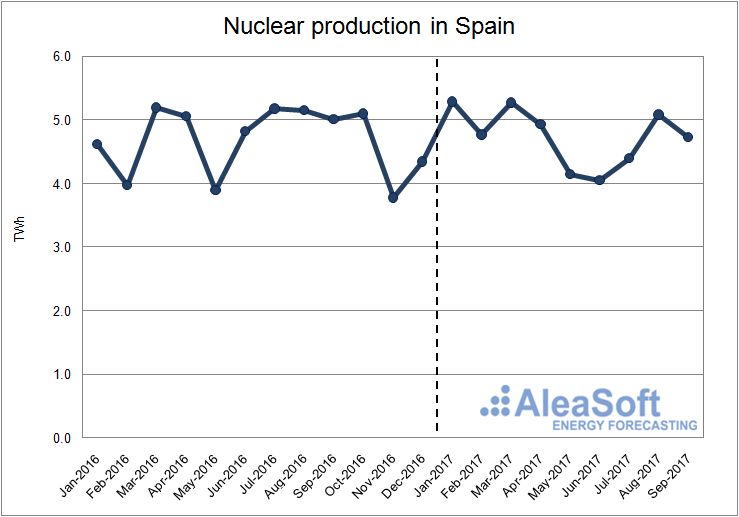
Evolution of nuclear production in Spain.
Data source: REE.
The generation of electricity using coal in the third quarter of 2017 decreased 13.4% with respect to the same quarter in 2016. This decrease occurs after a spectacular year-on-year increase in the production in the two first quarters of 2017, 69.8% and 143.7%, respectively. In the first half of the year, coal-fired power plants had to fill the gap left by the decrease of the main renewable technologies (hydro and wind) and the increase in the exports to France to cover their demand during the shutdown of most of their nuclear power plants.
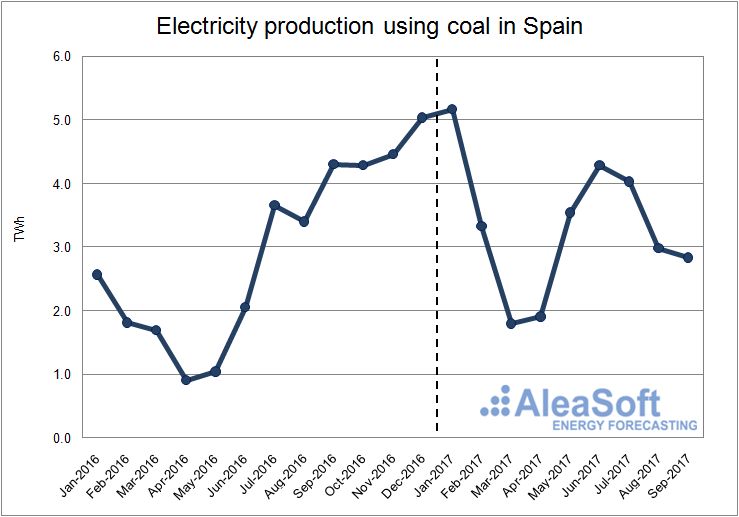
Evolution of electricity production using coal in Spain.
Data source: REE.
In contrast to electricity production with coal, combined cycle production increased 61.3% this third quarter with respect to the same quarter of the last year. While the coal-fired plants were filling most of the thermal gap in the first half of the year, in the third quarter the combined-cycle plants overcame the coal-fired production, in part due to the rise in the price of the coal in the last months.
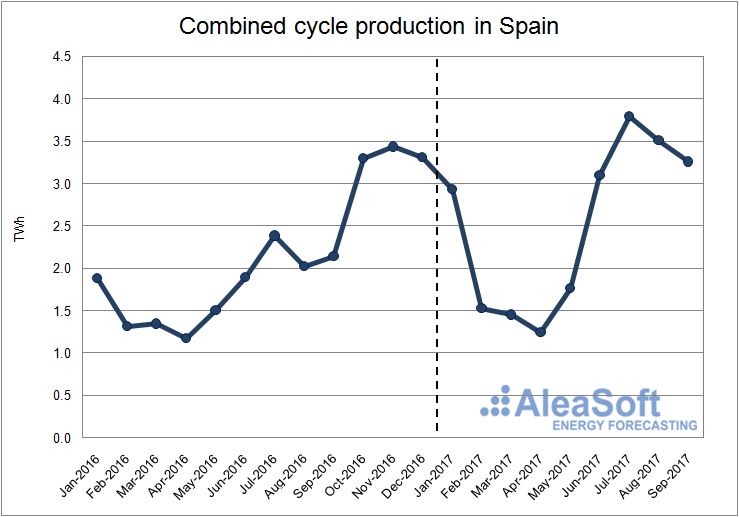
Evolution of combined cycle production in Spain.
Data source: REE.
Solar photovoltaic production slightly decreased 0.9% in the third quarter of 2017 with respect to the same quarter of 2016. According to data published by REE, until August, 0.5 MW of this technology were installed in mainland Spain during 2017.

Evolution of solar photovoltaic production in Spain.
Data source: REE.
In the case of solar thermal production, there was also a slight decrease in the production of 0.2% in the third quarter of 2017 with respect to the same quarter of last year. According to data published by REE, until August, the installed power of this technology in mainland Spain did not change, and 2017 is on its way to becoming the fourth consecutive year with not a single MW of solar thermal power installed.
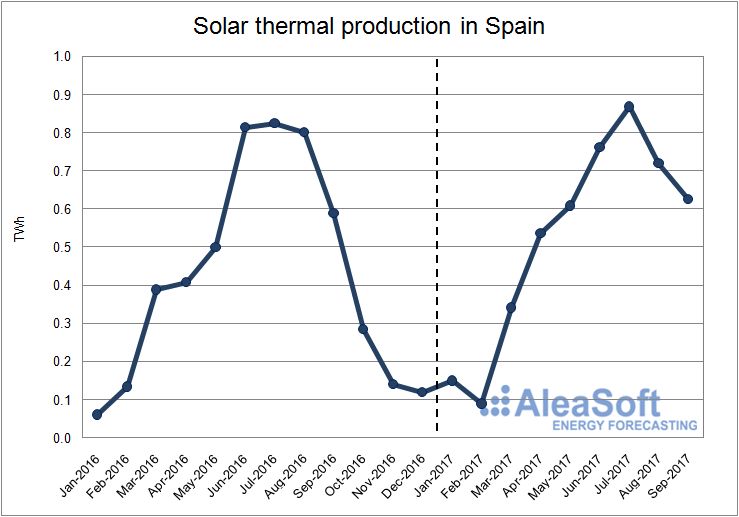
Evolution of solar thermal production in Spain.
Data source: REE.
Other renewable technologies, including biogas, biomass, offshore hydroelectric and geothermal, increased their production by 4.7% year-on-year in the third quarter of 2017. The largest increase was in July, 10.8%, while in August and September was much lower, 1.8% on average.
According to data published by REE, until August, the net balance of installed power of these technologies during 2017 was ‑0.7 MW.
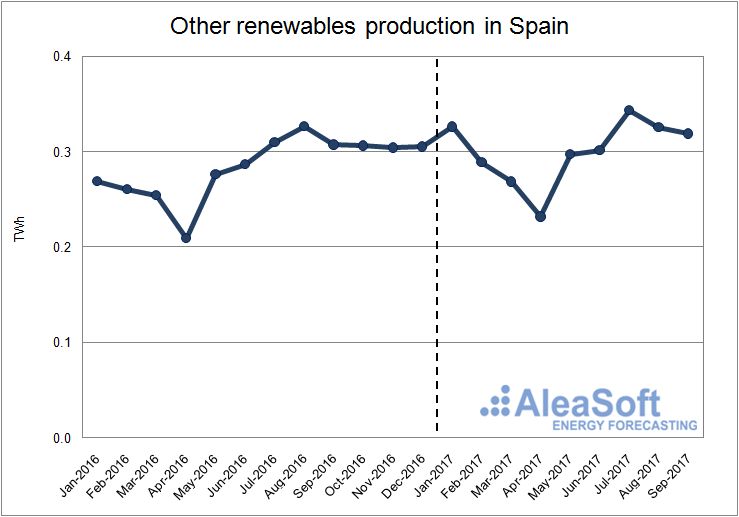
Evolution of production using other renewable technologies in Spain.
Data source: REE.
Cogeneration production in the third quarter increased 3.9% year-on-year. So far this year, the growth of the production goes up to 9.1% with respect to the same months of 2016.

Evolution of cogeneration production in Spain.
Data source: REE.
Production using waste decreased by 7.2% this third quarter. The largest year-on-year fall in the production was in July.
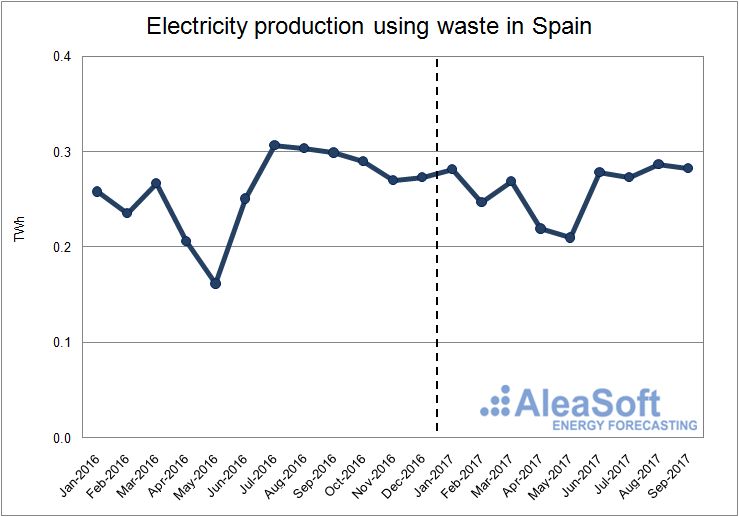
Evolution of electricity production using waste in Spain.
Data source: REE.
Prices of fuels for electricity generation
The third quarter of 2017 was characterized by the recovery of the prices of the main fuels used in electricity generation, after the downward trend of the first half of the year. The Brent barrel price and the coal CIF ARA overcame the price of the beginning of the year, but it was not the case of the Zeebrugge gas.
The Zeebrugge gas price hit bottom in July with a monthly average of 14.74 €/MWh. Since then, it started a slow recovery that brought the average price in September up to 17.03 €/MWh.
In September, the price of a barrel of Brent oil reached $56.17 on average, overcoming the monthly average maximum of 2017 until then that was in February with $54.87.
The price of European coal CIF ARA, which began the year close to 83 $/t, followed a downward trend during the first half of the year. In the third quarter it started to recover and reached an average value of 90.51 $/t in September.
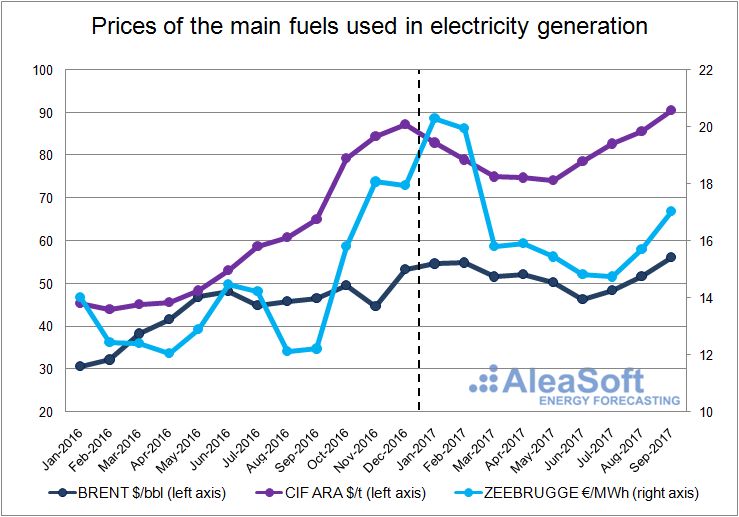
Evolution of the price of the main fuels used in electricity generation.
Data source: BRENT – EIA, CIF ARA – EEX, ZEEBRUGGE- NetConnect Germany.
Price of CO2 emission rights
The price of CO2 emissions rights in the third quarter of 2017 had a very similar behavior to the price of the main fuels for electricity generation. In the first half of the year the price fall down to 4.69 €/t on average in May, since then, it went up to 6.80 €/t on average in September.

Evolution of the price of CO2 emission rights.
Data source: EEX.
Spain – Portugal interconnection
The net balance of electricity exchanges between Spain and Portugal placed Spain as a net importer in every month in the first three quarters of 2017. The net balance for the first nine months of 2017 was 3134 GWh imported.
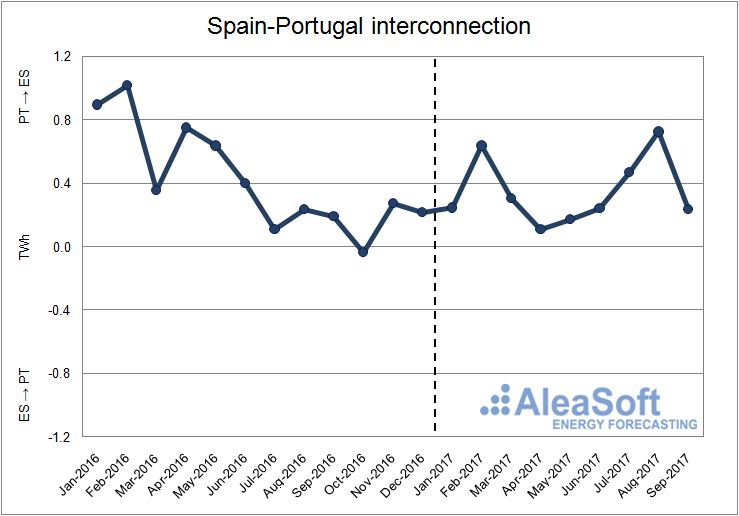
Evolution of the monthly net balance of the interconnection between Spain and Portugal. Positive values indicate that Spain imports electricity from Portugal, while negative values indicate that Spain exports electricity to Portugal.
Data sources: ENTSO-E and REE.
Spain – France interconnection
The net balance of electricity exchanges between Spain and France in the first three quarters of 2017 placed Spain as a net importer with 11093 GWh imported from France. January was the only month with an exporting balance for Spain, 354 GWh, as the energy exported to France increased due to the temporary shutdown of many of their nuclear power plants.
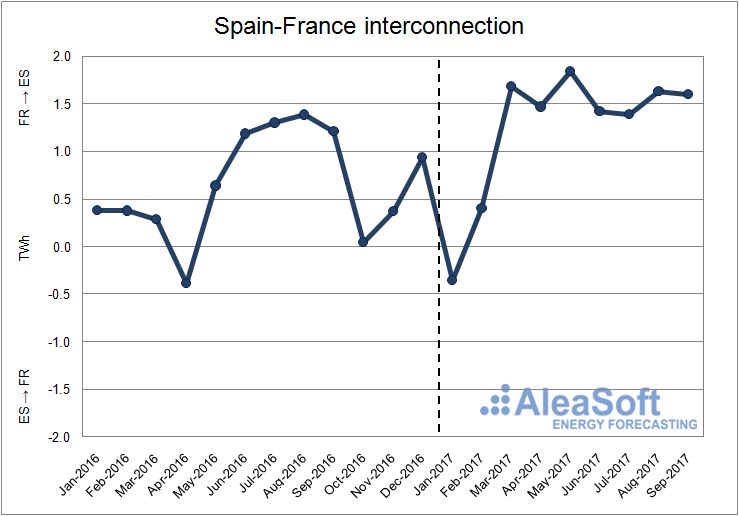
Evolution of the monthly net balance of the interconnection between Spain and France. Positive values indicate that Spain imports electricity from France, while negative values indicate that Spain exports electricity to France.
Data sources: ENTSO-E and REE.
The Spanish electricity day-ahead market price
The average price of electricity in the day-ahead market OMIE in Spain in the third quarter of 2017 was 48.41 €/MWh, 6.67 €/MWh higher than the same quarter of 2016. The lowest hourly price of the quarter, 28.00 €/MWh, occurred on August 6th between 7 a.m. and 8 a.m. On the other hand, the highest hourly price was 59.69 €/MWh and was registered on September 27th between 21 p.m. and 22 p.m.
So far this year, the average monthly price of every month in 2017 was higher than the same month of the previous year. The largest year-on-year differences occurred in January, 34.96 €/MWh more than in January 2016, due to larger exports to France to cover the shutdown of many of their nuclear power plants that provide most of the electricity of the country.
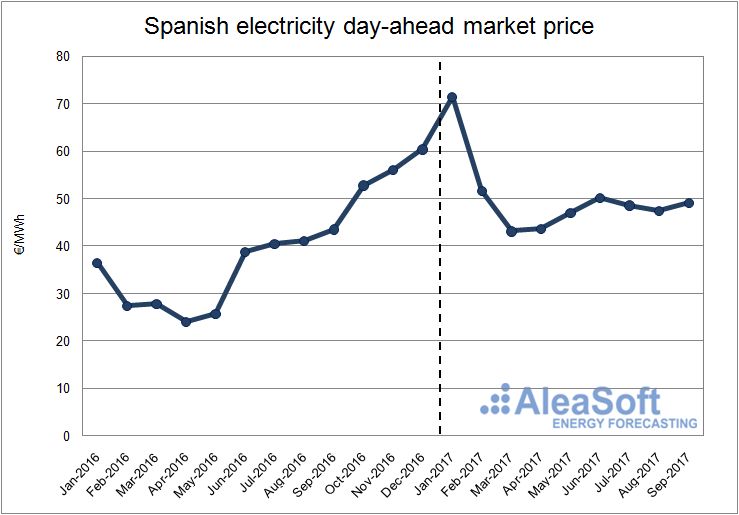
Evolution of Price of the Spanish electricity day-ahead Market.
Data sources: OMIE.
In the graph showing the distribution of Spanish electricity market price for each month of the third quarter of 2017, one can clearly see that the prices are shifted towards higher values than in 2016.
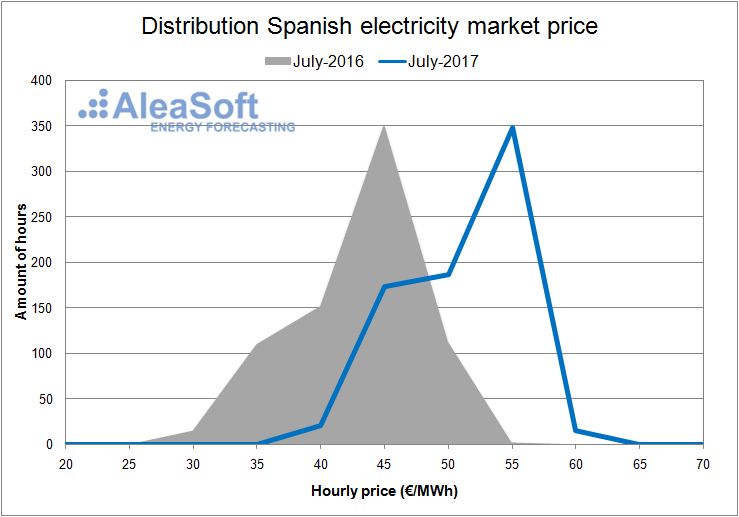

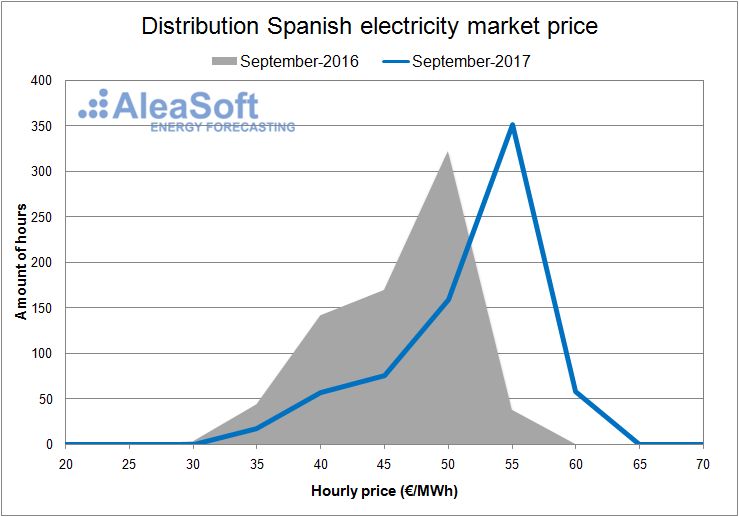
Distribution of the hourly price of the Spanish day-ahead market.
Data sources: OMIE.
In the third quarter of 2017, the coupling with the Portuguese market occurred in 98% of the hours, while the coupling with the French market only occurred in 3% of the hours.
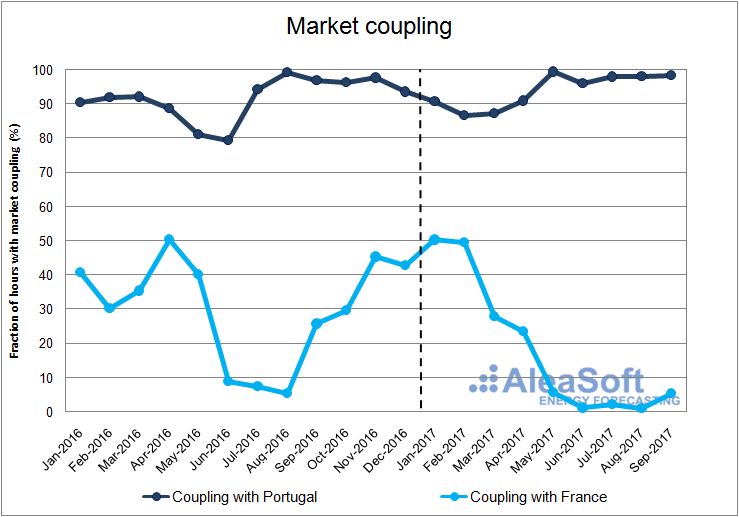
Evolution of the monthly fraction of hours with market copuling with Portudal and with France.
Data sources: Prepared by AleaSoft from data published by OMIE.