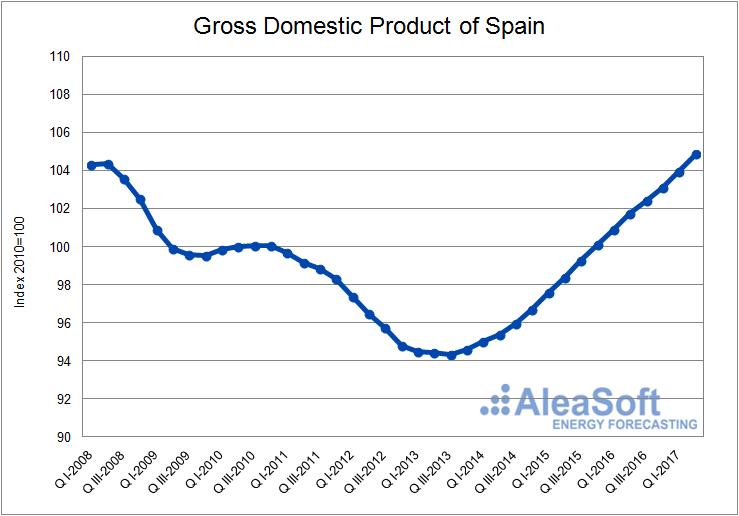
August 16th, 2017-In the first half of year 2017, the Spanish Gross Domestic Product (GDP) has reached the level obtained by this index in the first half of year 2008. According to the data published by the National Institute of Statistics of Spain (INE, for its acronym in Spanish) in the Flash Estimate of the quarterly GDP for the second quarter of the current year, in the first half of 2017 the GDP has grown by 0.1% over the first half of 2008.
![]()
Gross Domestic Product of Spain. Index 2010=100.
Chain linked volumes. Seasonal and calendar effect adjusted data.
Data source: INE (National Institute of Statistics of Spain).
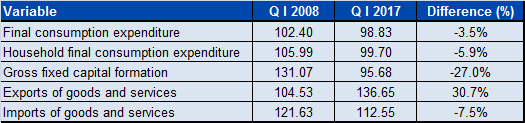
An analysis of the GDP components shows that there has been an increase of 30.7% in the exports component in the first quarter of this year compared to the same period of year 2008. However, other components have dropped in the first quarter of 2017 with respect to the first quarter of 2008, such as the household final consumption expenditure (‑5.9%), the gross fixed capital formation (‑27.0%) and the imports (-7.5%). These data can be influenced by an inertial effect, because year 2008 comes from an expansion cycle while year 2017 comes from a crisis cycle.
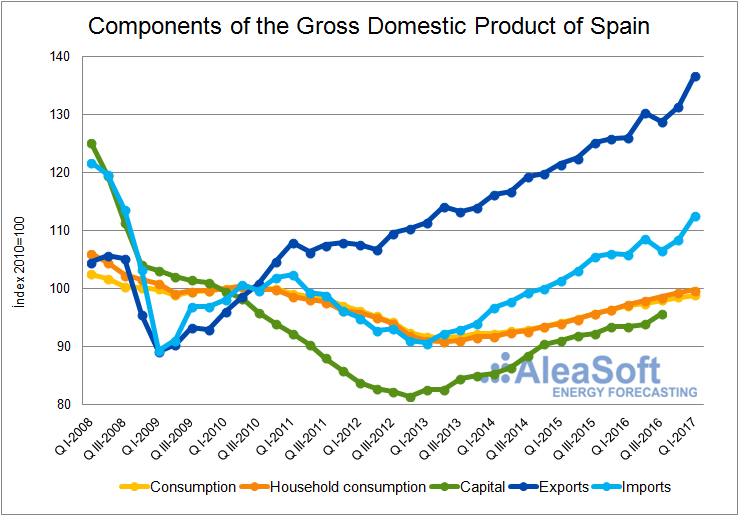
Components of the Gross Domestic Product of Spain. Index 2010=100.
Chain linked volumes. Seasonal and calendar effect adjusted data.
Data source: INE (National Institute of Statistics of Spain).
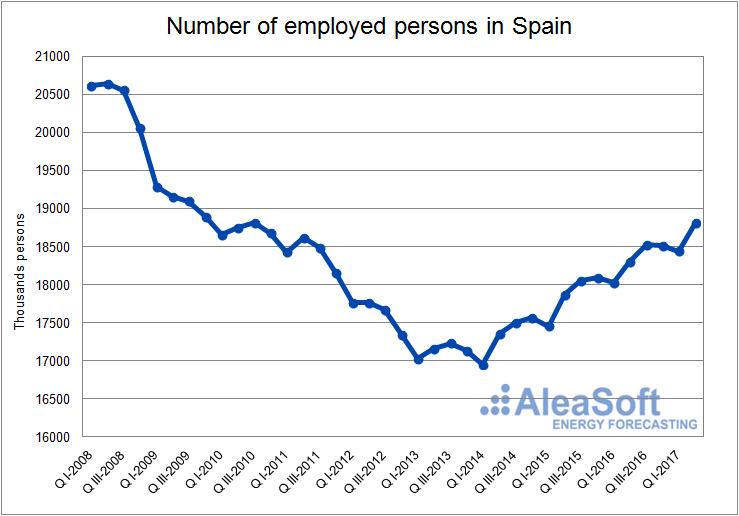
According to the data published by the INE in the Economically Active Population Survey of the second quarter of 2017, the number of employed persons has decreased 8.9% in the first half of 2017 compared to the same period of year 2008; this is equivalent to 1.8 million fewer employees.
![]()
Employed persons. Absolute values. Thousands persons.
Economically Active Population Survey of the second quarter of 2017.
Data source: INE (National Institute of Statistics of Spain).
The electricity and gas demands have decreased -5.3% and -27.0% respectively in the first half of 2017 if they are compared to the same period of year 2008. The decline in the gas demand is determined by the decrease in the gas consumption for power generation, which has been 70.7% lower in the first half of year 2017 compared to the same period of year 2008. The conventional gas demand, which includes the domestic, commercial and industrial sector, has been 2.1% greater in the first six months of this year when compared to the same period of 2008, mainly due to an increase in the consumption of 5.6% in the first quarter of this year compared to the same quarter of 2008, coinciding with a decrease of the temperature of 0.4°C.
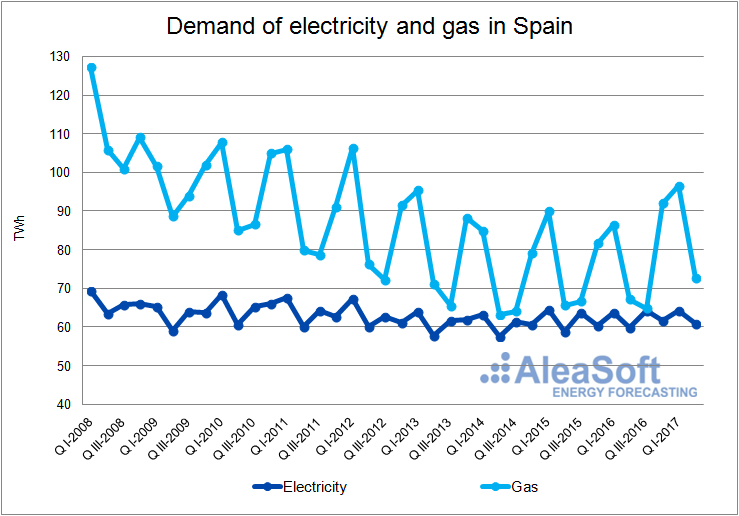
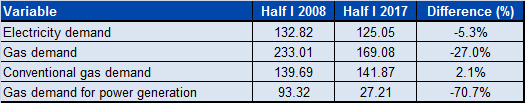
Demand of electricity and gas in Spain. Total values in TWh.
Data sources: REE and Enagás.
In the first half of 2017 the renewable technologies have increased their production, compared to the same period of 2008, to the detriment of the energy produced with some conventional technologies. The installed power capacity of the wind power, solar photovoltaic and solar thermal technologies have grown 6849 MW, 1225 MW and 2239 MW respectively in year 2017 with respect to the installed power capacity in 2008. In the case of the solar thermal power, in the year 2008 there were installed only 61 MW. In this context, production with more expensive technologies such as combined cycles and coal power has decreased by 72.6% and 2.3% respectively, when comparing the data for the first half of the years 2008 and 2017.
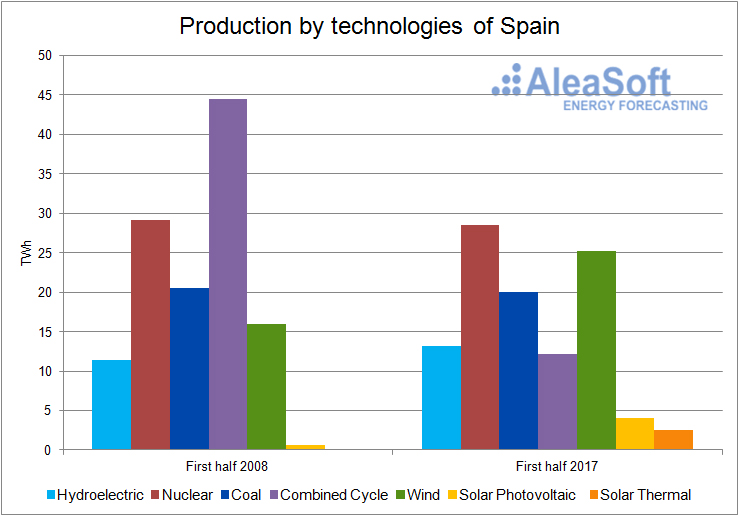
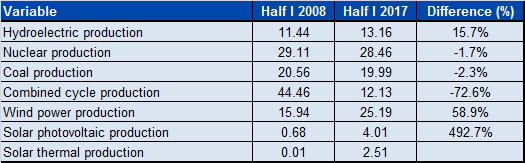
Electricity production by technologies in peninsular Spain. Total values in TWh.
Data source: REE.
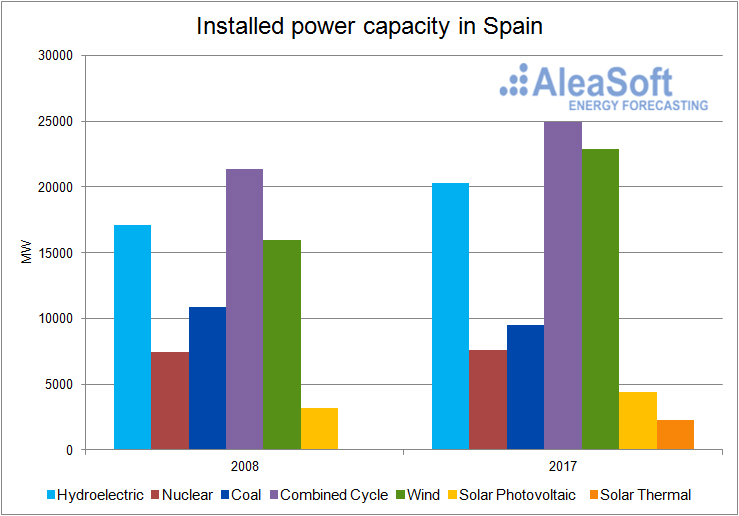
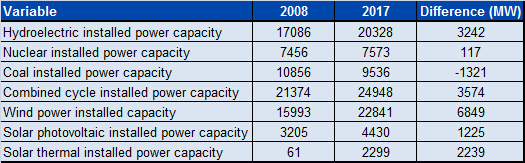
Installed power capacity in peninsular Spain. MW.
Data source: REE.
The average price of the main fuels used for electricity generation has decreased considerably in the first half of year 2017 with respect to the values quoted in the first half of 2008: ‑52.7% the Brent oil, ‑48.8% the European coal CIF ARA, ‑31.6% the Zeebrugge gas and ‑23.7% the NBP gas.
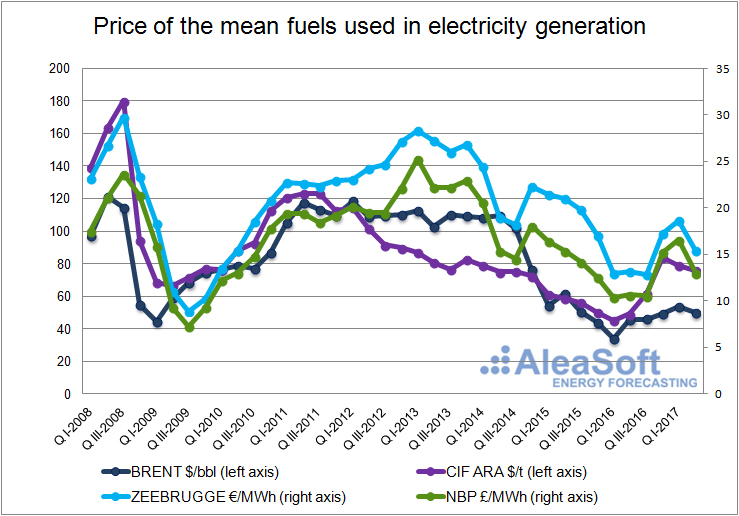
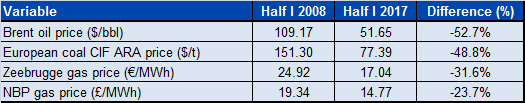
Average price of the mean fuels used in electricity generation.
Data sources: BRENT – EIA, CIF ARA – EEX, ZEEBRUGGE- NetConnect Germany, NBP – ICE ENDEX.
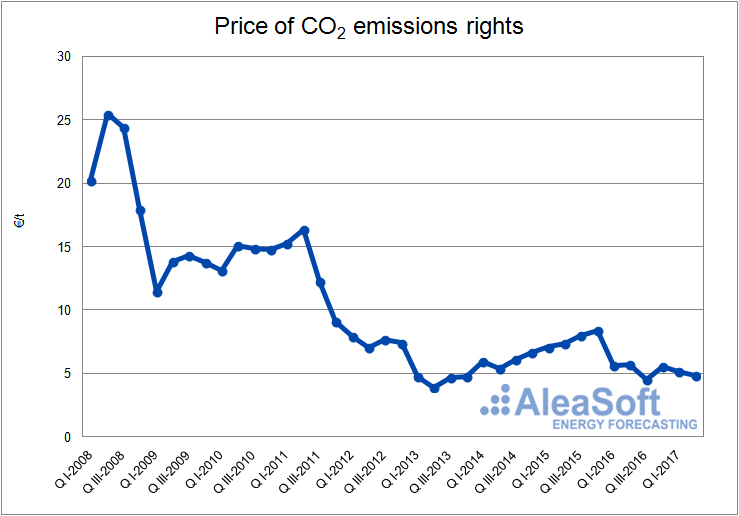
The average price of CO2 EUA emissions rights has also dropped considerably, from the 22.86 €/t in the first half of 2008 to the 4.98 €/t in the first half of 2017.
![]()
Price of CO2 emission rights.
Data source: EEX
The average price of the electricity day-ahead market OMIE in Spain in the first half of 2017 has been 51.28 €/MWh, 10.11 €/MWh lower than in the first half of 2008. The main reasons of this decrease have been the reduction in electricity demand, the increase in the production with cheaper technologies such as the wind power, the hydroelectric and the solar power, as well as the decrease of the price of the fuels used in electricity generation and the price of the CO2 emissions rights.

![]()
Spanish electricity day-ahead market price.
Data source: OMIE.
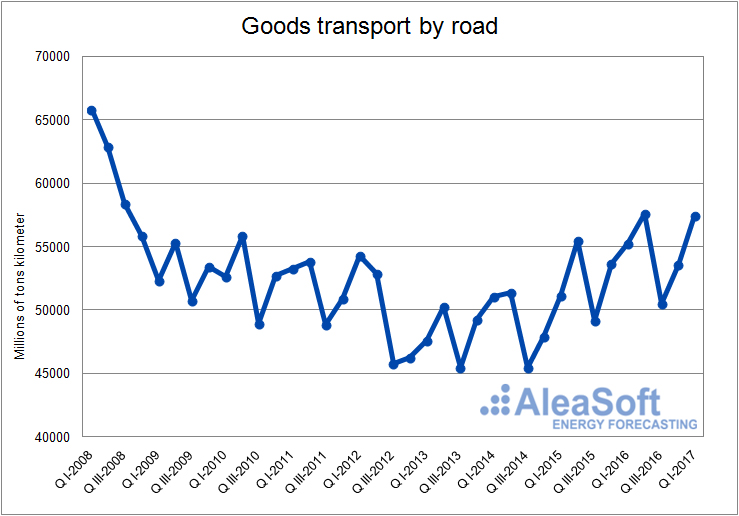
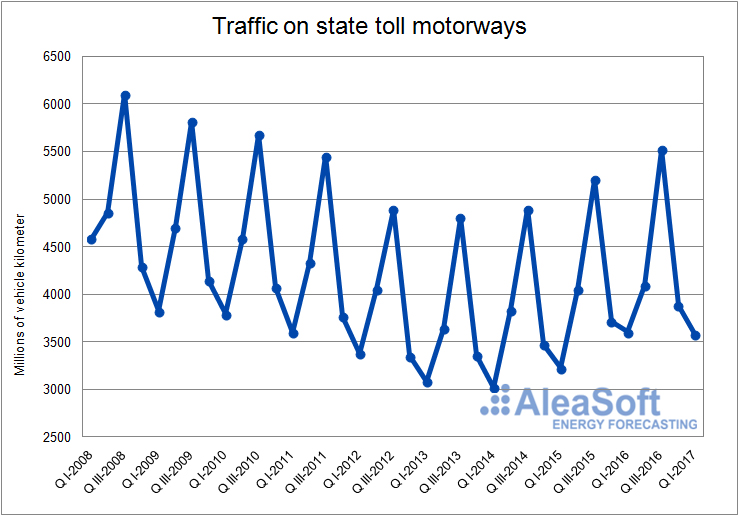
Other indicators of the evolution of the Spanish economy, such as cement consumption (‑76.7%), the tons of goods transported per kilometer on roads (‑11.8%) and the number of vehicles per kilometer on state toll motorways (‑21.0%) have decreased in the first quarter of 2017 compared to the same quarter of 2008.
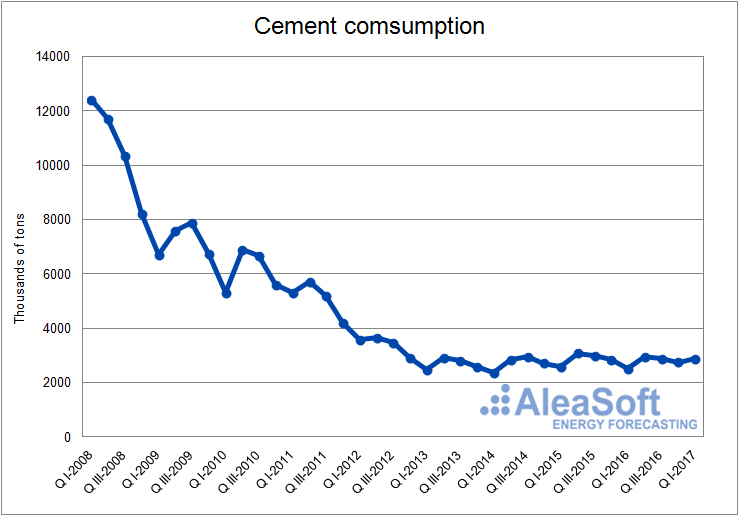
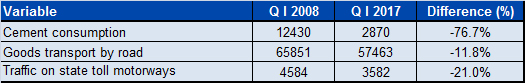
Apparent cement consumption in Spain. Thousands of tons.
Transport of goods by road in Spain. Millions of tons kilometer.
Traffic on state toll highways. Million of vehicle kilometer.
Data source: Ministry of Public Works of Spain.