Information elaborated by AleaSoft, a leading company in the development of price and consumption forecasting models of energy markets
April 13th, 2016 – In the first quarter of 2016 the daily market prices in Spain decreased compared to the same quarter for 2015. The main causes of this decline were a greater wind and hydroelectric production, as well as the decrease in electricity demand.
Evolution of the most important variables of the Spanish market in the first quarter of 2016
In the first quarter of 2016, electricity demand in Spain was 1.3% lower than the demand registered in the same quarter of the previous year. After factoring in the influence of seasonal and working patterns, the decline in demand was of 0.6% compared to the first three months of 2015. In January and February demand was lower than that of the same months of the previous year (-4.9% in January and -0.1% in February, -3.1% and -0.5% respectively without taking into account the influence of seasonal and working patterns), coinciding with the fact that at that time temperatures were higher than those registered in the same months of 2015. In March, however, electricity demand increased by 1.5% (2.1% after factoring in the influence of seasonal and working patterns).
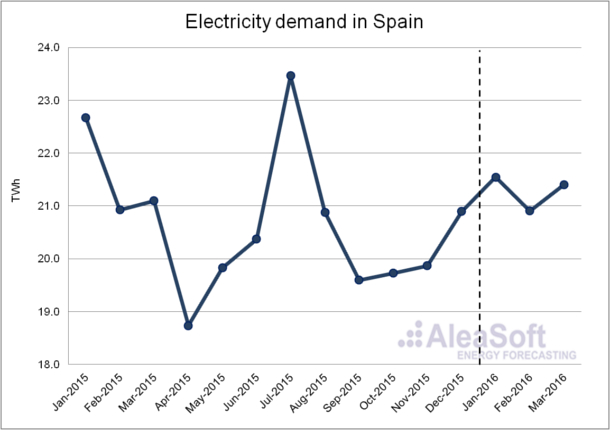
Evolution of electricity demand in Spain.
Data Source : REE.
Wind power production increased by 8.8% in the first quarter of 2016 in annual terms. The months with a faster growth were January, where wind production increased by 14.1% compared to the same month of the previous year, and March where it grew by 11.9%. The installed capacity of this technology did not change until February 2016 compared to that available in 2015.
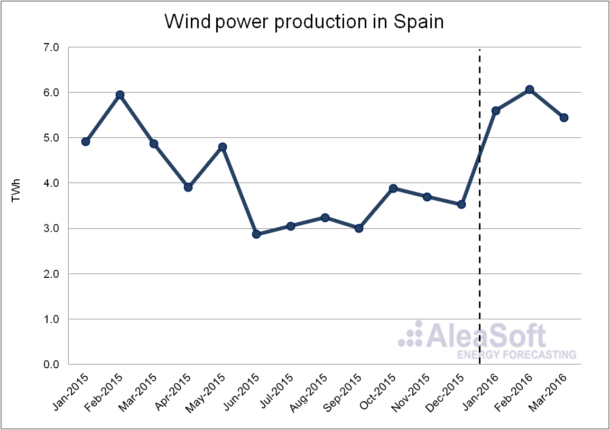
Evolution of wind production in Spain.
Data Source : REE.
Hydroelectric production also increased in the first quarter of 2016 when compared to the same quarter of the previous year, namely 23.0%. In the three months analyzed, hydroelectric production was higher than that of the same month of last year, although January stands out to be the month where the increase was of 39.6% compared to January 2015.
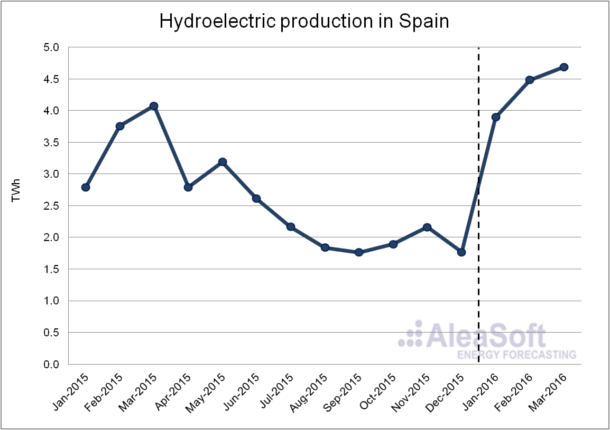
Evolution of hydroelectric production in Spain.
Data Source : REE.
Nuclear production decreased by 9.2% in the first quarter of 2016 when compared to the same quarter of 2015. The decrease was higher in January (-12.0%) and February (-15.8%), while in March this fall was lighter (-0.5%).
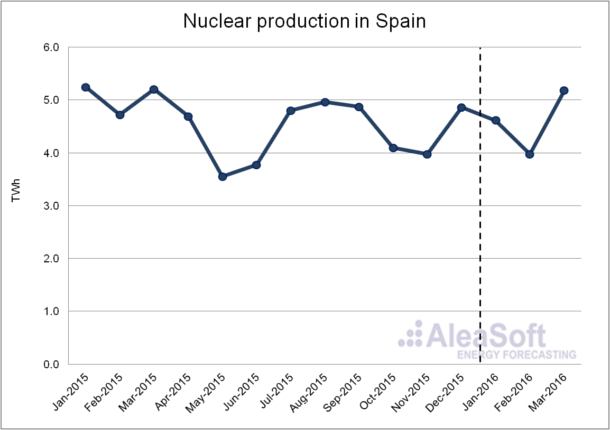
Evolution of nuclear production in Spain.
Data Source : REE.
Electricity production using coal suffered a significant drop in the recently completed quarter, in which production was of 42.4% less using this technology in interannual terms, coinciding with the surge in wind and hydroelectric production. The decrease in production was of 47.7% in January, 38.6% in February and 36.8% in March, per month.
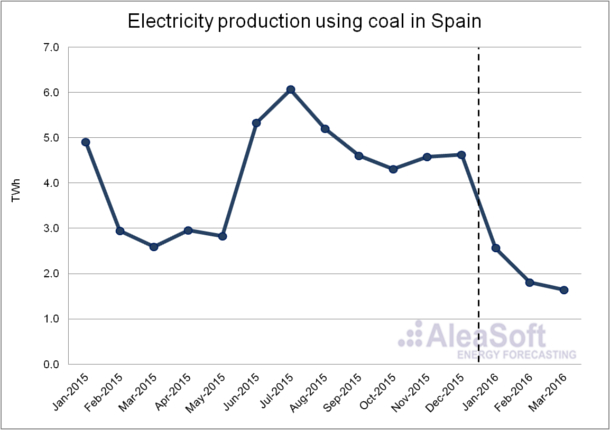
Evolution of electricity production using coal in Spain.
Data Source : REE.
In the case of combined cycle production, a decrease in production was also noted in the first quarter of 2016, compared to what was produced in the same period of the previous year. In the first quarter, the interannual decrease was of 20.2%, 18.2% in January, 23.2% in February and 19.7% in March.
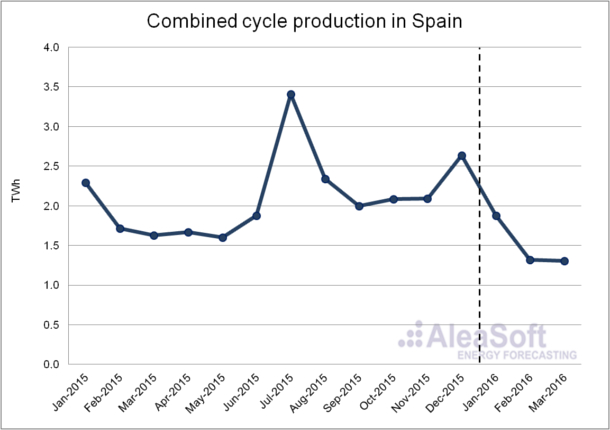
Evolution of combined cycle production in Spain.
Data Source : REE.
Solar photovoltaic production was 11.5% lower in the recently concluded quarter, when compared to the same quarter of the previous year. There were falls during all three months however January stands out, being the month where the decrease was of 32.0%. According to data published by REE, the installed capacity of this technology did not change until February of the current year compared to 2015.
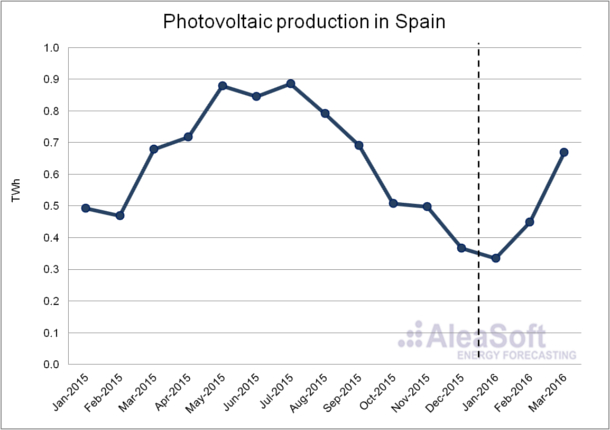
Evolution of solar photovoltaic production in Spain.
Data Source : REE.
Solar thermal production registered a fall of 24.5% in the recently completed quarter, if compared to the same quarter of the previous year. January was the month with the greatest decrease (-66.1%), followed by February (-30.3%); in March the decrease was milder (-4.1%). The installed capacity of this technology has not changed since 2013.
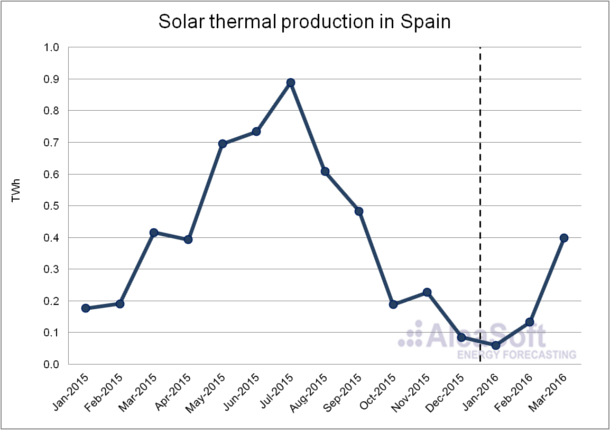
Evolution of solar thermal production in Spain.
Data Source : REE.
Production using other renewable technologies, including biogas, biomass, marine energy and geothermal, decreased by 11.0% in interannual terms during the first quarter of this year. If the information published by REE is considered, at the end of February 2015 the installed capacity of these technologies was the same as in 2015.
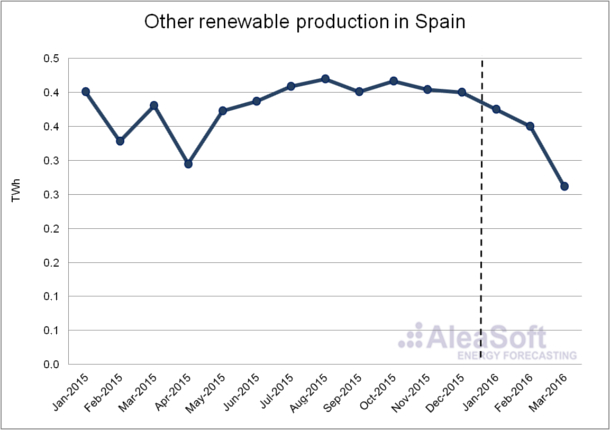
Evolution of production using other renewable technologies in Spain.
Data Source : REE.
In the case of cogeneration production, there was zero growth in the first quarter of 2016 when compared to the same period of 2015. The drop of 2.2% registered in January was offset by a growth of 1.1% in February and 1.1% in March. The installed capacity of this technology slightly increased compared to 2015, from 6668 MW installed in 2015 to 6673 MW in February 2016.
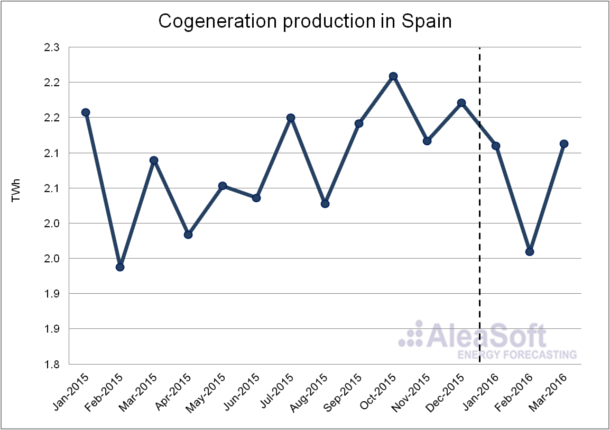
Evolution of cogeneration in Spain.
Data Source : REE.
Finally, waste production experienced an increase of 33.3% in interannual terms in the first quarter of 2016. While in the first three months of the year production was higher than in the same month of last year, the most significant growth was registered in March (90.1%). According to REE, until February 2016 the installed capacity of this technology was equal to that which existed on December 31st, 2015.
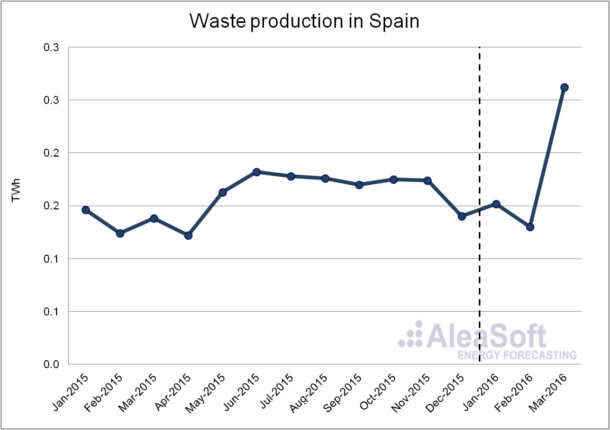
Evolution of waste production in Spain.
Data Source : REE.
Prices of fuels for electricity generation
In the first quarter of 2016 the average price of Zeebrugge gas was 12.95 €/MWh, 8.52 €/MWh lower than in the same quarter of 2015. During the first three months of the year the prices of this fuel continued the downward trend that it experienced in 2015.
The average price of Brent oil barrel was of $33.82 in the first quarter of 2016, $20.21 less than in the same period of 2015. In January an average price of 30.70$/bbl was registered, historical monthly minimum since July 2014, when the price of black gold began its decline. In February and March there was a slight change of trend and the average price was of 32.18$/bbl and 38.59$/bbl respectively.
The price of CIF ARA European coal decreased by 16.13$/t in interannual terms in the recently concluded quarter, settling at 44.84$/t and continuing the downward trend that was observed during 2015.
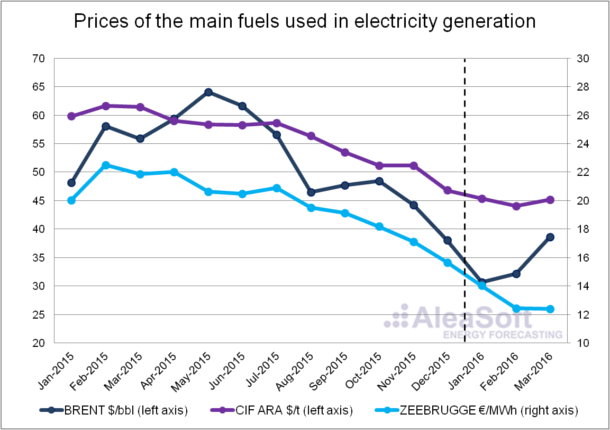
Evolution of the price of the main fuels used in electricity generation.
Data source: BRENT – EIA, CIF ARA – EEX, ZEEBRUGGE- NetConnect Germany.
Price of CO2 emission rights
In the first quarter of 2016 the price of CO2 emission rights was 5.63 €/t, 1.45 €/t lower than in the same period of 2015. The average price for each month of the quarter analyzed was less than the minimum monthly price of 2015, which settled at 6.84 €/t.
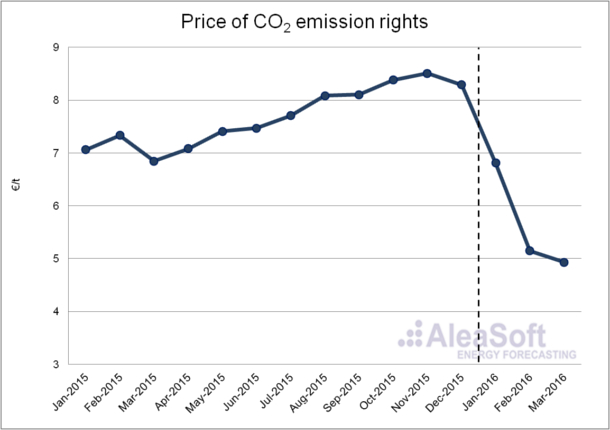
Evolution of the price of CO2 emission rights.
Data source: EEX.
Interconnection Spain-Portugal
In the first quarter of 2016 the monthly net balance of the electricity exchanges between Spain and Portugal established Spain as a net importer, with 2263 GWh imported. However, during the first quarter of 2015, and in general during the whole year, Spain exported more electricity than it imported.
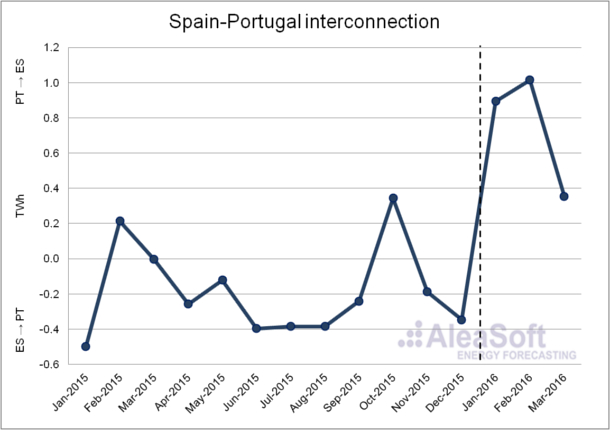
Evolution of the monthly net balance of the interconnection between Spain and Portugal. Positive values indicate that Spain imports electricity from Portugal, while negative values indicate that Spain exports electricity to Portugal.
Data sources: ENTSO-E and REE.
Spain-France Interconnection
In the first quarter of 2016 the monthly net balance of the electricity exchanges between Spain and France established Spain as a net importer, as well as in the first quarter of 2015 and during the whole year of 2015. Spain imported 1048 GWh from France in the recently concluded quarter.
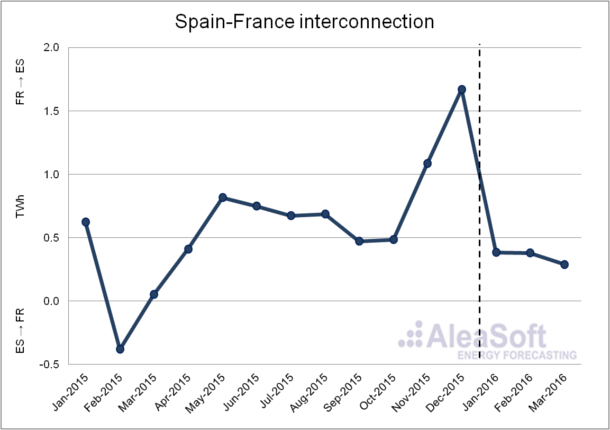
Evolution of the monthly net balance of the interconnection between Spain and France. Positive values indicate that Spain imports electricity from France, while negative values indicate that Spain exports electricity to France.
Data sources: ENTSO-E and REE.
Price of the Spanish day-ahead Market
In the first quarter of 2016, the price of the MIBEL electricity day-ahead Market in Spain was of 30.68 €/ MWh, 15.19€/MWh lower than in the same quarter of the previous year. The inter-annual decline was widespread in the first three months of the year: in January and February price decreased by 15.07€/MWh (each month) and in March 15.33 €/MWh. The increase in hydroelectric and wind production throughout the quarter, as well as a decrease in demand in January and February were the main causes of this decline. The minimum hourly price of the first quarter of 2016 was of 2.30 €/MWh, while throughout 2015 the minimum price was 4.00 €/MWh. The maximum hourly price for the first quarter of this year was 66.71 €/MWh.
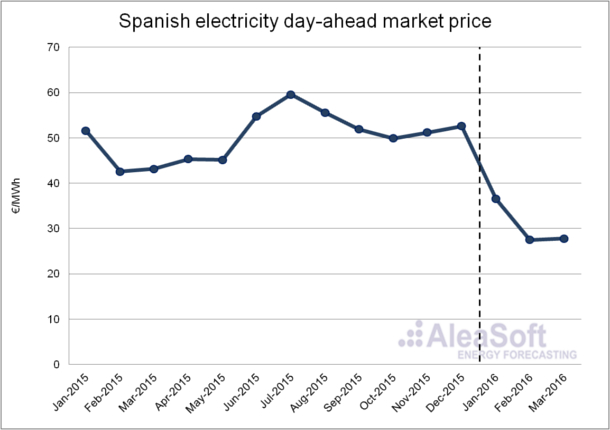
Evolution of Price of the Spanish electricity day-ahead Market.
Data sources: OMIE.
In the graphs the distributions of the hourly price for each month clearly show that prices in 2016 have shifted towards lower values.
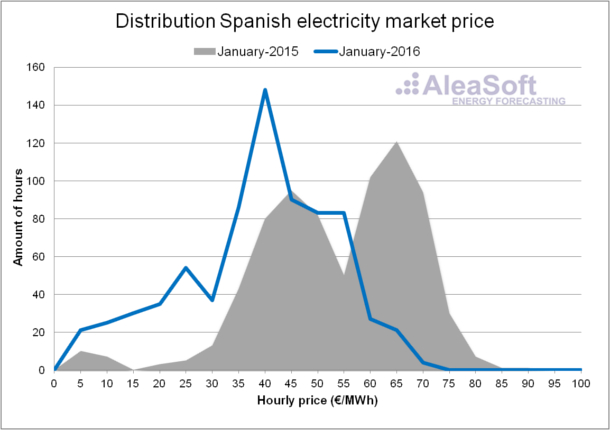
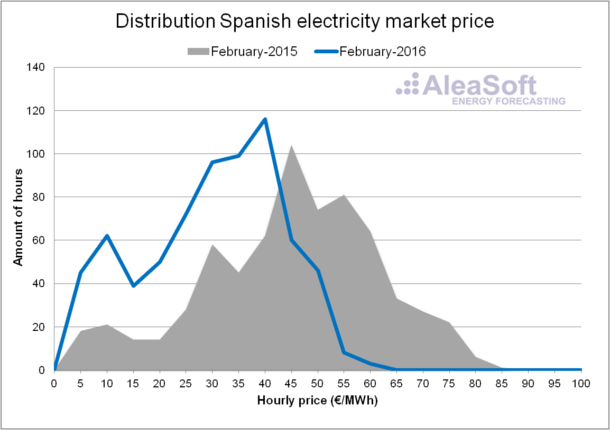
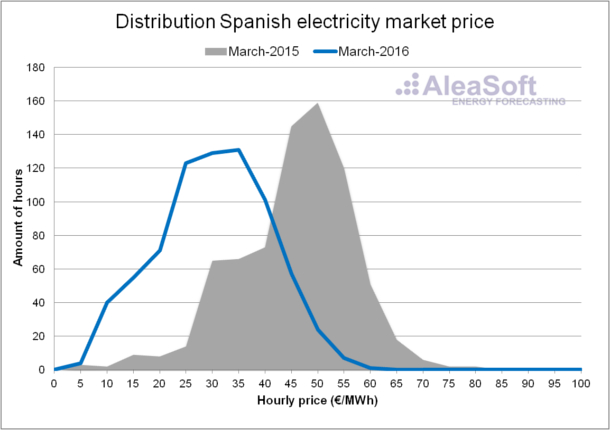
Distribution of the hourly price of the Spanish day-ahead market.
Data source: OMIE.