AleaSoft, August 3, 2020. The European electricity markets prices continue to rise in July after the collapse, during the most critical phase of the COVID-19 pandemic. A special case is that of the Nord Pool market in the Nordic countries, that set an average price this July of just €2.35/MWh, the lowest in the last decade. Renewable photovoltaic and wind production continues to increase and also its share of demand coverage thanks to the increase in installed capacity on the continent.
Solar photovoltaic, solar thermal and wind energy production.
The renewable energies maintained their advance within the energy mix of Europe in July. In year‑on‑year terms, wind and solar energies combined increased their prominence in all the analysed markets, with the contribution of 34% in Germany being the most notable. Another outstanding value was the 31% that these technologies covered in Spain. In all markets, renewable energies covered a higher percentage of demand than during July 2019, especially in Germany, which recorded a contribution of 35%. In both analyses, the Spanish market was the one that marked the greatest advance with respect to the percentages registered in July 2019 and June 2020.
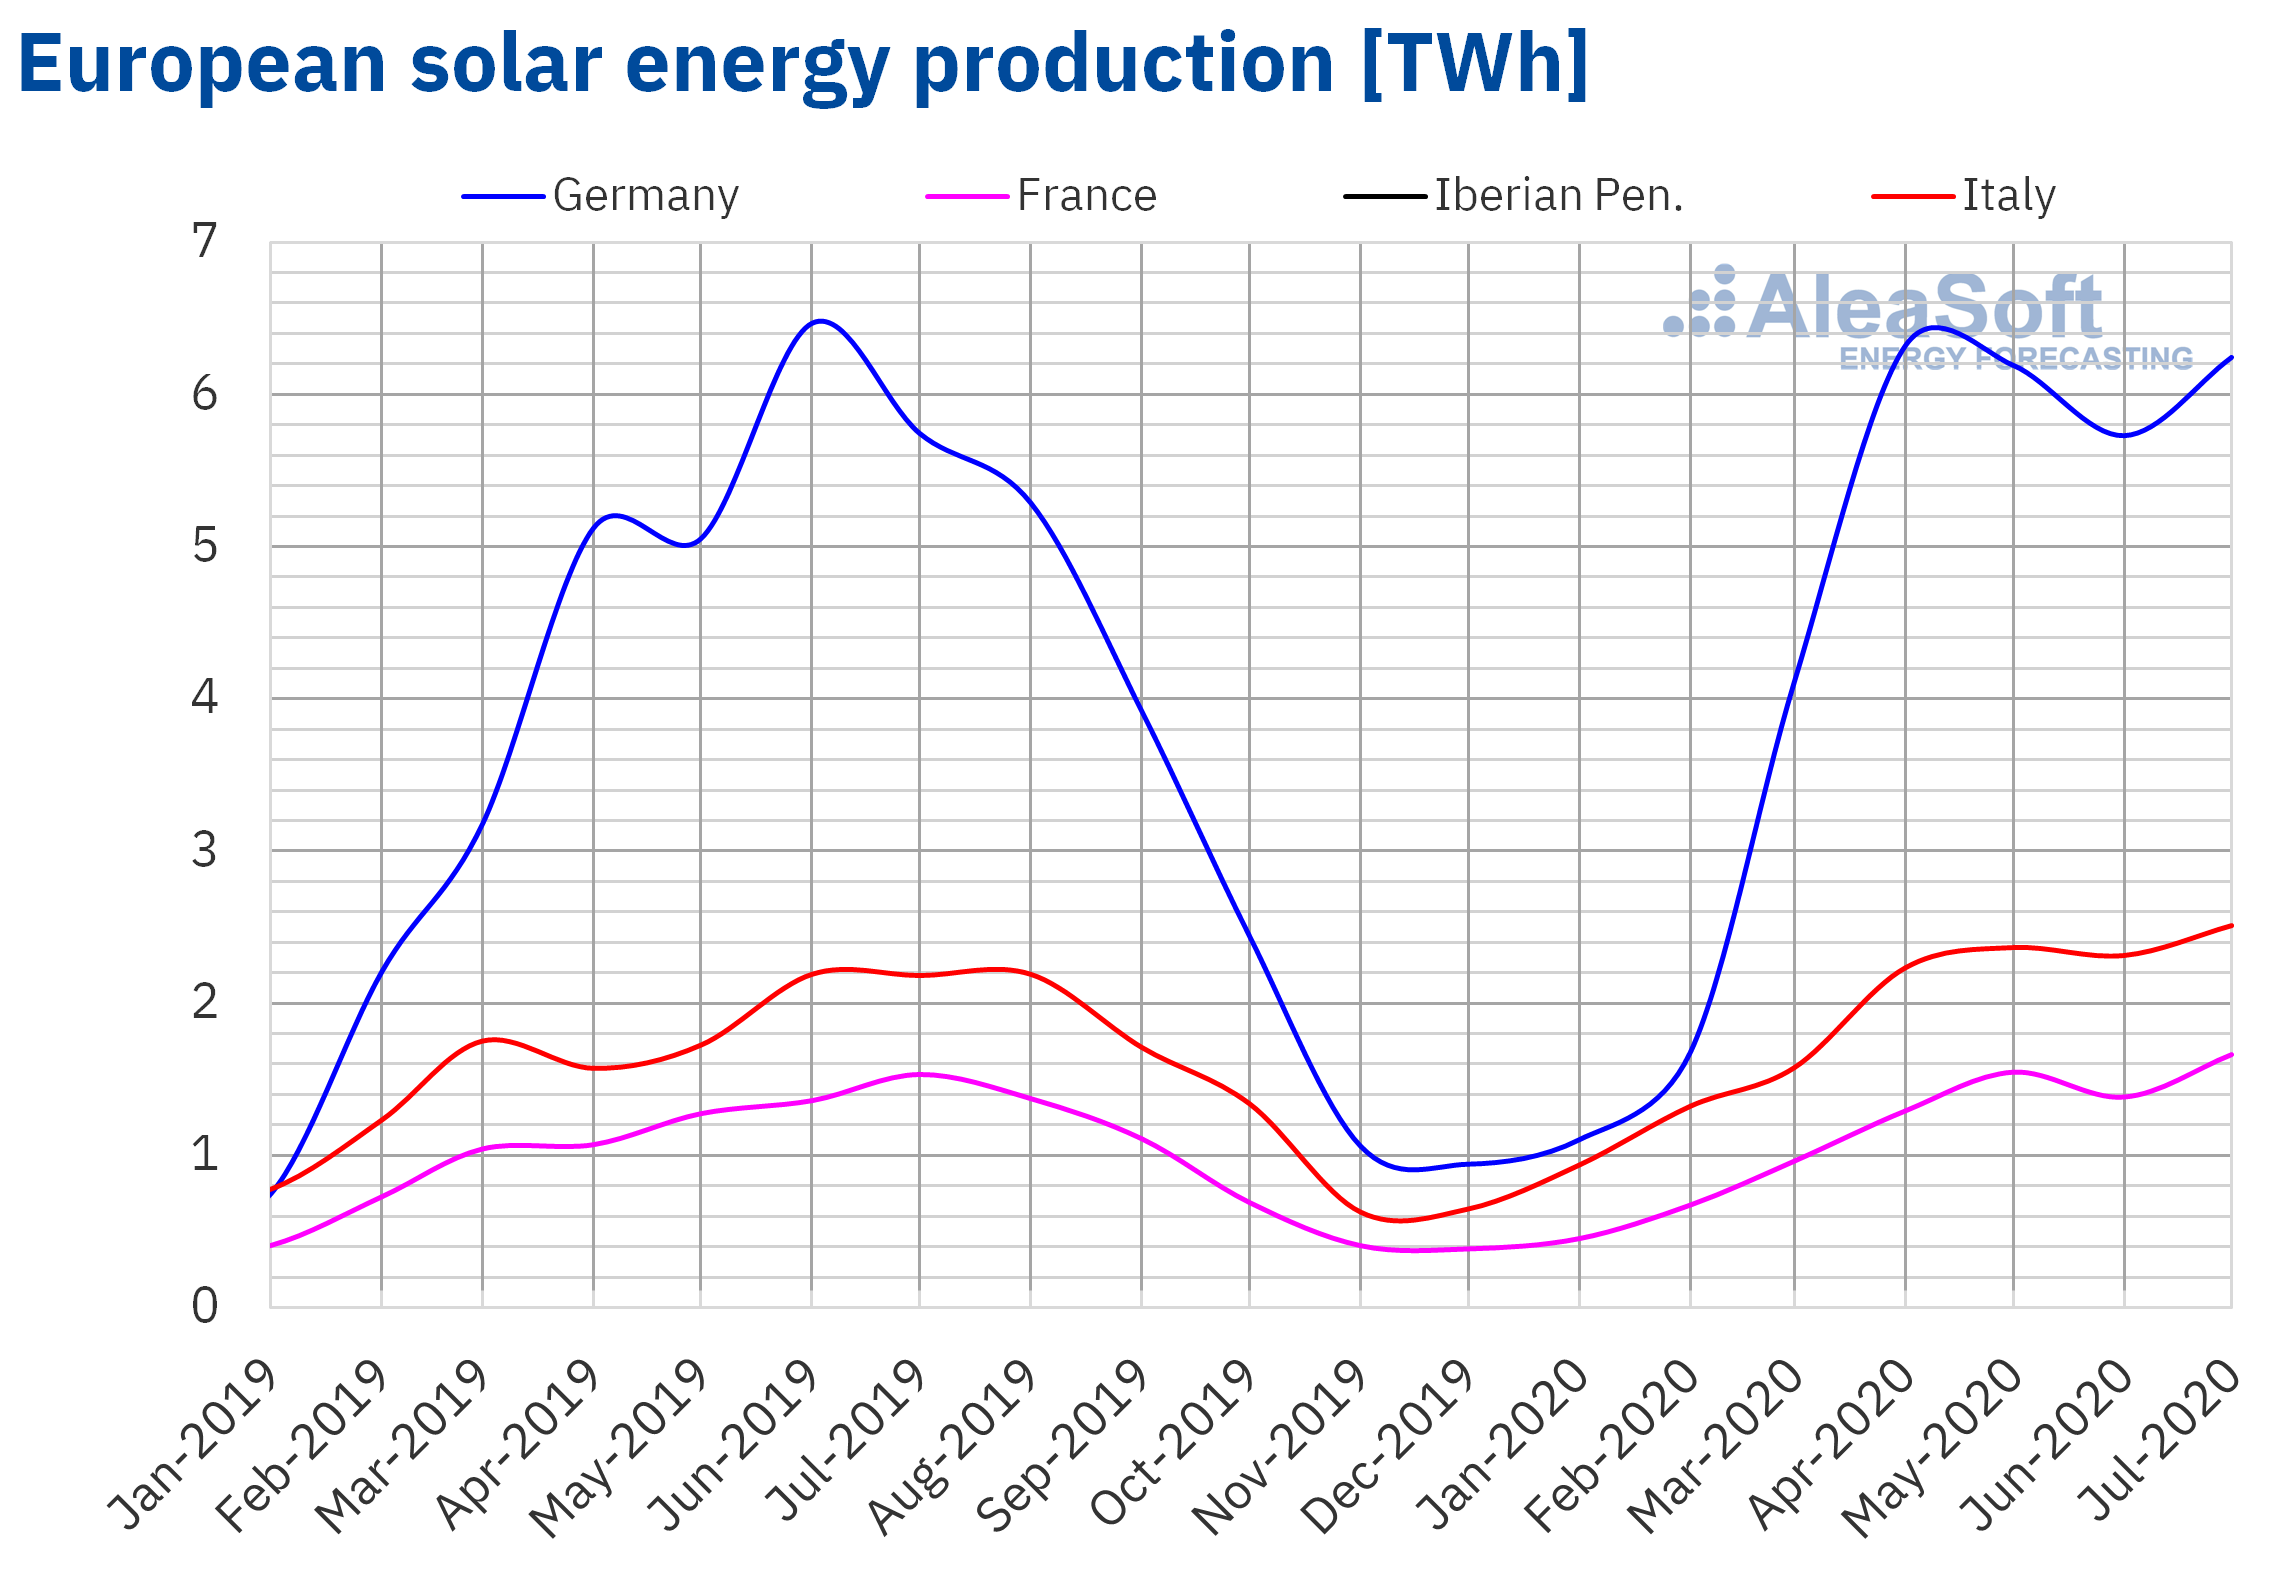
The solar energy production in July 2020 continued an upward trend in year‑on‑year terms. In the German market it increased by 8.7%, where the highest daily values were recorded during the last days of the month. The Spanish market stood at the head of the monthly increases in Europe, as during the previous months, with an increase of 61%, registering the highest values in the first week of the month. In Portugal there was also a significant increase of 32%. On the other hand, in Italy and France there were increases of 15% and 8.5% respectively.
In the analysis of July compared to June 2020, the most significant figures were those registered in the French market, where the rise was 16%. In Portugal the increase was 10% and in the rest of the markets the increases were below 7%.
 Source: Prepared by AleaSoft using data from ENTSO-E, RTE, REN, REE and TERNA.
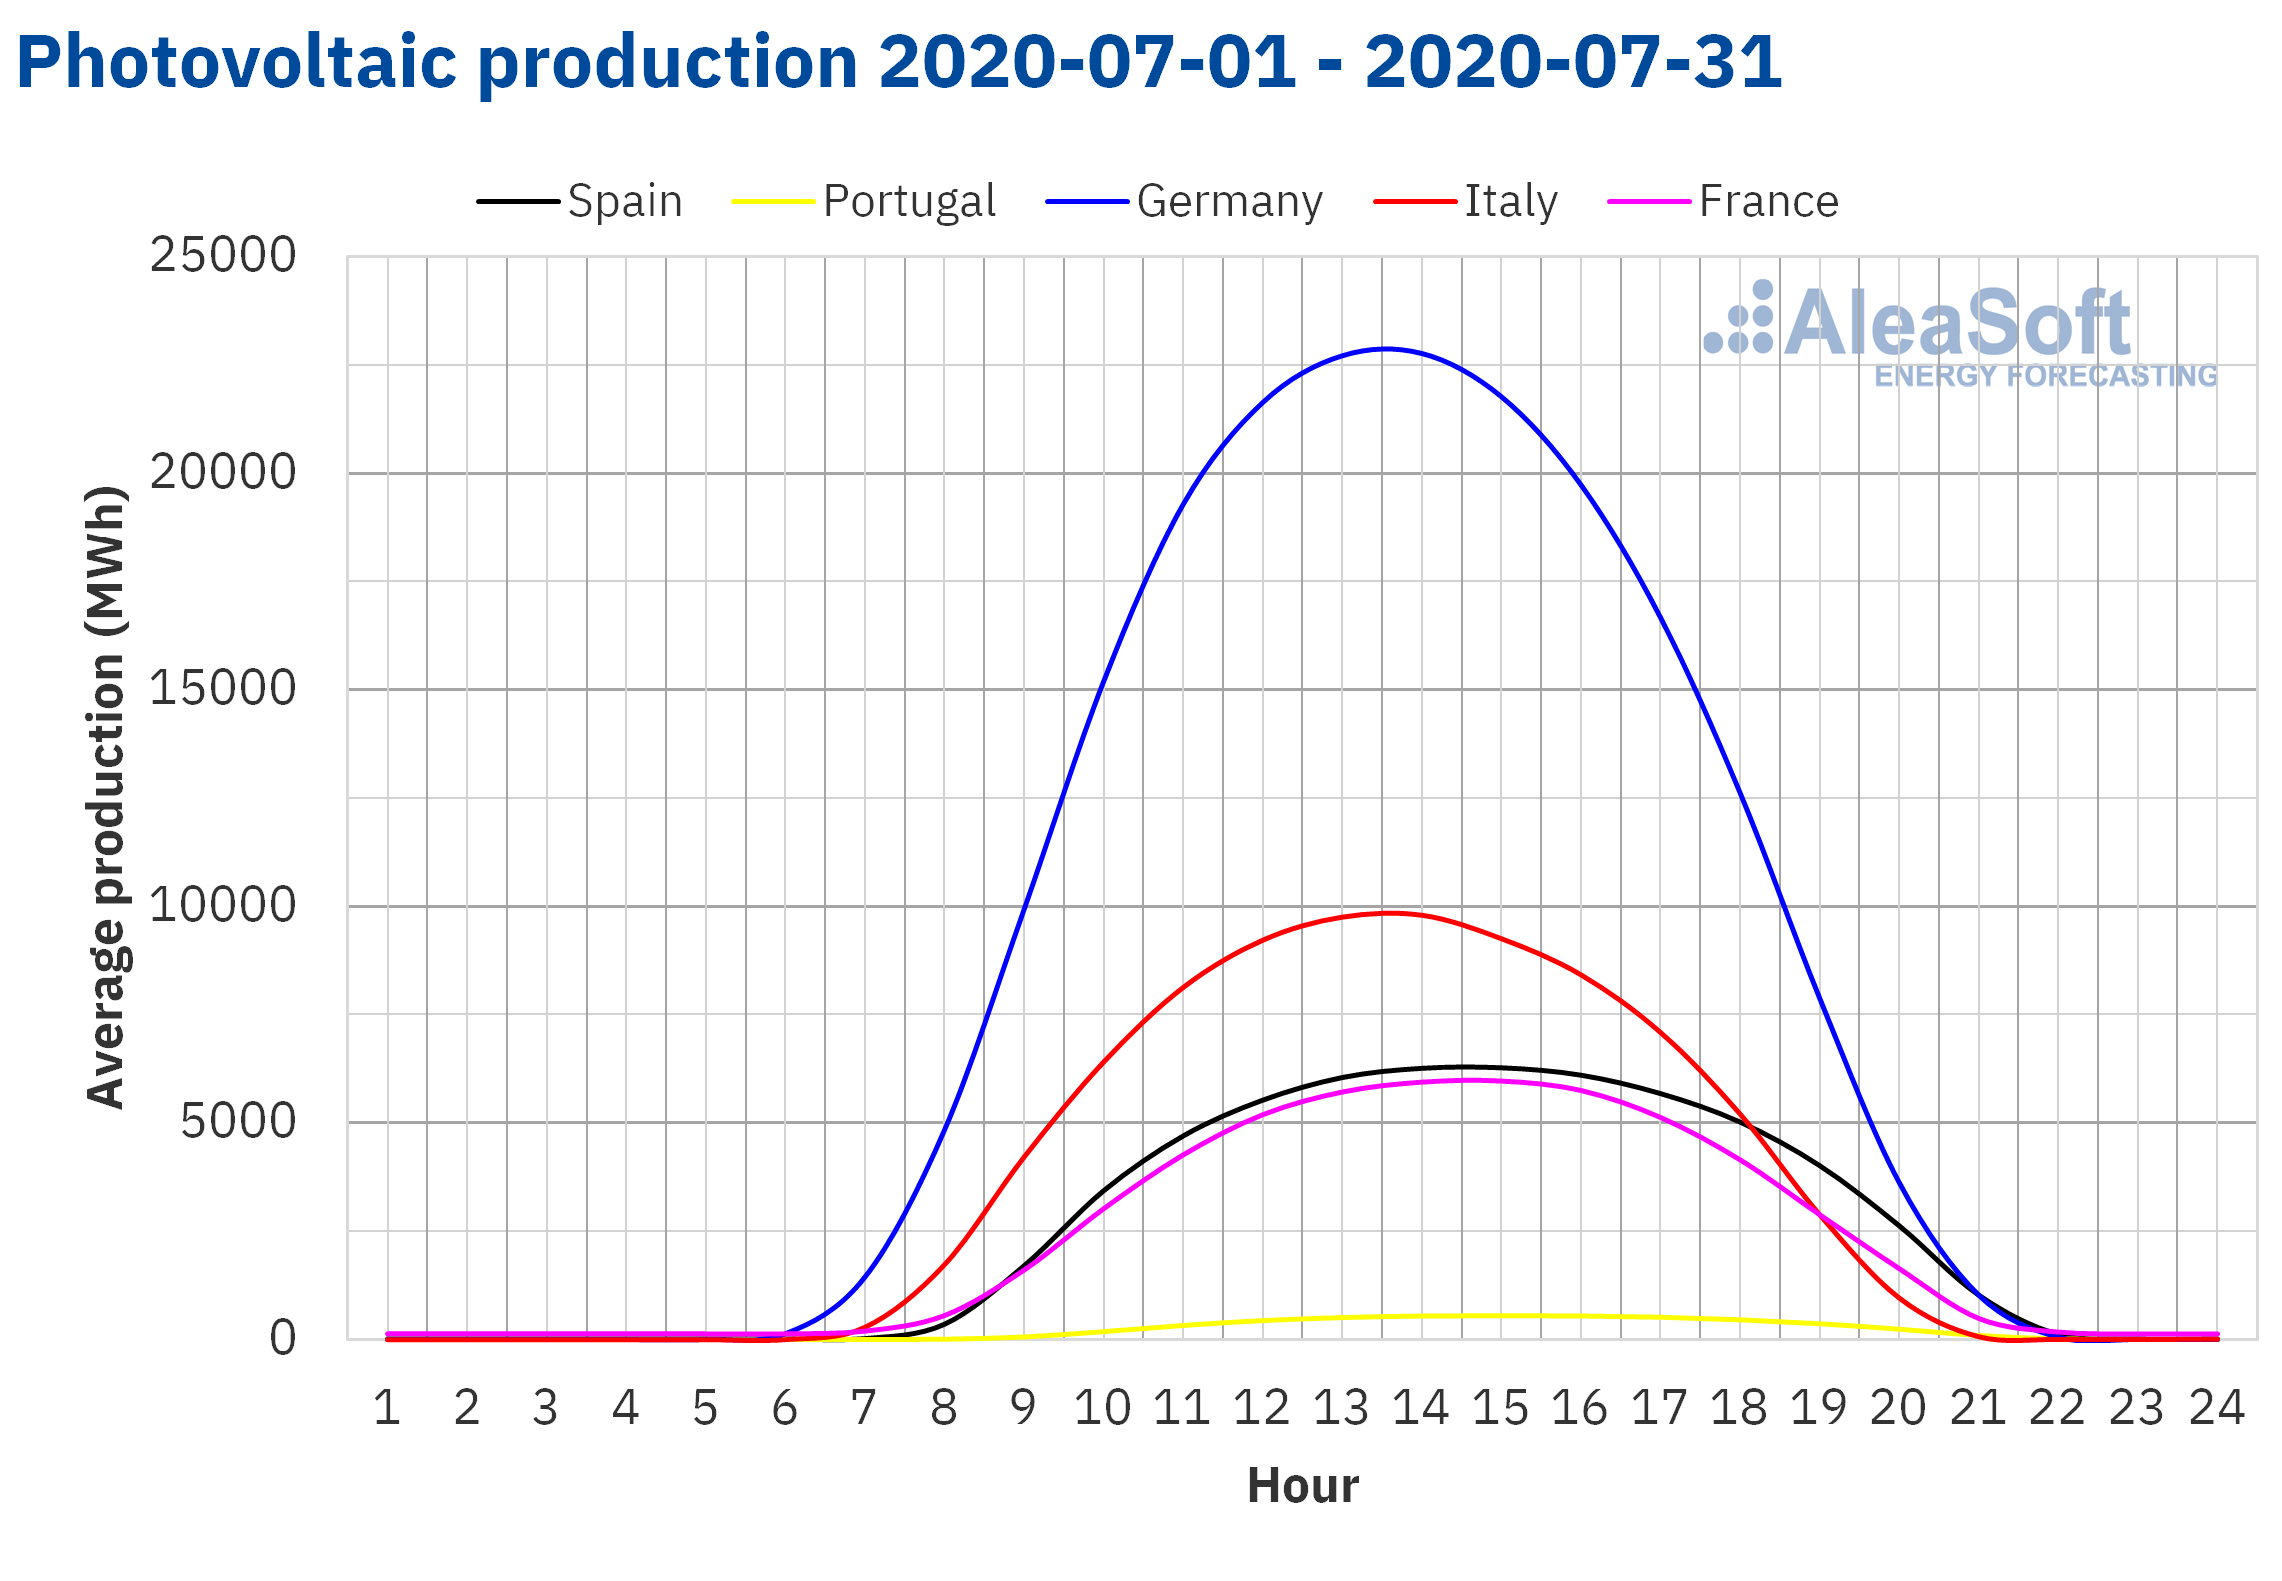 Source: Prepared by AleaSoft using data from ENTSO-E, RTE, REN, REE and TERNA.
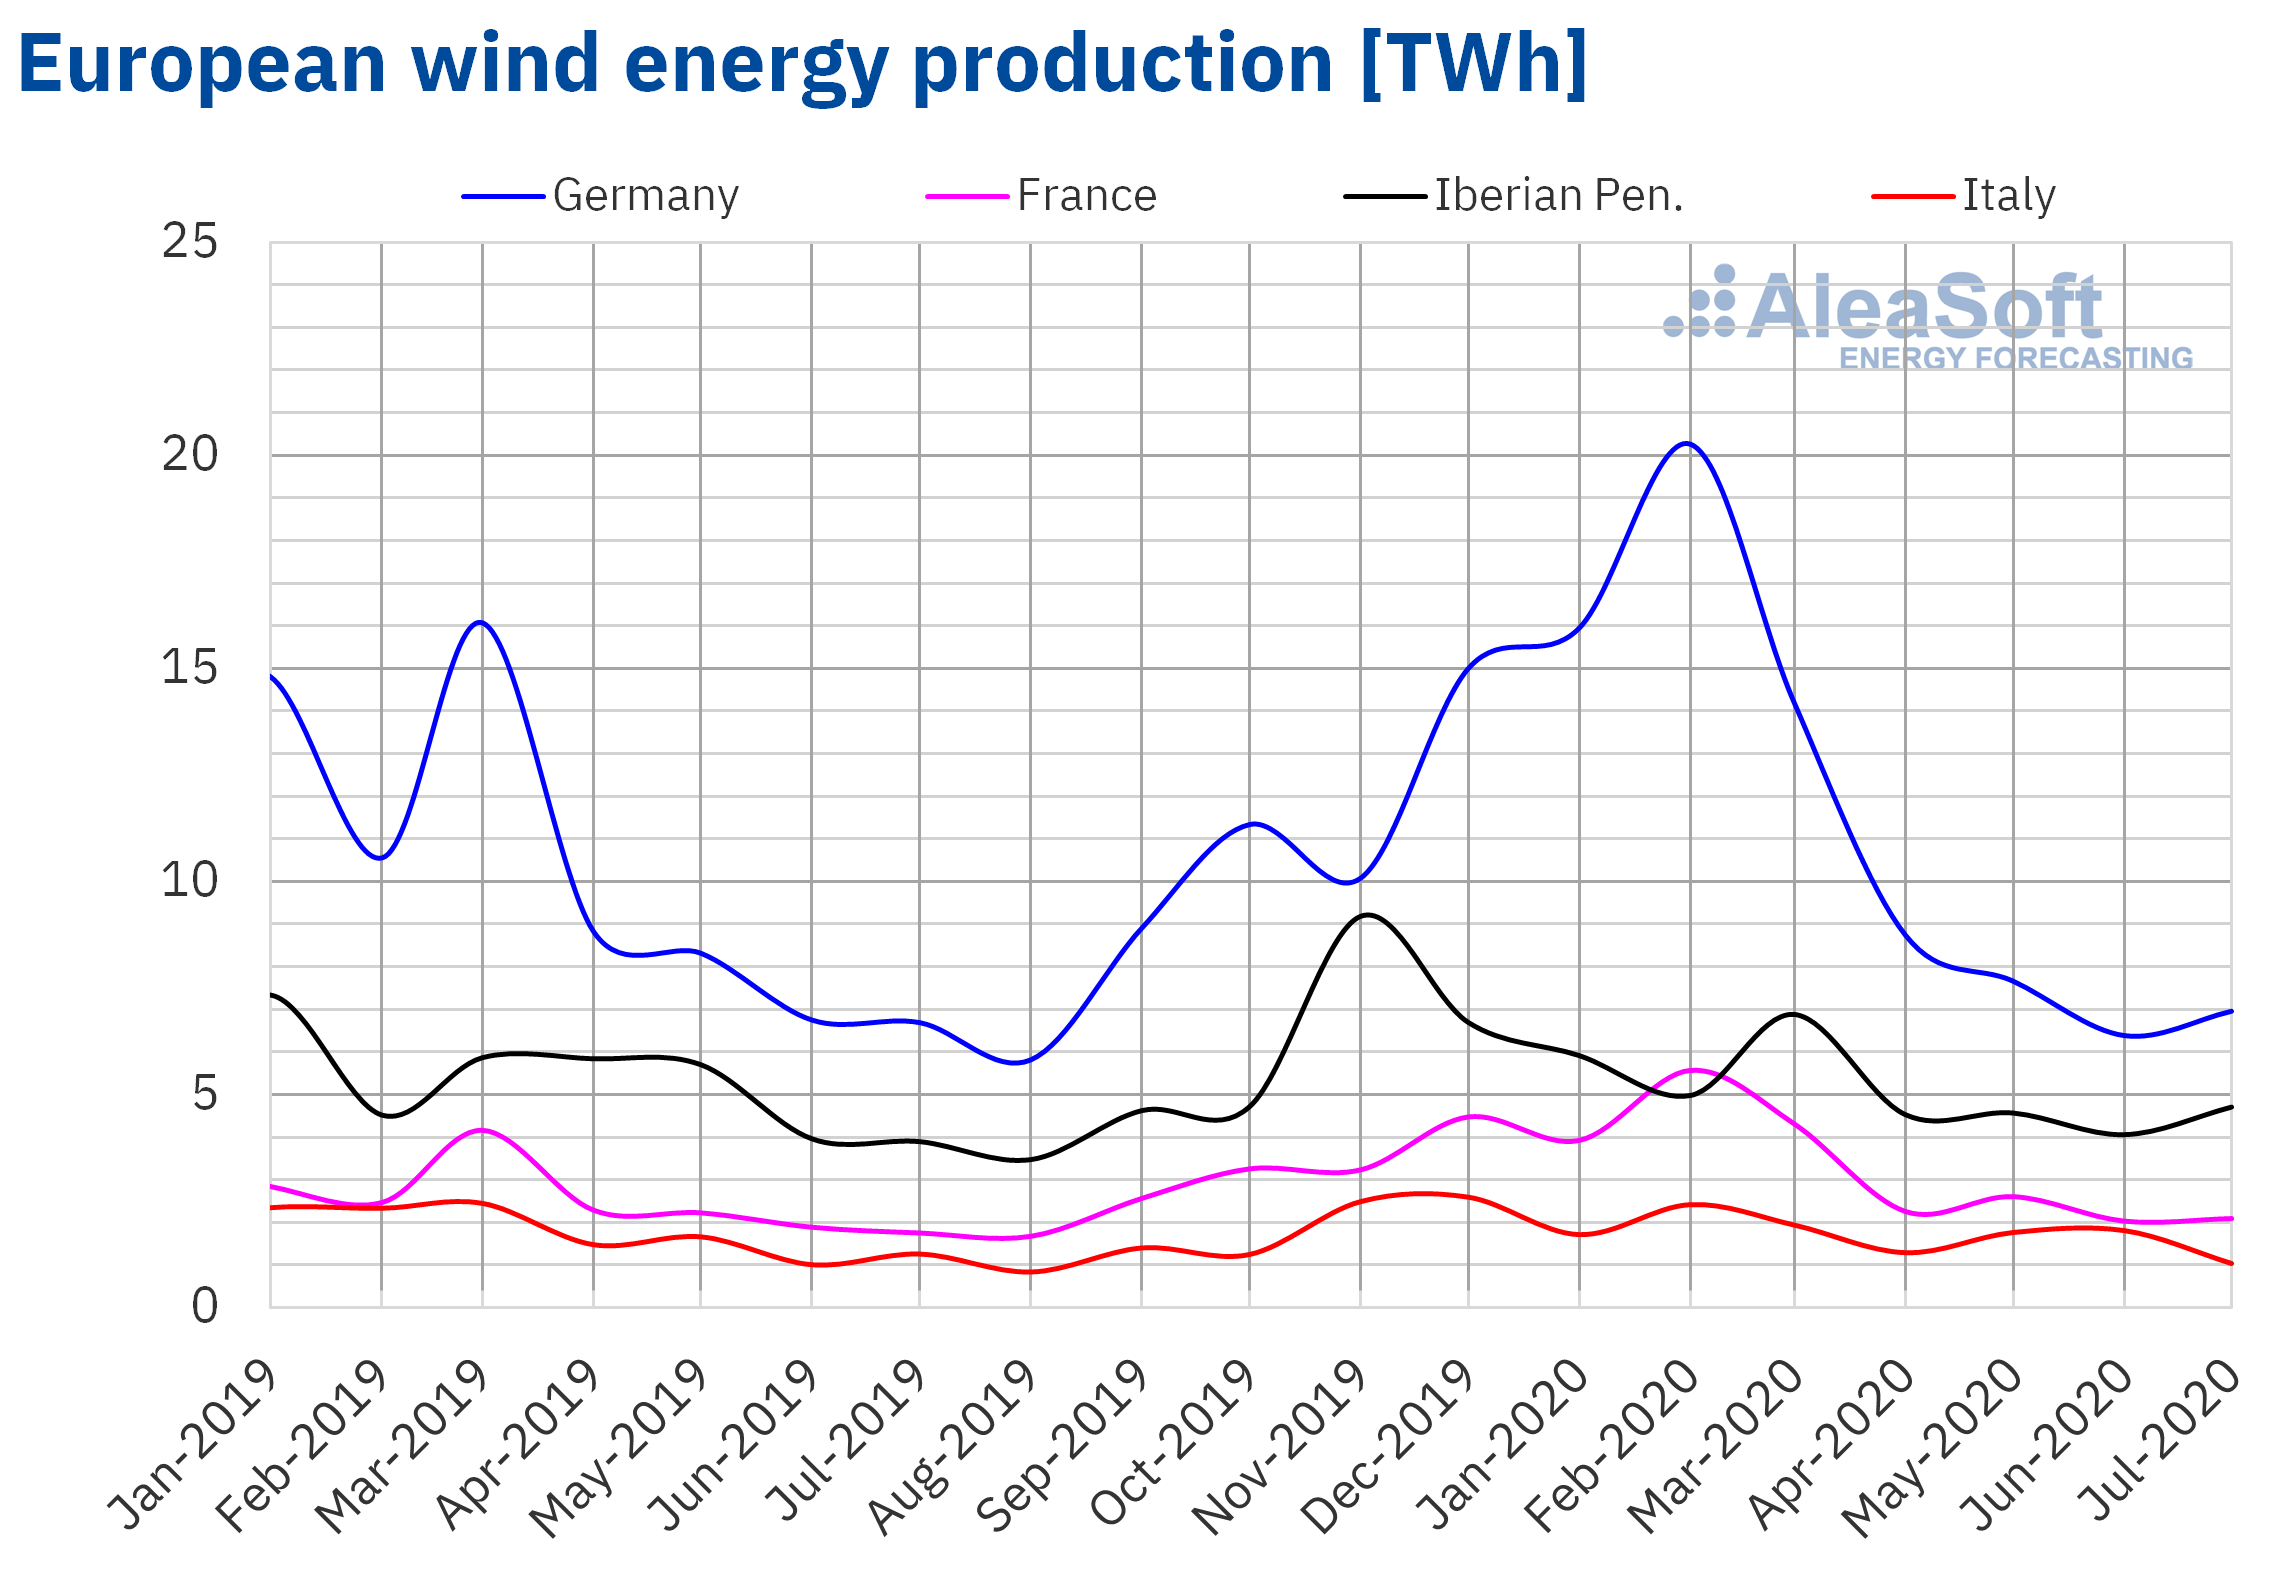
The wind energy production behaved heterogeneously throughout Europe during the just ended month of July, compared to July 2019. Notable differences were found in Spain, France and Italy, with values of 21%, 19% and 19% respectively. The wind energy curve in the German market started the month with quite high values but it declined after the first week until it showed recovery towards the last days of the month. This caused the year‑on‑year variation in this market to be only +4%. In Portugal the values were very similar to those of July 2019, registering a fall of 0.9%.
Compared to June 2020, the wind energy also behaved unevenly in the European electricity markets. In Spain and Germany there were increases of 19% and 5.4%. However, the Italian market suffered a 40% drop, while the drop was 14% in the Portuguese market. In France there was a slight variation compared to the previous month, of only +0.4%.
 Source: Prepared by AleaSoft using data from ENTSO-E, RTE, REN, REE and TERNA.
Renewable energy auctions
At the end of July, the German Federal Network Agency (Bundesnetzagentur) reported that in the renewable energy capacity auction held on July 1, bids were submitted for 779.4 MW of solar energy capacity, much more than the 192.2 MW allocated to the tender. The settlement prices of the 30 bids awarded in the photovoltaic tender were in the range of €46.90/MWh and €53.60/MWh. In the onshore wind energy auction, 26 bids were awarded for a capacity of 191 MW. The final prices of these offers ranged from €55/MWh to €62/MWh. The next auction is scheduled for September 1.
Electricity demand
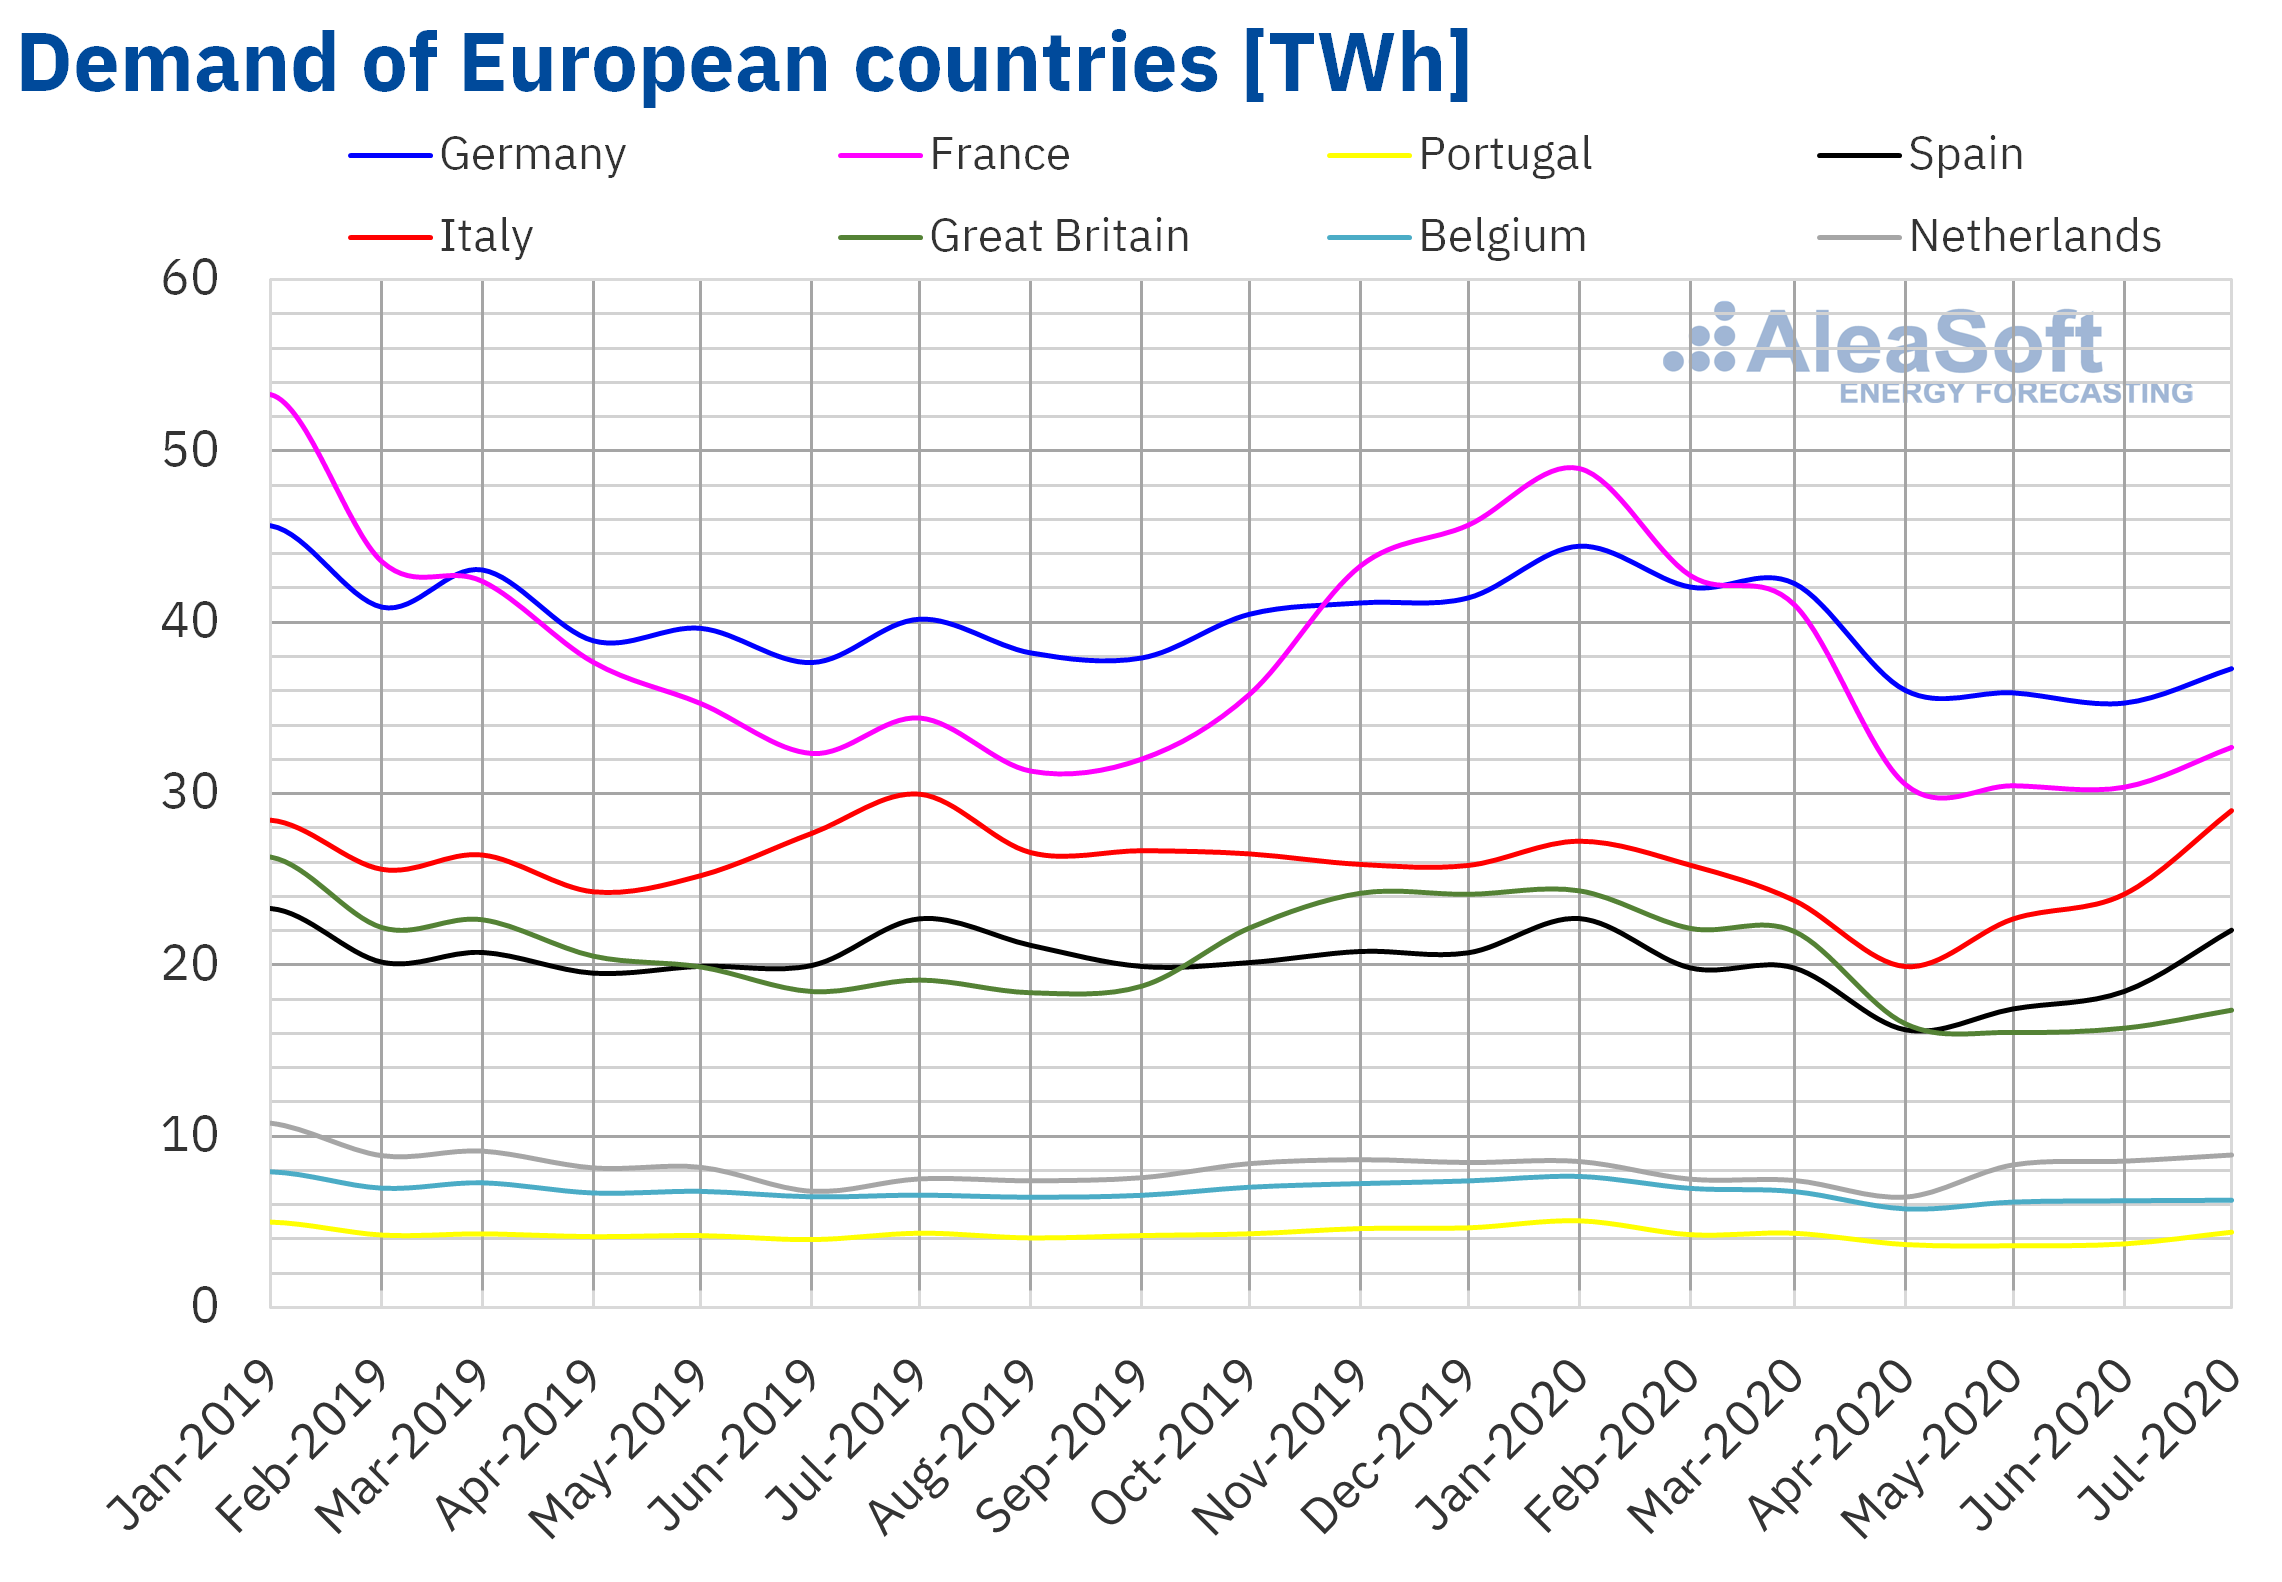
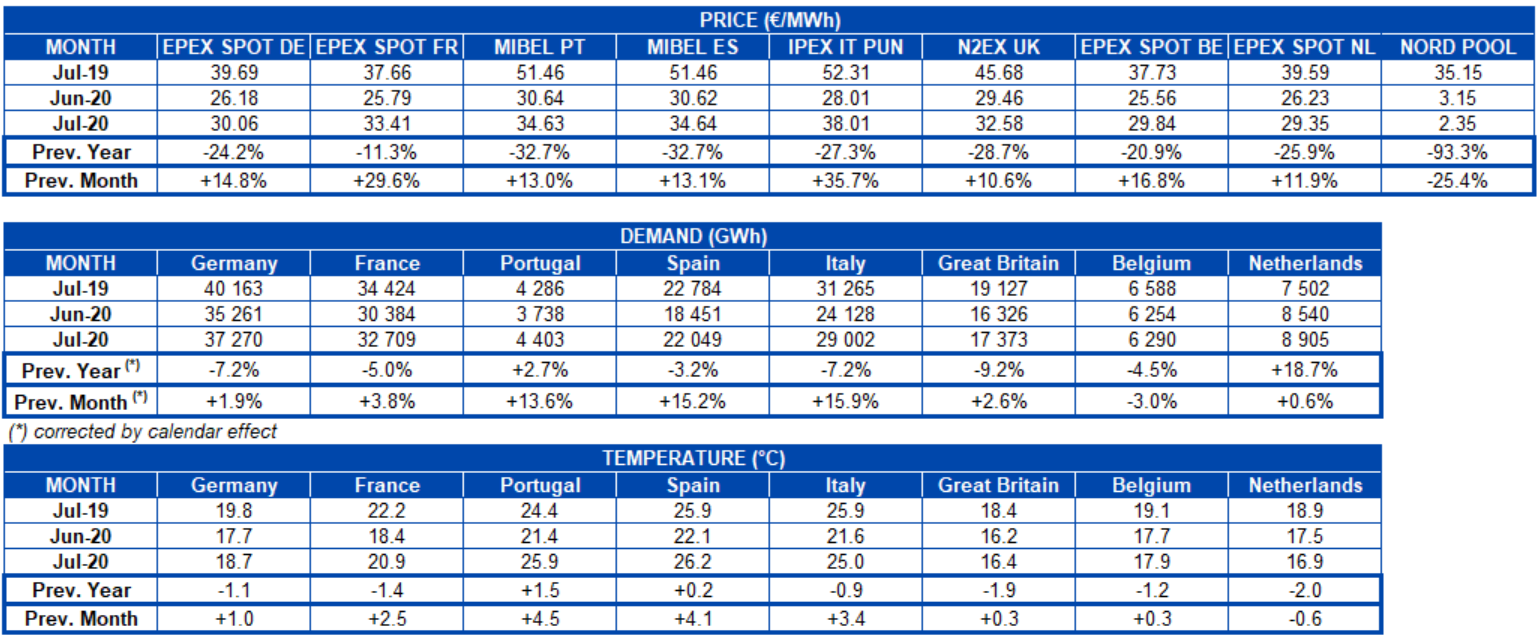
The effects of the coronavirus stood during the month of July on electricity demand in the markets of Europe. The decreases in most of the analysed markets were at least 3% compared to July 2019. The largest falls occurred in Great Britain, Italy and Germany, where demand fell 9.2%, 7.2% and 7.2% respectively. In the markets of France and Belgium the decreases were 4.5% and 5.0%. In the case of the Spanish market, there was a decrease of 3.0%. The Portuguese market emerged unscathed from this downtrend and ended July with a year‑on‑year increase of 2.7%.
However, compared to the month of June 2020, the temperatures had the greatest influence. The arrival of summer and the consequent increase in temperatures, which was over 2.4 °C in most markets, favoured the increase in demand. In this analysis, the increases in Spain and Italy stand out, with values of 17% and 16% respectively. These increases were followed by the 14% registered in the Portuguese market. The increases in France, Great Britain and Germany were on a smaller scale, with records of 4.2%, 3.0% and 2.3%. The Belgian market was the only one among those analyzed that experienced a drop compared to the previous month, with a decrease of 2.7%.
These important increases in the markets of Spain, Italy and Portugal, can be tracked from the observatories of their respective markets in AleaSoft. On this online website with daily updated data, analyses can be carried out in hourly, daily and weekly contexts.
 Source: Prepared by AleaSoft using data from ENTSO-E, RTE, REN, REE, TERNA, National Grid and ELIA.
European electricity markets
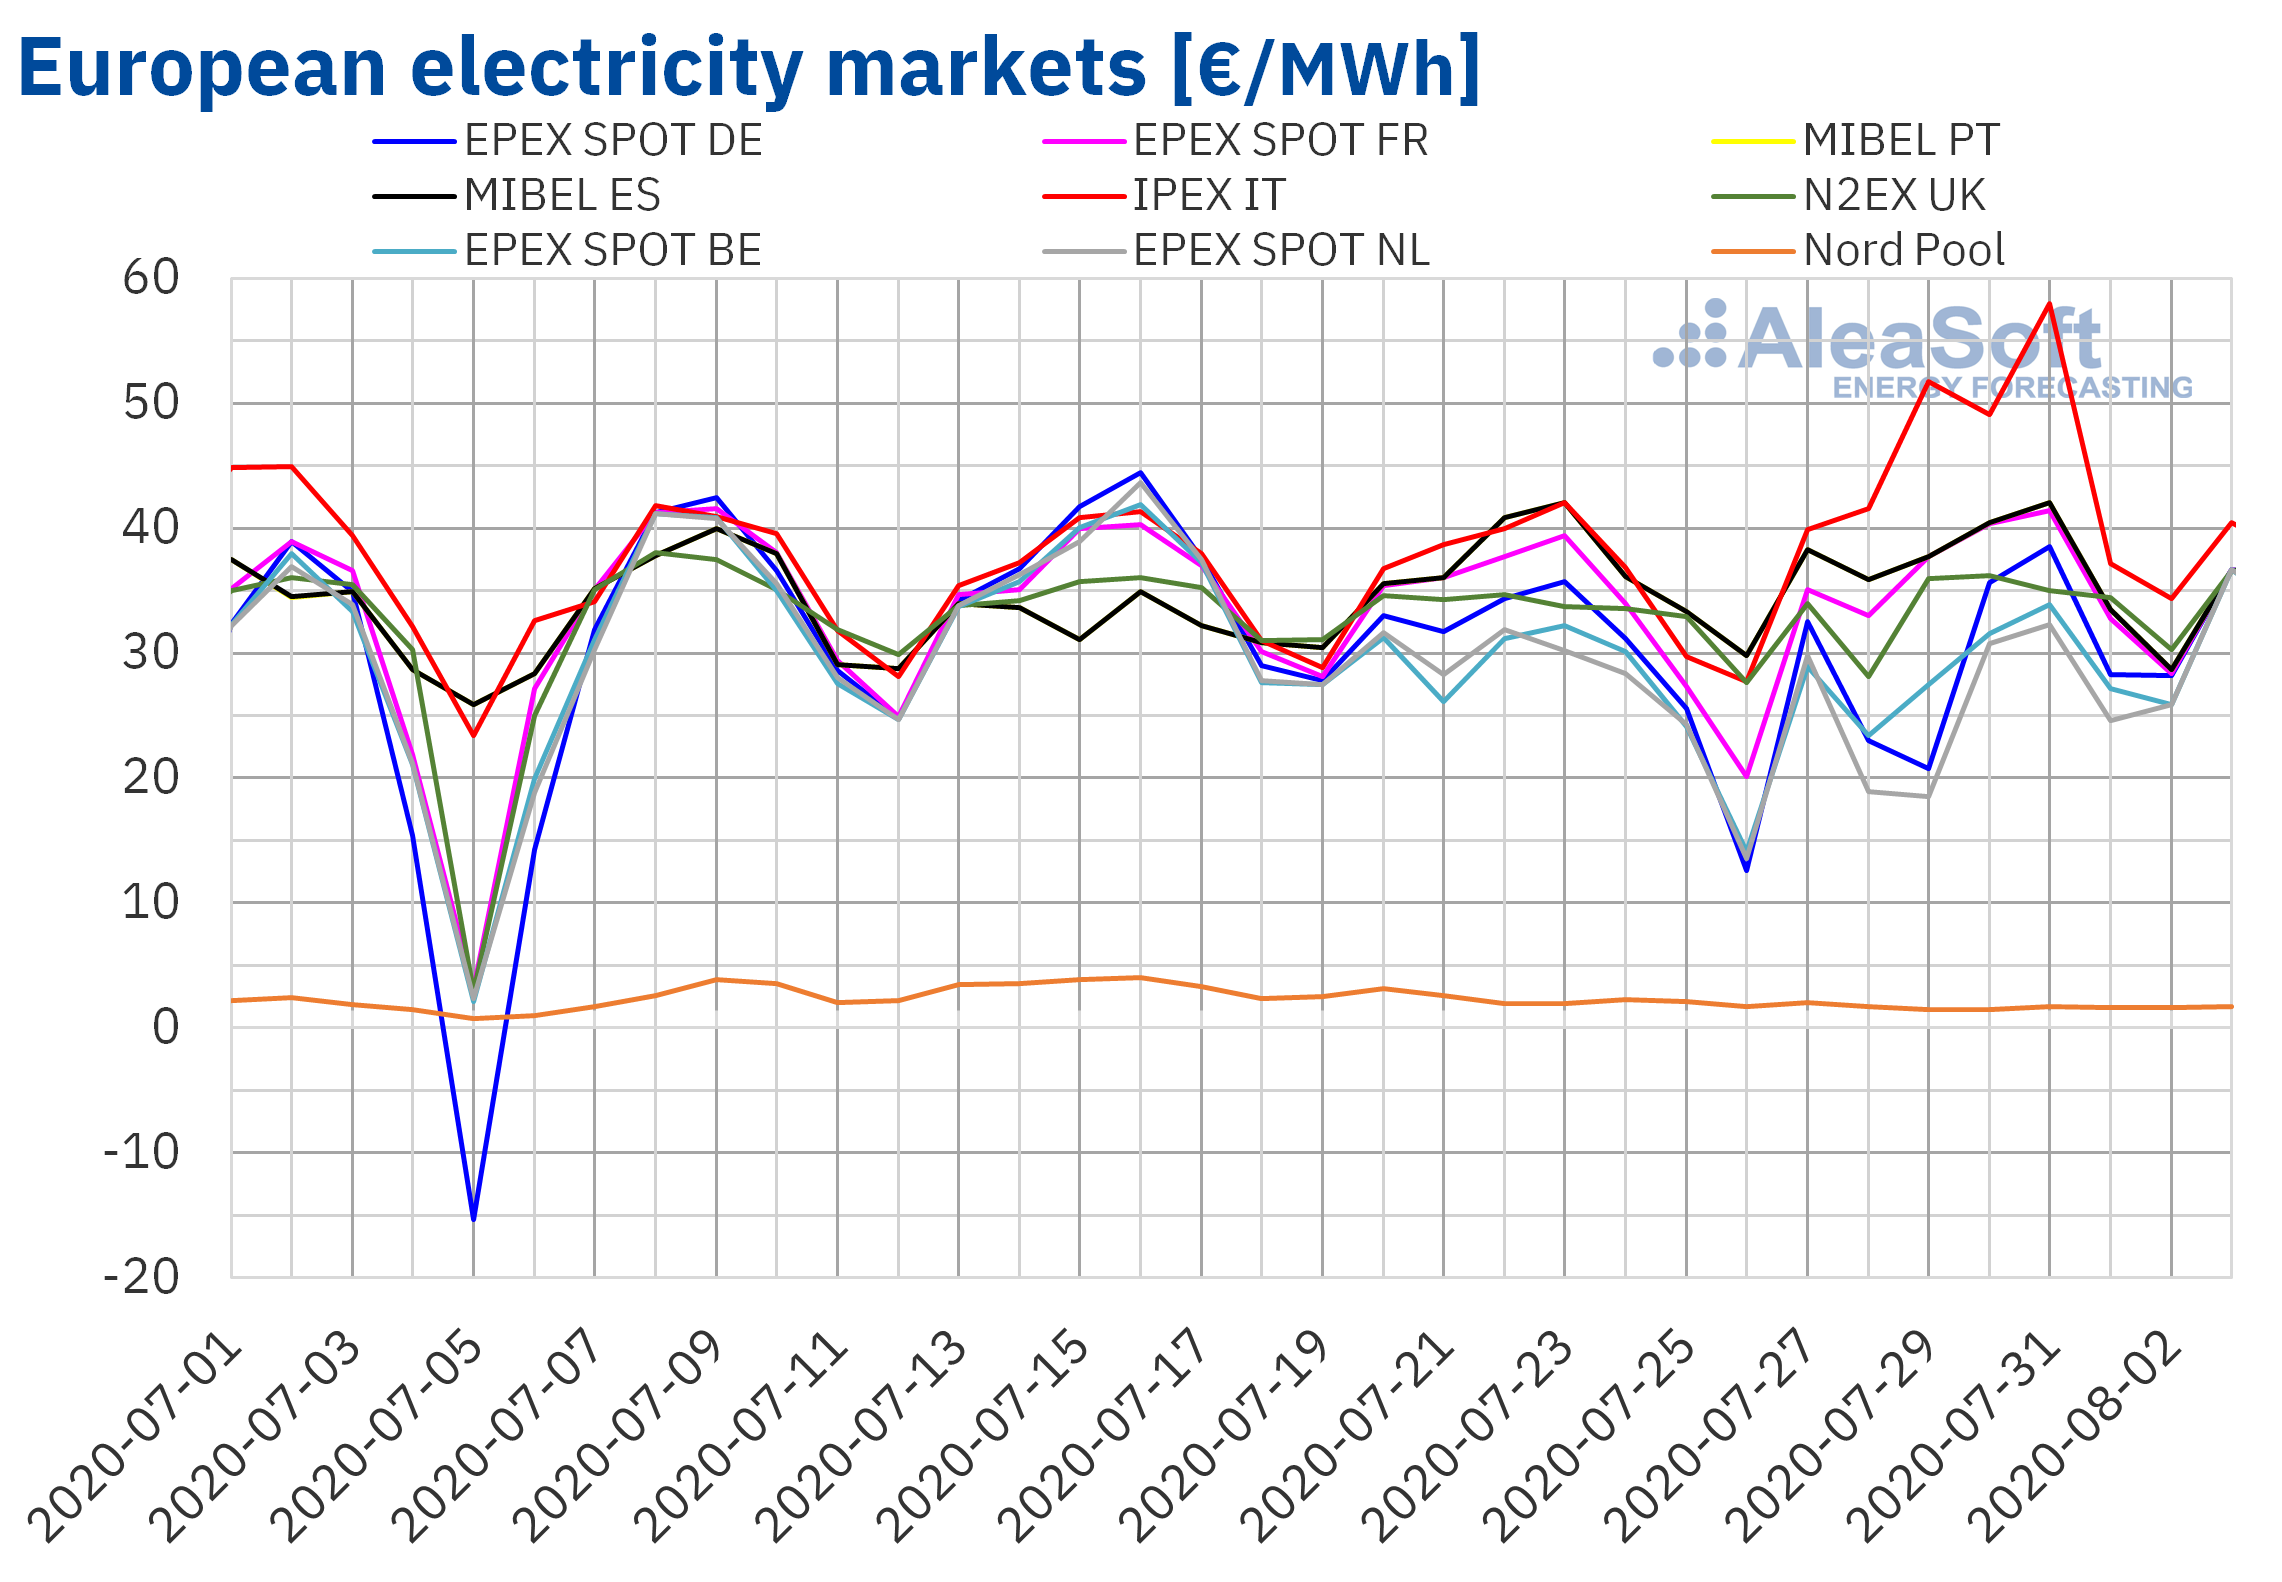
During the month of July, the European electricity markets analysed at AleaSoft registered prices of around €35/MWh for most of the month. The exception was the Nord Pool market in the Nordic countries, whose average price was €2.35/MWh. This value represents the lowest monthly average price in the last decade.
When compared to June, prices increased in almost all markets, except in the Nord Pool market, where prices fell by €0.80/MWh. The Italian IPEX market was the one that increased its price the most, with a rise of €10/MWh compared to the previous month. The second market with the highest increase was the EPEX SPOT market of France, which increased its price by €7.63/MWh compared to June this year. In the rest of the markets, the increases were between €3.12/MWh in the N2EX market of Great Britain and EPEX SPOT of the Netherlands and €4.29/MWh in the EPEX SPOT market of Belgium.
However, compared to July 2019, the July 2020 prices were lower in all electricity markets. The Nord Pool market was the one with the greatest variation, with a 93% decrease in its prices. The MIBEL markets of Spain and Portugal were the second and third markets with the largest drop, of 33%. On the other hand, the market of France was the one with the least variation, with a decrease of 11%. The rest of the markets registered reductions of between 21% of the Belgian market and 29% of the British market.
It is worth noting the behaviour of prices on Sunday, July 5, when the lower demand that characterises this day of the week was combined with high wind energy production and prices in all markets registered falls. In the case of the EPEX SPOT market of Germany, it ended up meaning a negative daily price of €‑15.34/MWh. In the rest of the markets the fall was also noticeable. Where it was less noticeable was in the Nord Pool market of the Nordic countries, since in the generation mix of the countries of this region, it is not wind energy but hydroelectric energy the one that is the renewable source with the greatest contribution. However, it was the record for the month with the lowest daily price, the only day that the price in this market fell below €1/MWh.
 Source: Prepared by AleaSoft using data from , MIBEL, IPEX, N2EX and Nord Pool.
In the Iberian electricity market in particular, during the month of July 2020 the average price of the MIBEL market of Spain and Portugal amounted to around €4/MWh compared to the previous month of June. One of the main causes of this increase is the rise in demand during July, favoured, on the one hand, by the relaxation of the confinement measures that took place progressively during the month of June and which were already completed in July. On the other hand, the increase in demand also occurs due to the increase in temperatures, whose average values increased by 4.5 °C and 3.9 °C in Portugal and Spain, respectively.
However, when analysing the month of July 2020 with respect to the month of July 2019, the recently concluded month presented a much lower price in the Iberian market. The difference in prices was approximately €16.83/MWh in both countries and this represented a decrease of 33%, largely influenced by the significant increase in wind and solar energies production in Spain, from 36% to 52%, respectively, and a level of global market demand that still was below 2019 levels.
Electricity futures
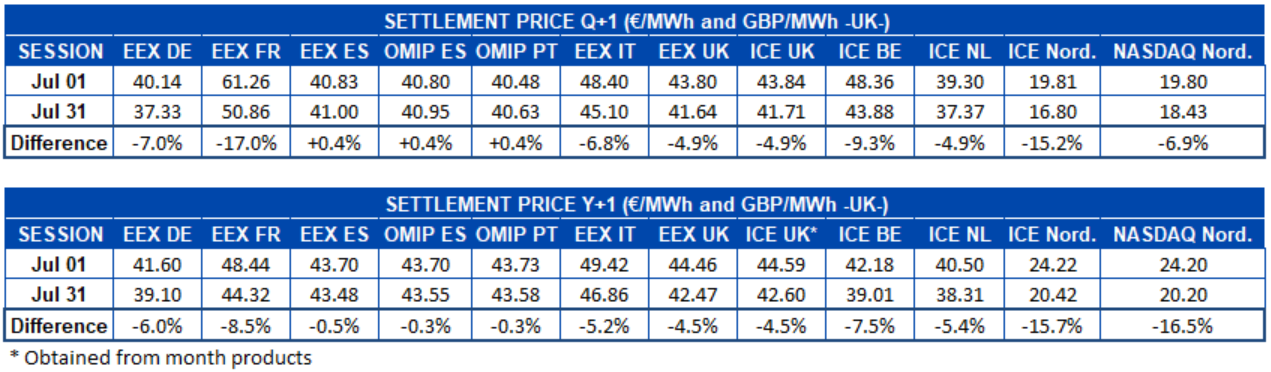
During the past month of July, the prices of electricity futures for the next quarter had a predominantly downward behaviour. The EEX market of Spain and the OMIP market of Spain and Portugal were the exception, with increases of 0.4% in all three cases. In the rest of the markets, the falls are between the 4.9% decrease in the EEX markets in Great Britain and the ICE market of Great Britain and the Netherlands and the 17% decrease in the EEX market of France. It was closely followed, in percentage terms, by the ICE market of the Nordic countries, with a drop of 15.2%. In the last market session in July 2020, the Nordic markets ICE and NASDAQ registered prices separated by more than €1.50/MWh, settling at €16.80/MWh and €18.43/MWh respectively.
Regarding the product of the calendar year 2021, the European electricity futures markets analysed in AleaSoft all registered price drops during the month of July 2020. The Iberian region was the one that changed its price the least, lowering its price by 0.3% in the OMIP market of Spain and Portugal for both countries and 0.5% in the EEX market of Spain. The Nordic countries were the ones with the greatest drop in price, registering a decrease of 15.7% in the ICE market and 16.5% in the NASDAQ market of this region.
Brent, fuels and CO2
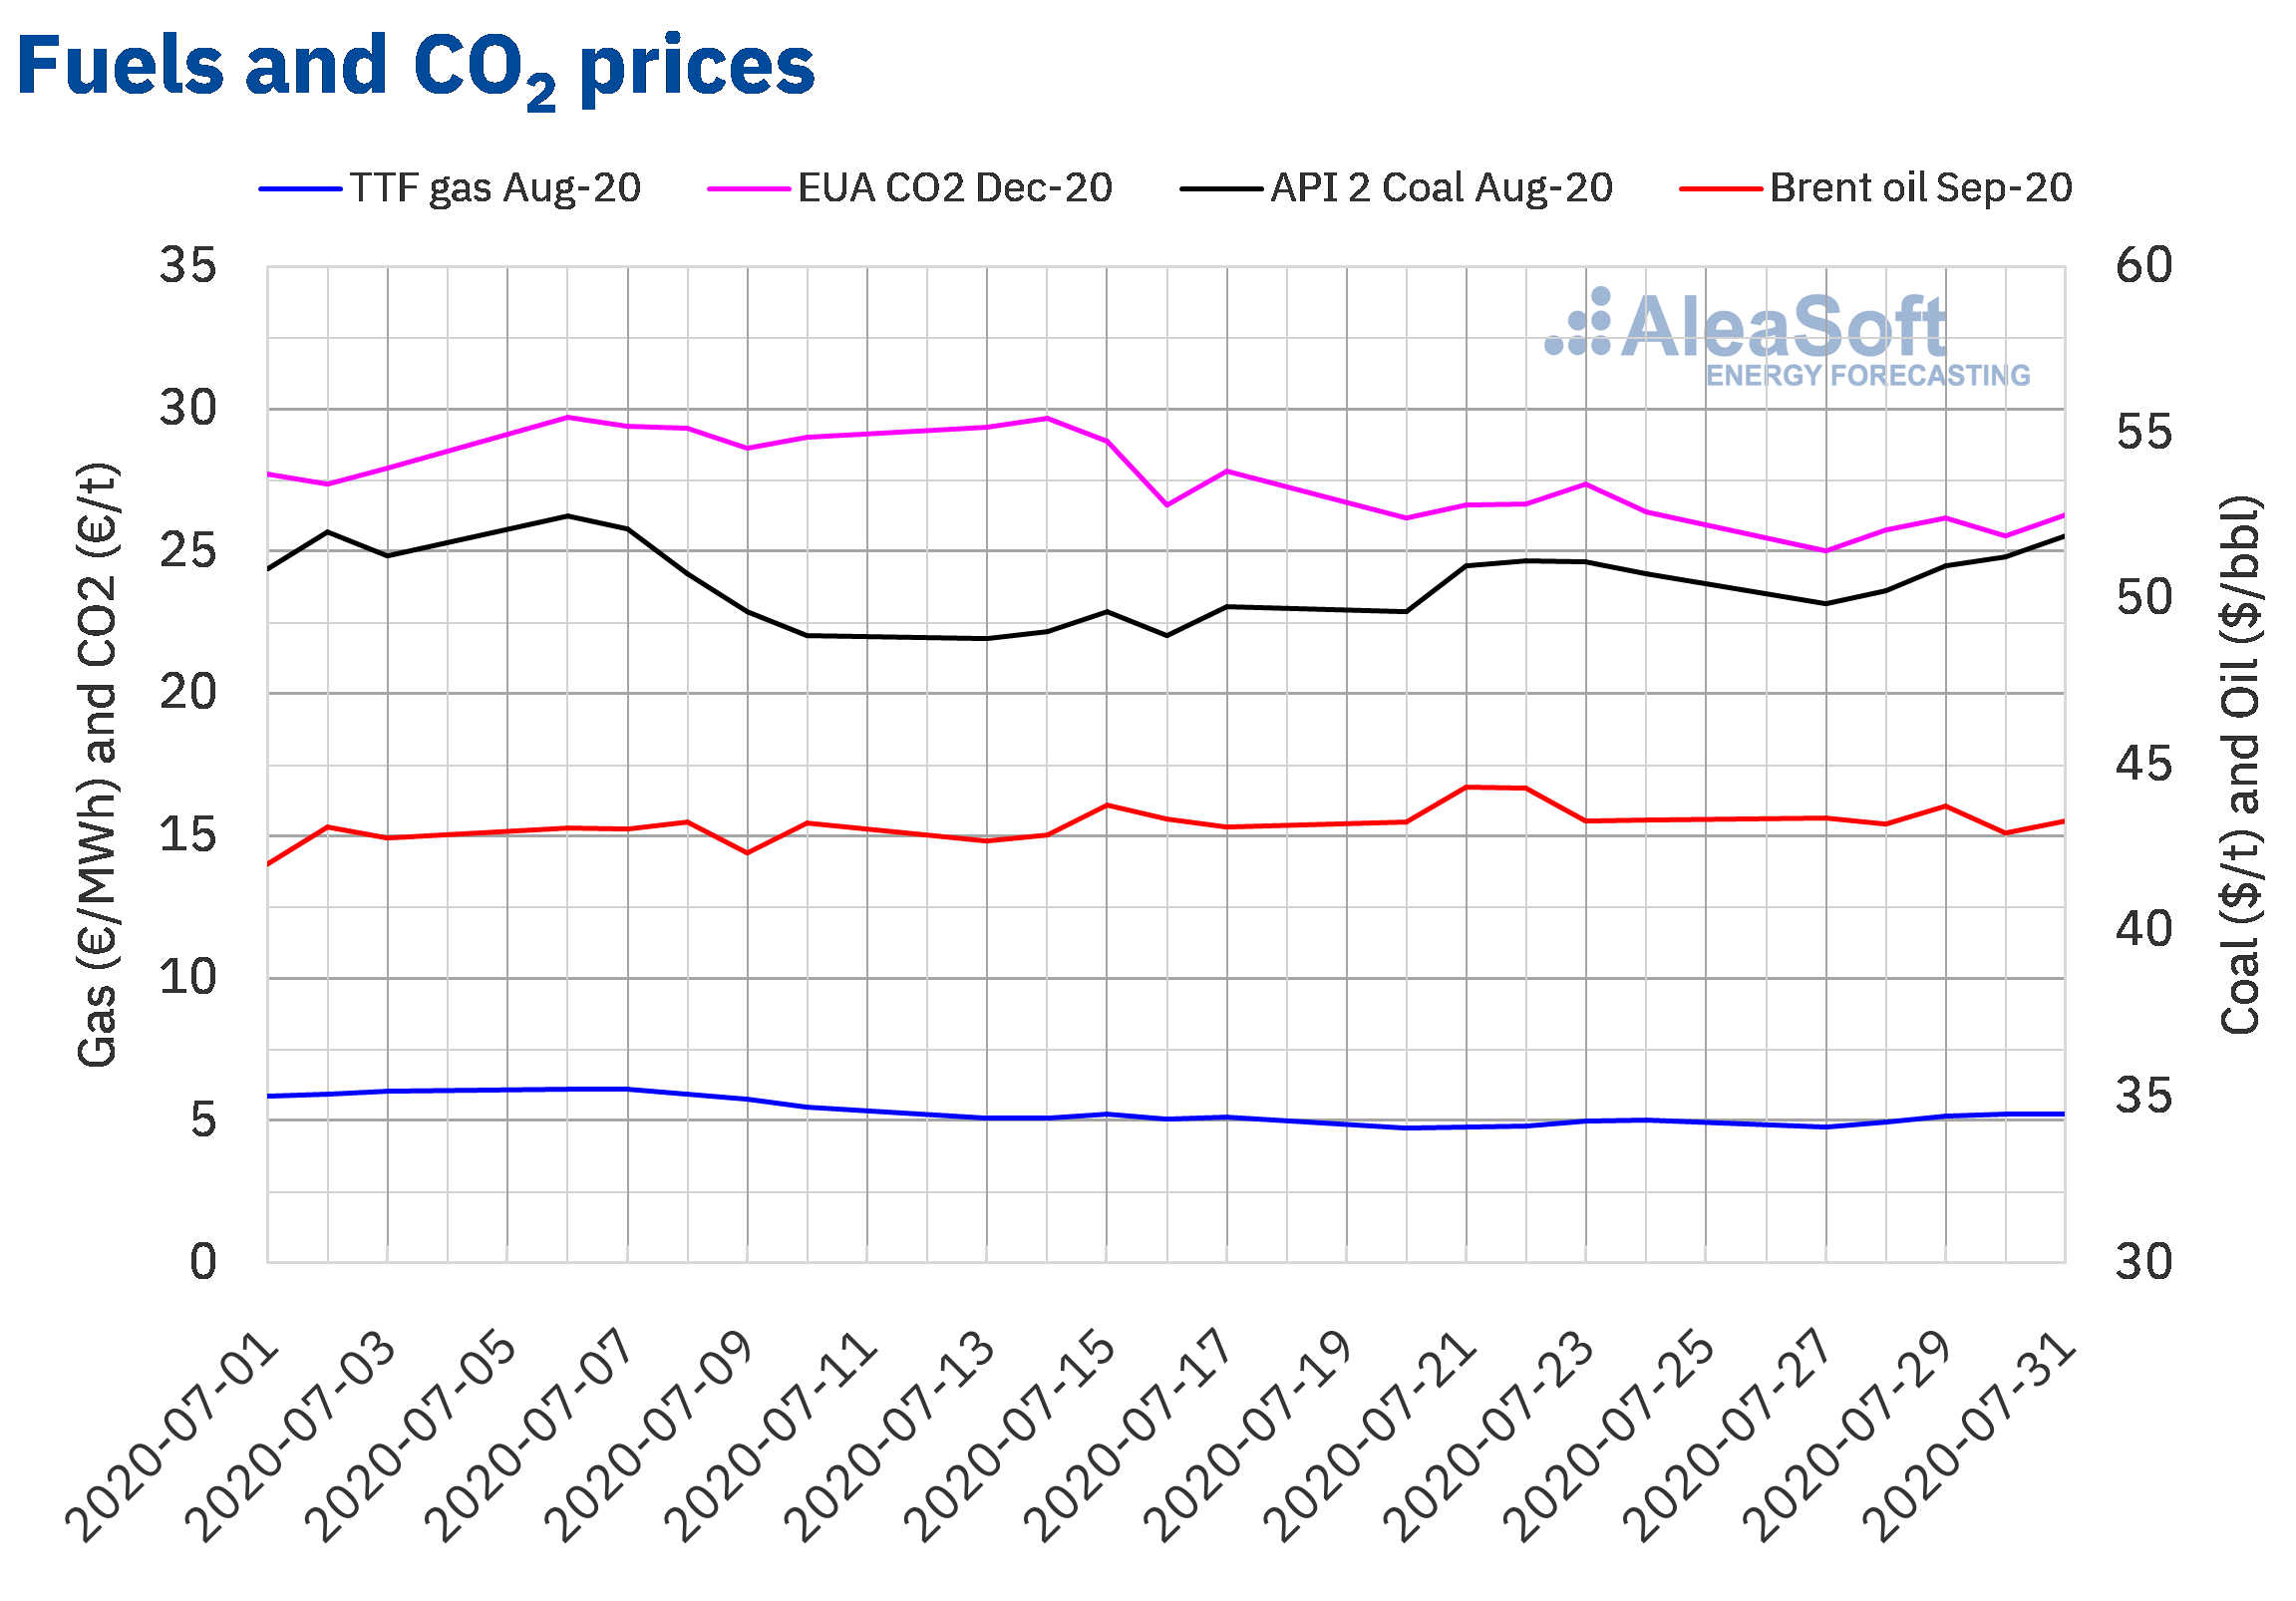
The settlement prices of Brent oil futures for September 2020 in the ICE market during the month of July were above $42/bbl. The minimum settlement price, of $42.03/bbl, was registered on the first day of the month. But on the second day of July, the highest price variation of the month was produced, increasing by $1.11/ bbl to stand at $43.14/bbl. The highest prices of the month were reached in the fourth week and the maximum settlement price of $44.32/bbl was registered on Tuesday, July 21. On the other hand, the monthly average price was $43.22/bbl. This value is 6.0% higher than that reached by futures for the month M+2 in June 2020, of $40.77/bbl, but still 33% lower than that corresponding to M+2 futures traded in July 2019, from $64.21/bbl.
In July, the extension of OPEC+ production cuts and the recovery in demand allowed prices to be higher than in the previous month. However, the impact of COVID-19, with the increase in the number of cases of infected people, limited the recovery.
Starting this August, OPEC+ will increase its production with the expectation that the recovery in demand will offset the increase in supply. However, the evolution of the pandemic could affect the economic recovery and fears of a drop in demand could lead to price declines in the first days of the month.
The TTF gas futures in the ICE market for the month of August 2020 reached the highest prices in July during the first two weeks. In that period, prices were around €5.90/MWh and reached the maximum settlement price for the month, of €6.12/MWh, on July 7. In the rest of the month, prices stabilised at around €5/MWh. The minimum price in July of €4.73/MWh was reached on Monday the 20th. On the other hand, the average value registered during the month was €5.33/MWh. Compared to the futures for the month M+1 traded in the month of June 2020, of €5.27/MWh, this increased slightly by 1.2%. Compared to M+1 futures traded in July 2019, when the average price was €11.01/MWh, the decrease was 52%.
In the case of the spot market, last month TTF gas prices reached their maximum index price of €5.85/MWh on July 1 and had prices above €5/MWh during the first ten days of the month. But, the rest of the month prices were lower and the minimum index price of €4.23/MWh was reached on July 15. On the other hand, the average spot price this July was €4.92/MWh, which coincides with that of June 2020. However, it was 55% lower than in July 2019, of €10.89/MWh.
Regarding the API 2 coal futures in the ICE market for the month of August 2020, the maximum monthly settlement price, of $52.50/t, was reached on July 6. But the rest of the second week of the month, prices fell and on Monday, July 13 the minimum settlement price of $48.80/t was registered. In the second half of July, prices recovered influenced by the fear of decreases in supply, since the announcements of plans to reduce production in Colombia were added to the effects of the floods in China. Finally, the average monthly price in July was $50.52/t, 7.6% higher than the average price of API 2 coal futures for the month M+1 of June 2020, of $46.97/t, but 11% lower than the July 2019 price of $56.83/t.
As for the CO2 emission rights futures in the EEX market for the reference contract of December 2020, they registered higher prices during the first half of July. The maximum settlement price for the month, of €29.69/t, was registered on Monday, July 6. This price was the highest since the beginning of August 2019. In contrast, the monthly minimum settlement price of €25.01/t was reached on July 27. The average price in July was €27.53/t, 17% higher than in June, at €23.55/t. Compared to the average price of €28.35/t for the month of July 2019 for the same product, the average for July 2020 was only 2.9% lower.
 Source: Prepared by AleaSoft using data from ICE and EEX.
AleaSoft analysis on the affectations of the electricity markets due to the coronavirus crisis
At AleaSoft, a series of webinars was organised since the beginning of the coronavirus crisis, to analyse the evolution of energy markets and the financing of renewable energy projects in this situation. In the current situation of de-escalation of the measures taken in March and April when the pandemic broke out in Europe, but with the persistence of outbreaks of COVID-19 and the very negative data of the European economies during the second quarter of the year, it is very important to analyse what are the prospects for recovery in the European energy sector. For this reason, the next webinar “The energy markets in the recovery from the economic crisis” will be divided into two parts, the first on September 17 and the second on October 29, with speakers from Deloitte, Vector Renewables, Engie and AleaSoft. In addition to the mentioned topics, the forecasting importance in audits and portfolio valuation will be discussed.
Taking into account the outbreaks of the pandemic that are occurring worldwide and the most recent scenarios of recovery from the coronacrisis, in AleaSoft the long-term price curves of the European electricity markets have been updated.
The AleaSoft observatories are a tool to monitor the evolution of the European electricity, fuel and CO2 emission rights markets. They contain data that is updated daily and can be viewed in a comparison with previous weeks, to see its evolution.
Source: AleaSoft Energy Forecasting.