AleaSoft, January 21, 2019. AleaSoft analysed the evolution of electricity consumption after the crisis and during the economic recovery, and observed a clear change in the use of electricity and an increase in electrical efficiency.
The economic crisis of the last decade changed the way of consuming electricity of households, businesses and industries. As electricity bill is an important expense in the domestic economy and in some industries, the logical tendency is to reduce consumption and optimize it so that the price per kWh consumed is lower.
The electricity demand in Spain experienced an important growth until 2008. Between 1995 and 2008, electricity consumption almost doubled with an increase of 75.1%. This increase in demand was linked to a virtually identical growth of the country’s Gross Domestic Product (GDP). The relationship between electricity consumption and GDP becomes evident again between 2008 and 2013, when the economic crisis caused GDP to fall by 8.9% and then followed by a decrease in electricity demand of 6.6%.
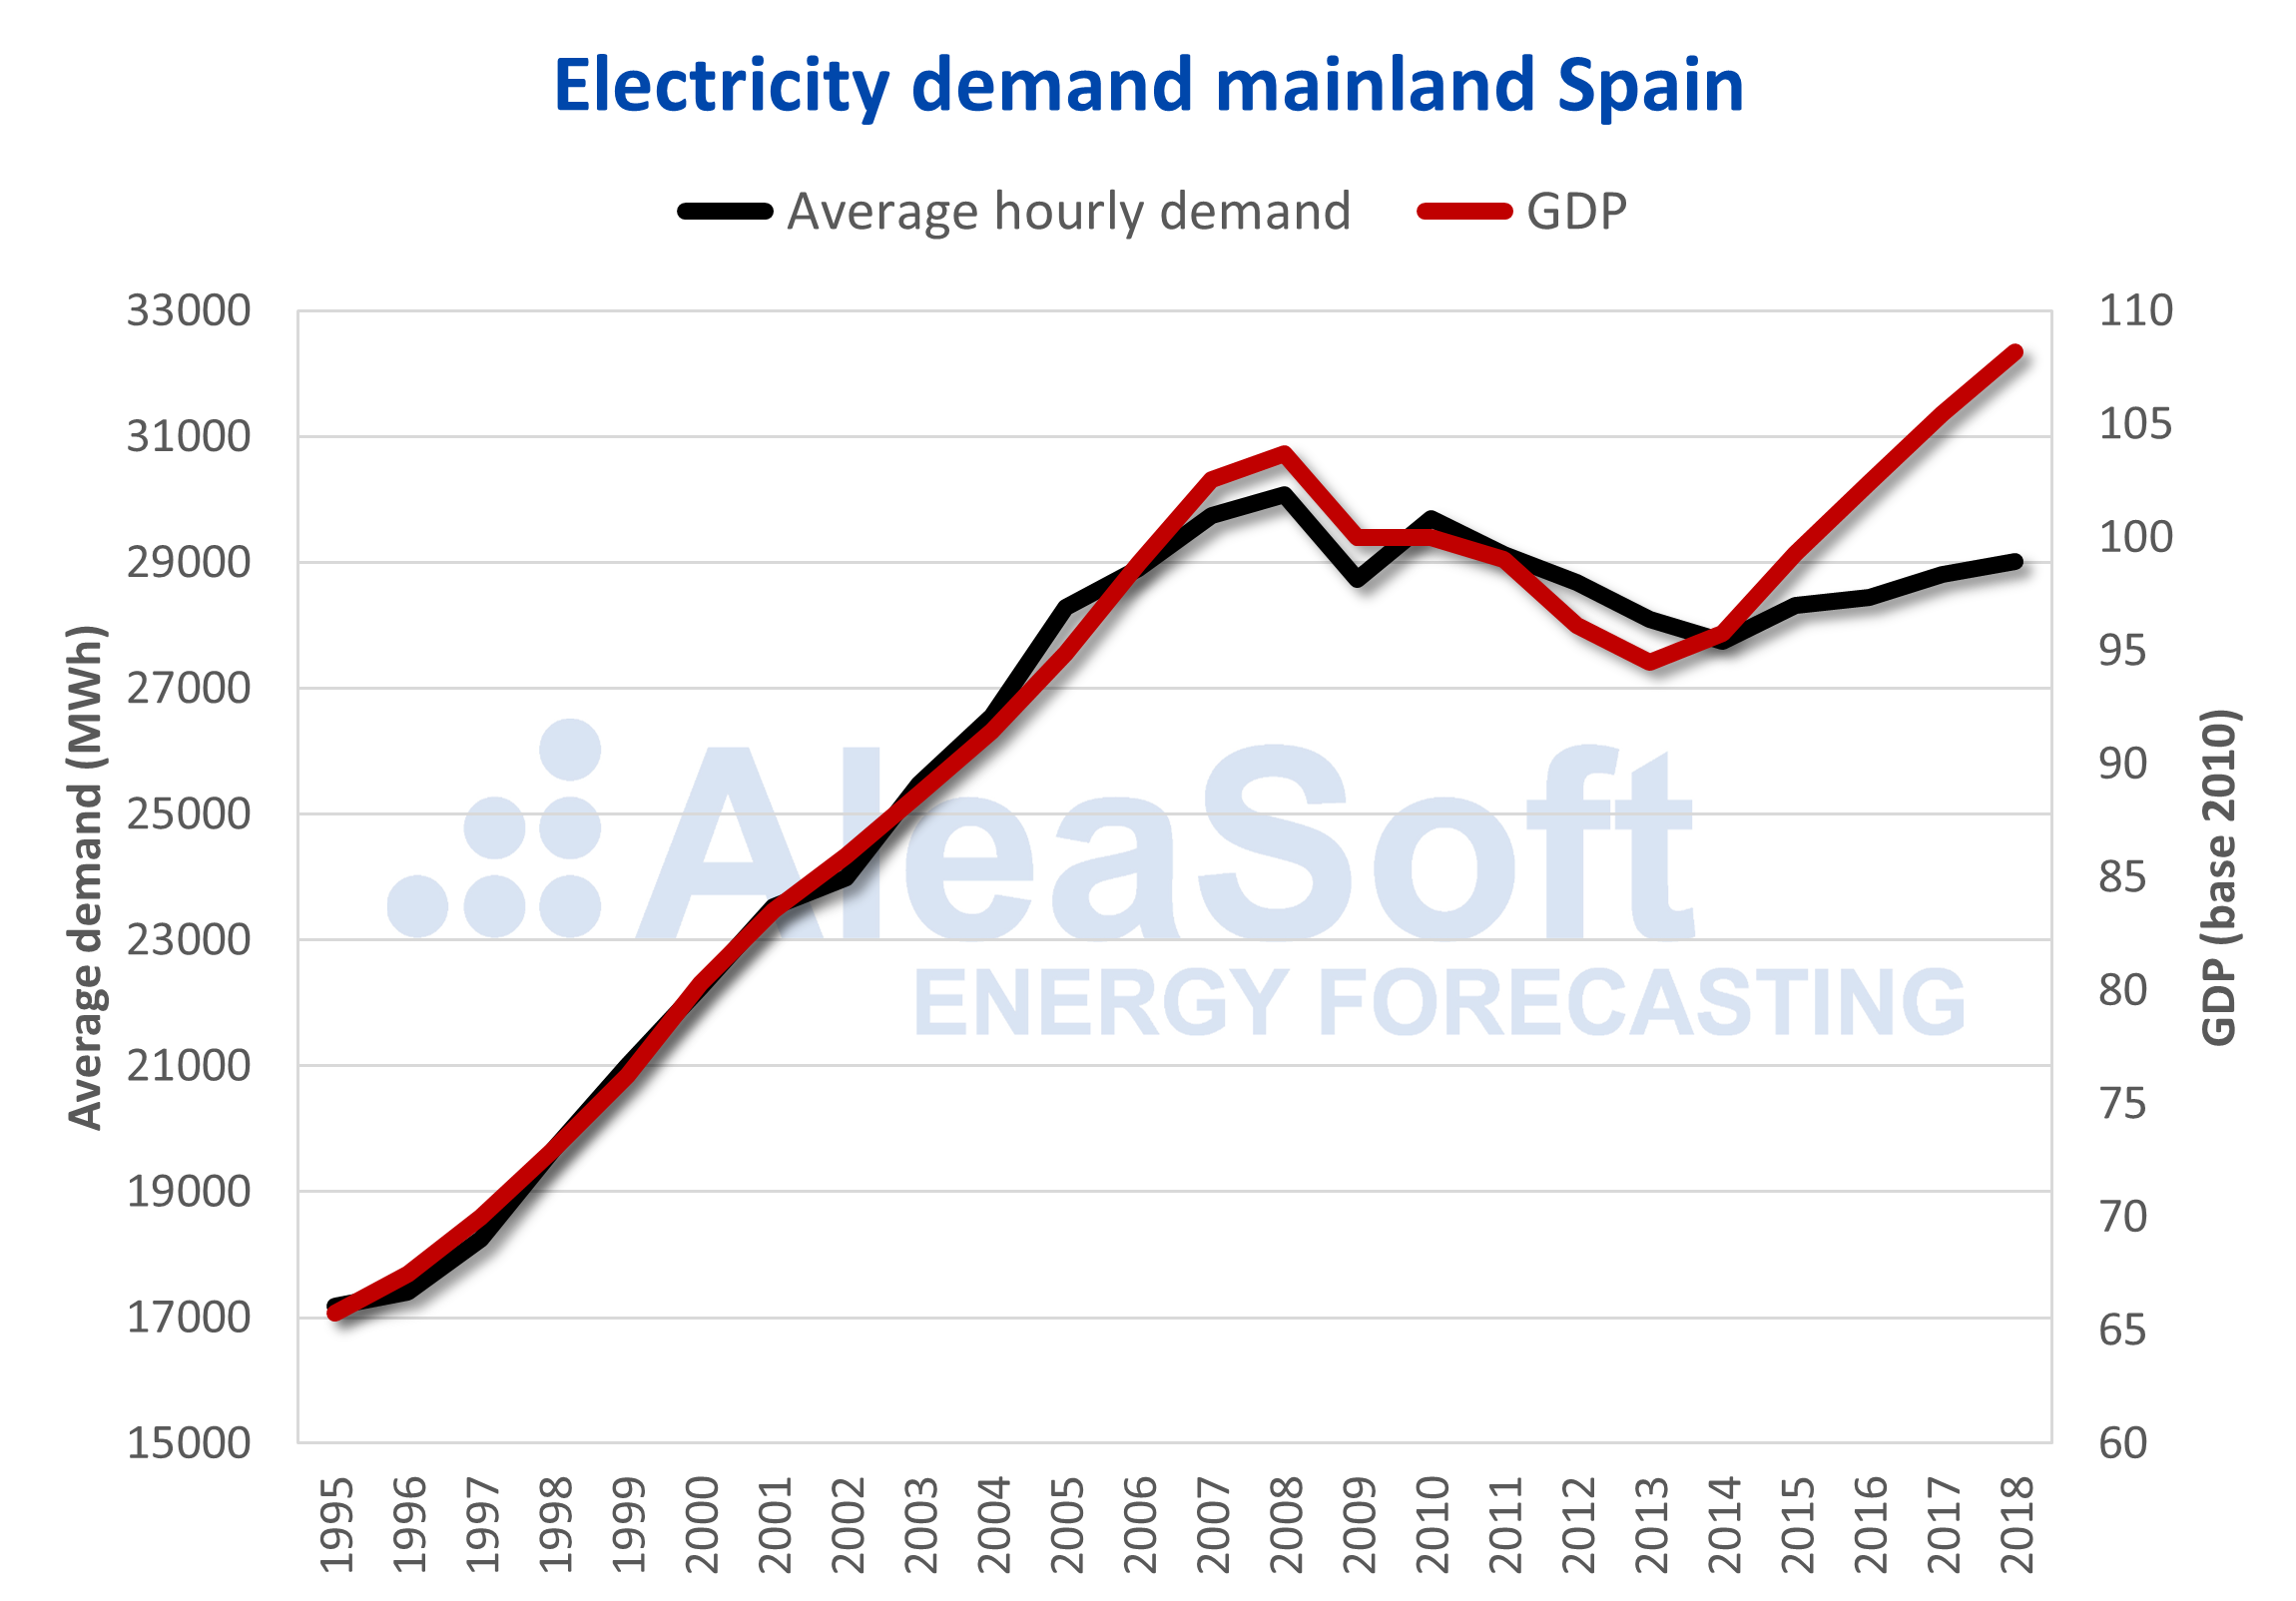
Sources: REE and INE data analysed by AleaSoft.
But the interesting change comes in 2014, when the economy begins to show signs of recovery, and GDP begins to grow again at a rate similar to before 2008. So does electricity consumption, but now at a much slower pace than the GDP. Between 2014 and 2018, GDP is estimated to have grown by around 13%, while electricity demand grew by 4.6%. The reduction of energy intensity is a clear indicator of the increase in energy efficiency after the crisis. To clarify, energy intensity relates energy consumption to GDP to determine how much energy is needed to produce the country’s wealth, and is an indicator of energy use and how efficient a country is at producing goods and services.
In addition to the increase in electrical efficiency, optimization of consumption has also been mentioned to reduce the cost. To determine if there has been a change in habits to reduce the cost of the electricity purchased, AleaSoft analysed the evolution of the daily range of hourly electricity demand, that is, the difference between the minimum and maximum hourly demand of each day. What is observed is that the evolution of the daily range and the volume of demand is very similar until 2013. From then on, after the economic crisis, the volume of demand begins to recover, but the daily range continues to decline, indicating that the hourly demand curve flattened reducing the distance between the maximum and the minimum. This behaviour is very similar to that observed in the wholesale electricity price that was explained in a previous AleaSoft news. Undoubtedly, the flattening of the demand curve has been a key factor in the flattening of the price curve.
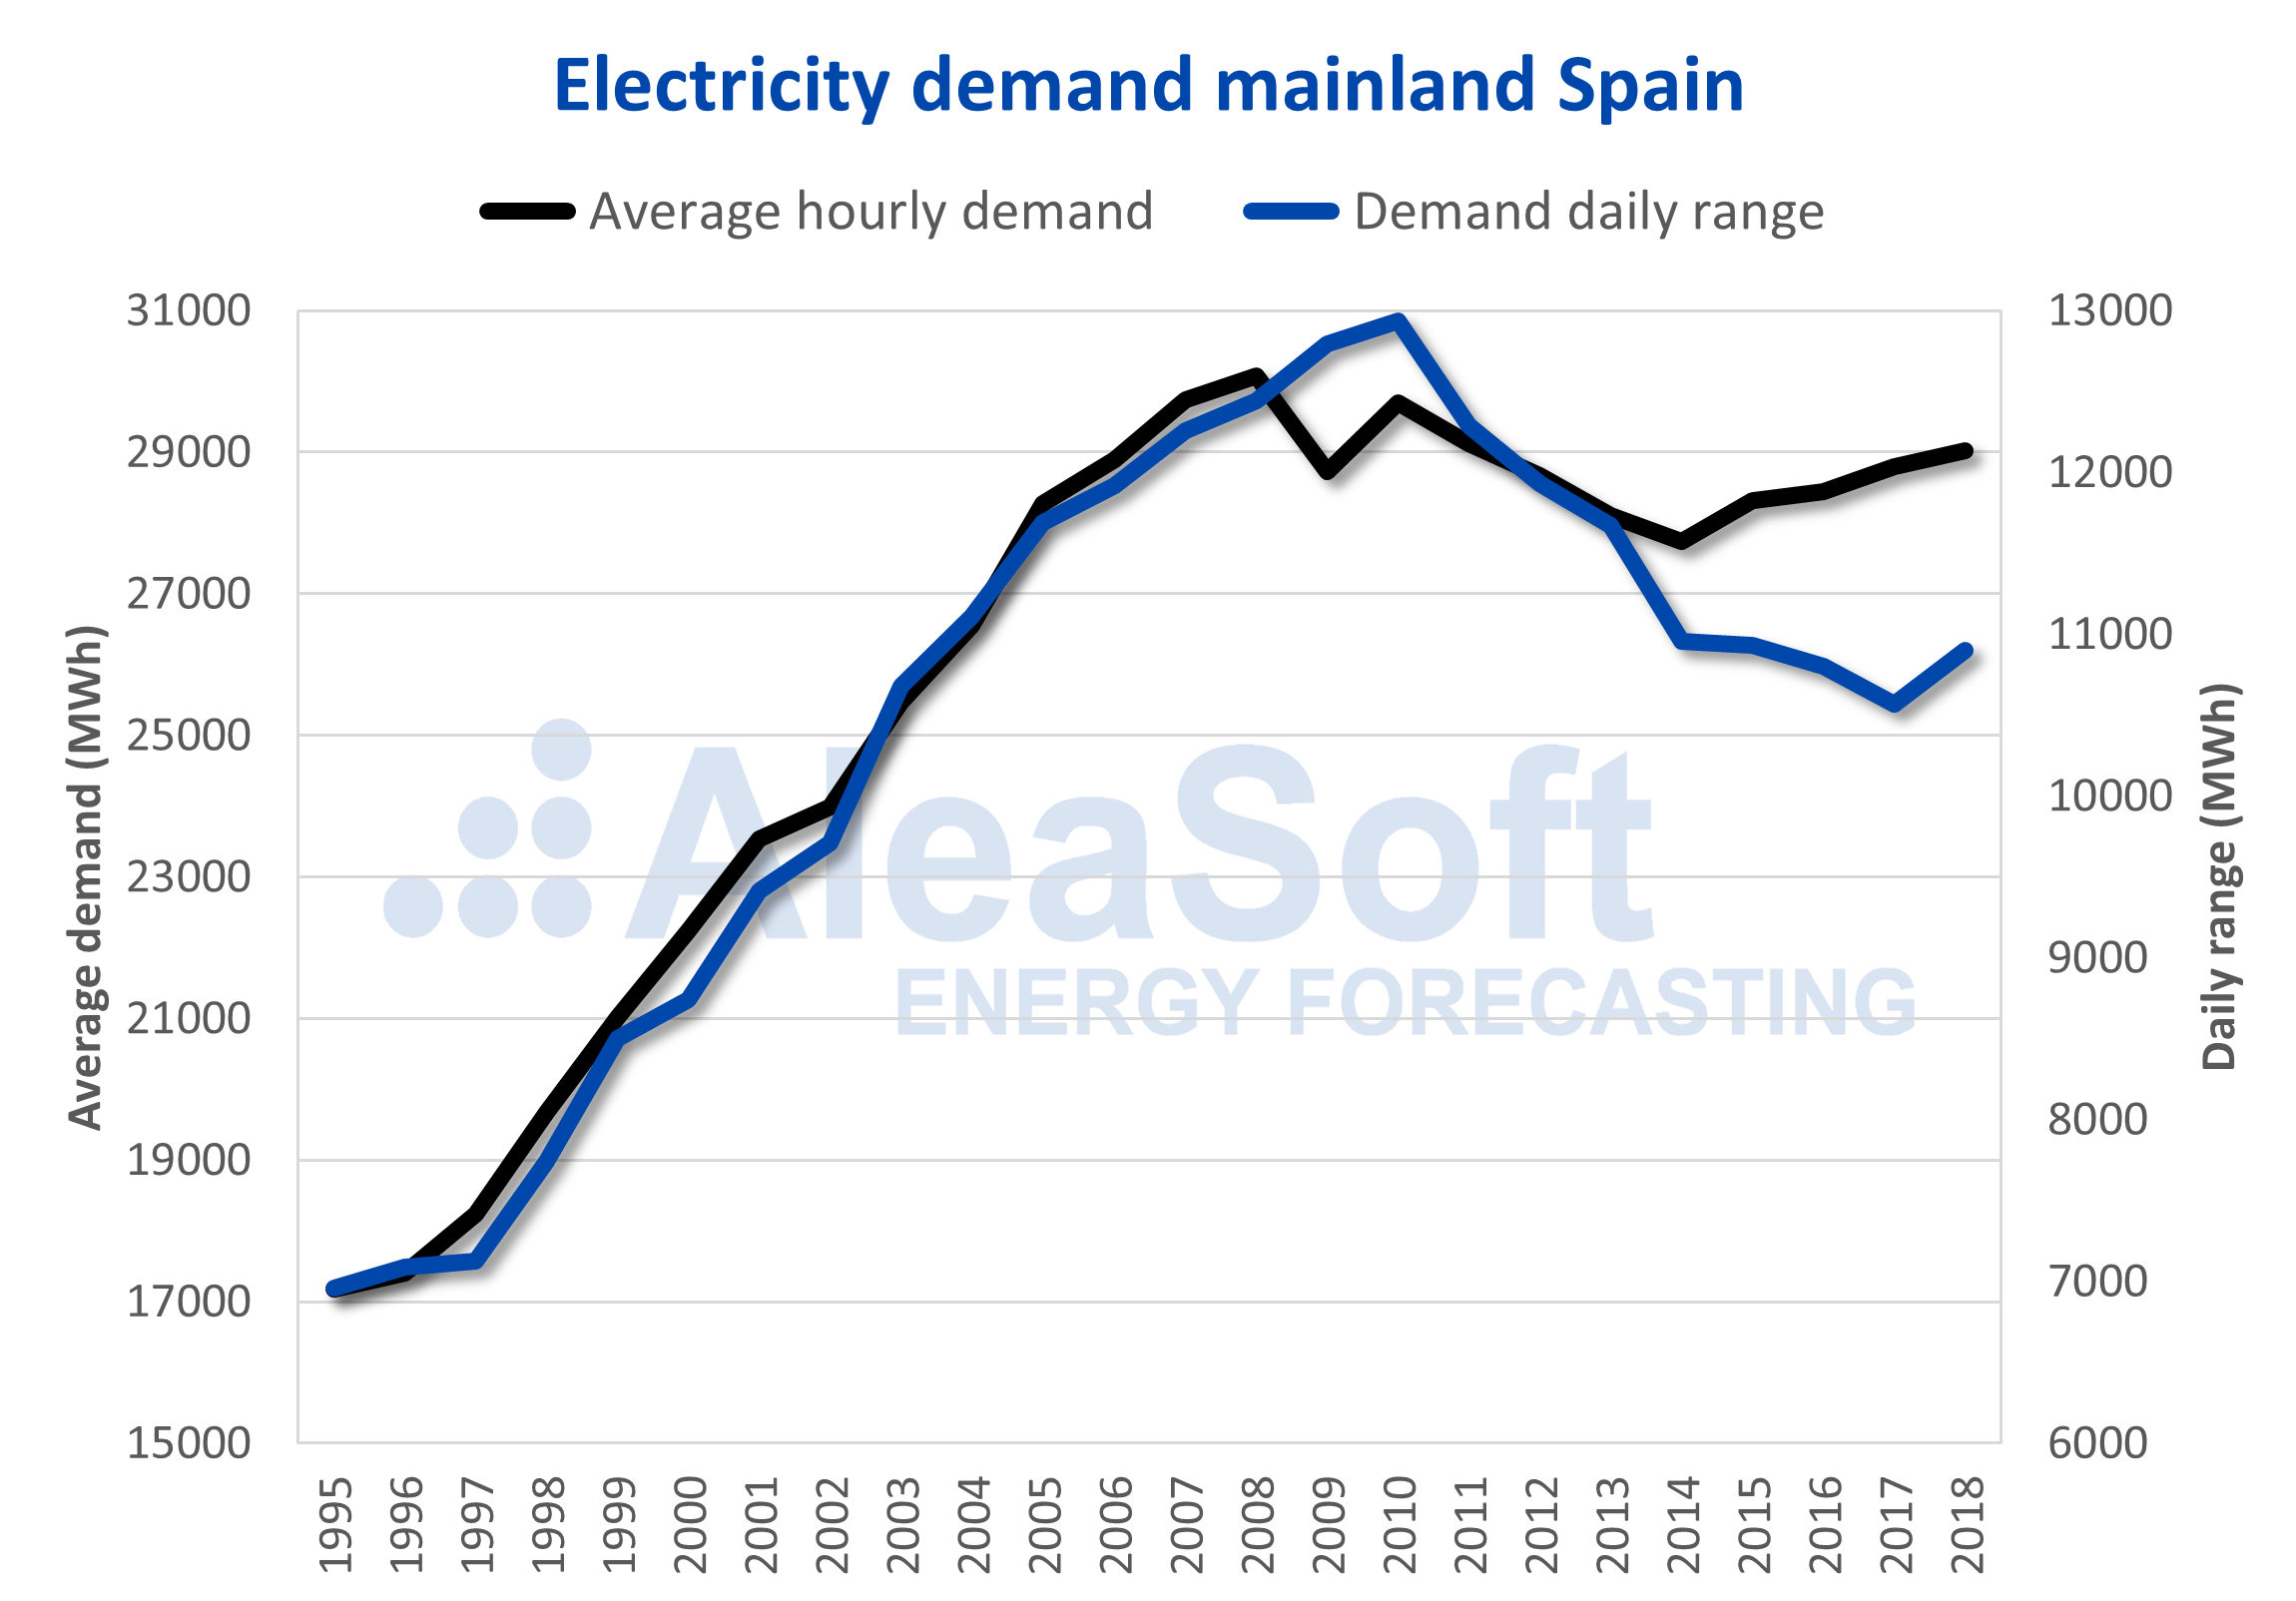
Sources: REE data analysed by AleaSoft.
There is a shift in demand from the hours with the highest consumption during the day to the hours with the least consumption at night to take advantage of the lowest prices in that period. This tendency to shift the demand from the peak of the day to the valley of the night is corroborated by the number of contracts with time-based tariffs that benefit from the difference in the final price between the hours of the day and night. As can be seen in the following graph, the number of domestic contracts with time-based tariffs is experiencing significant growth since 2014 approximately.
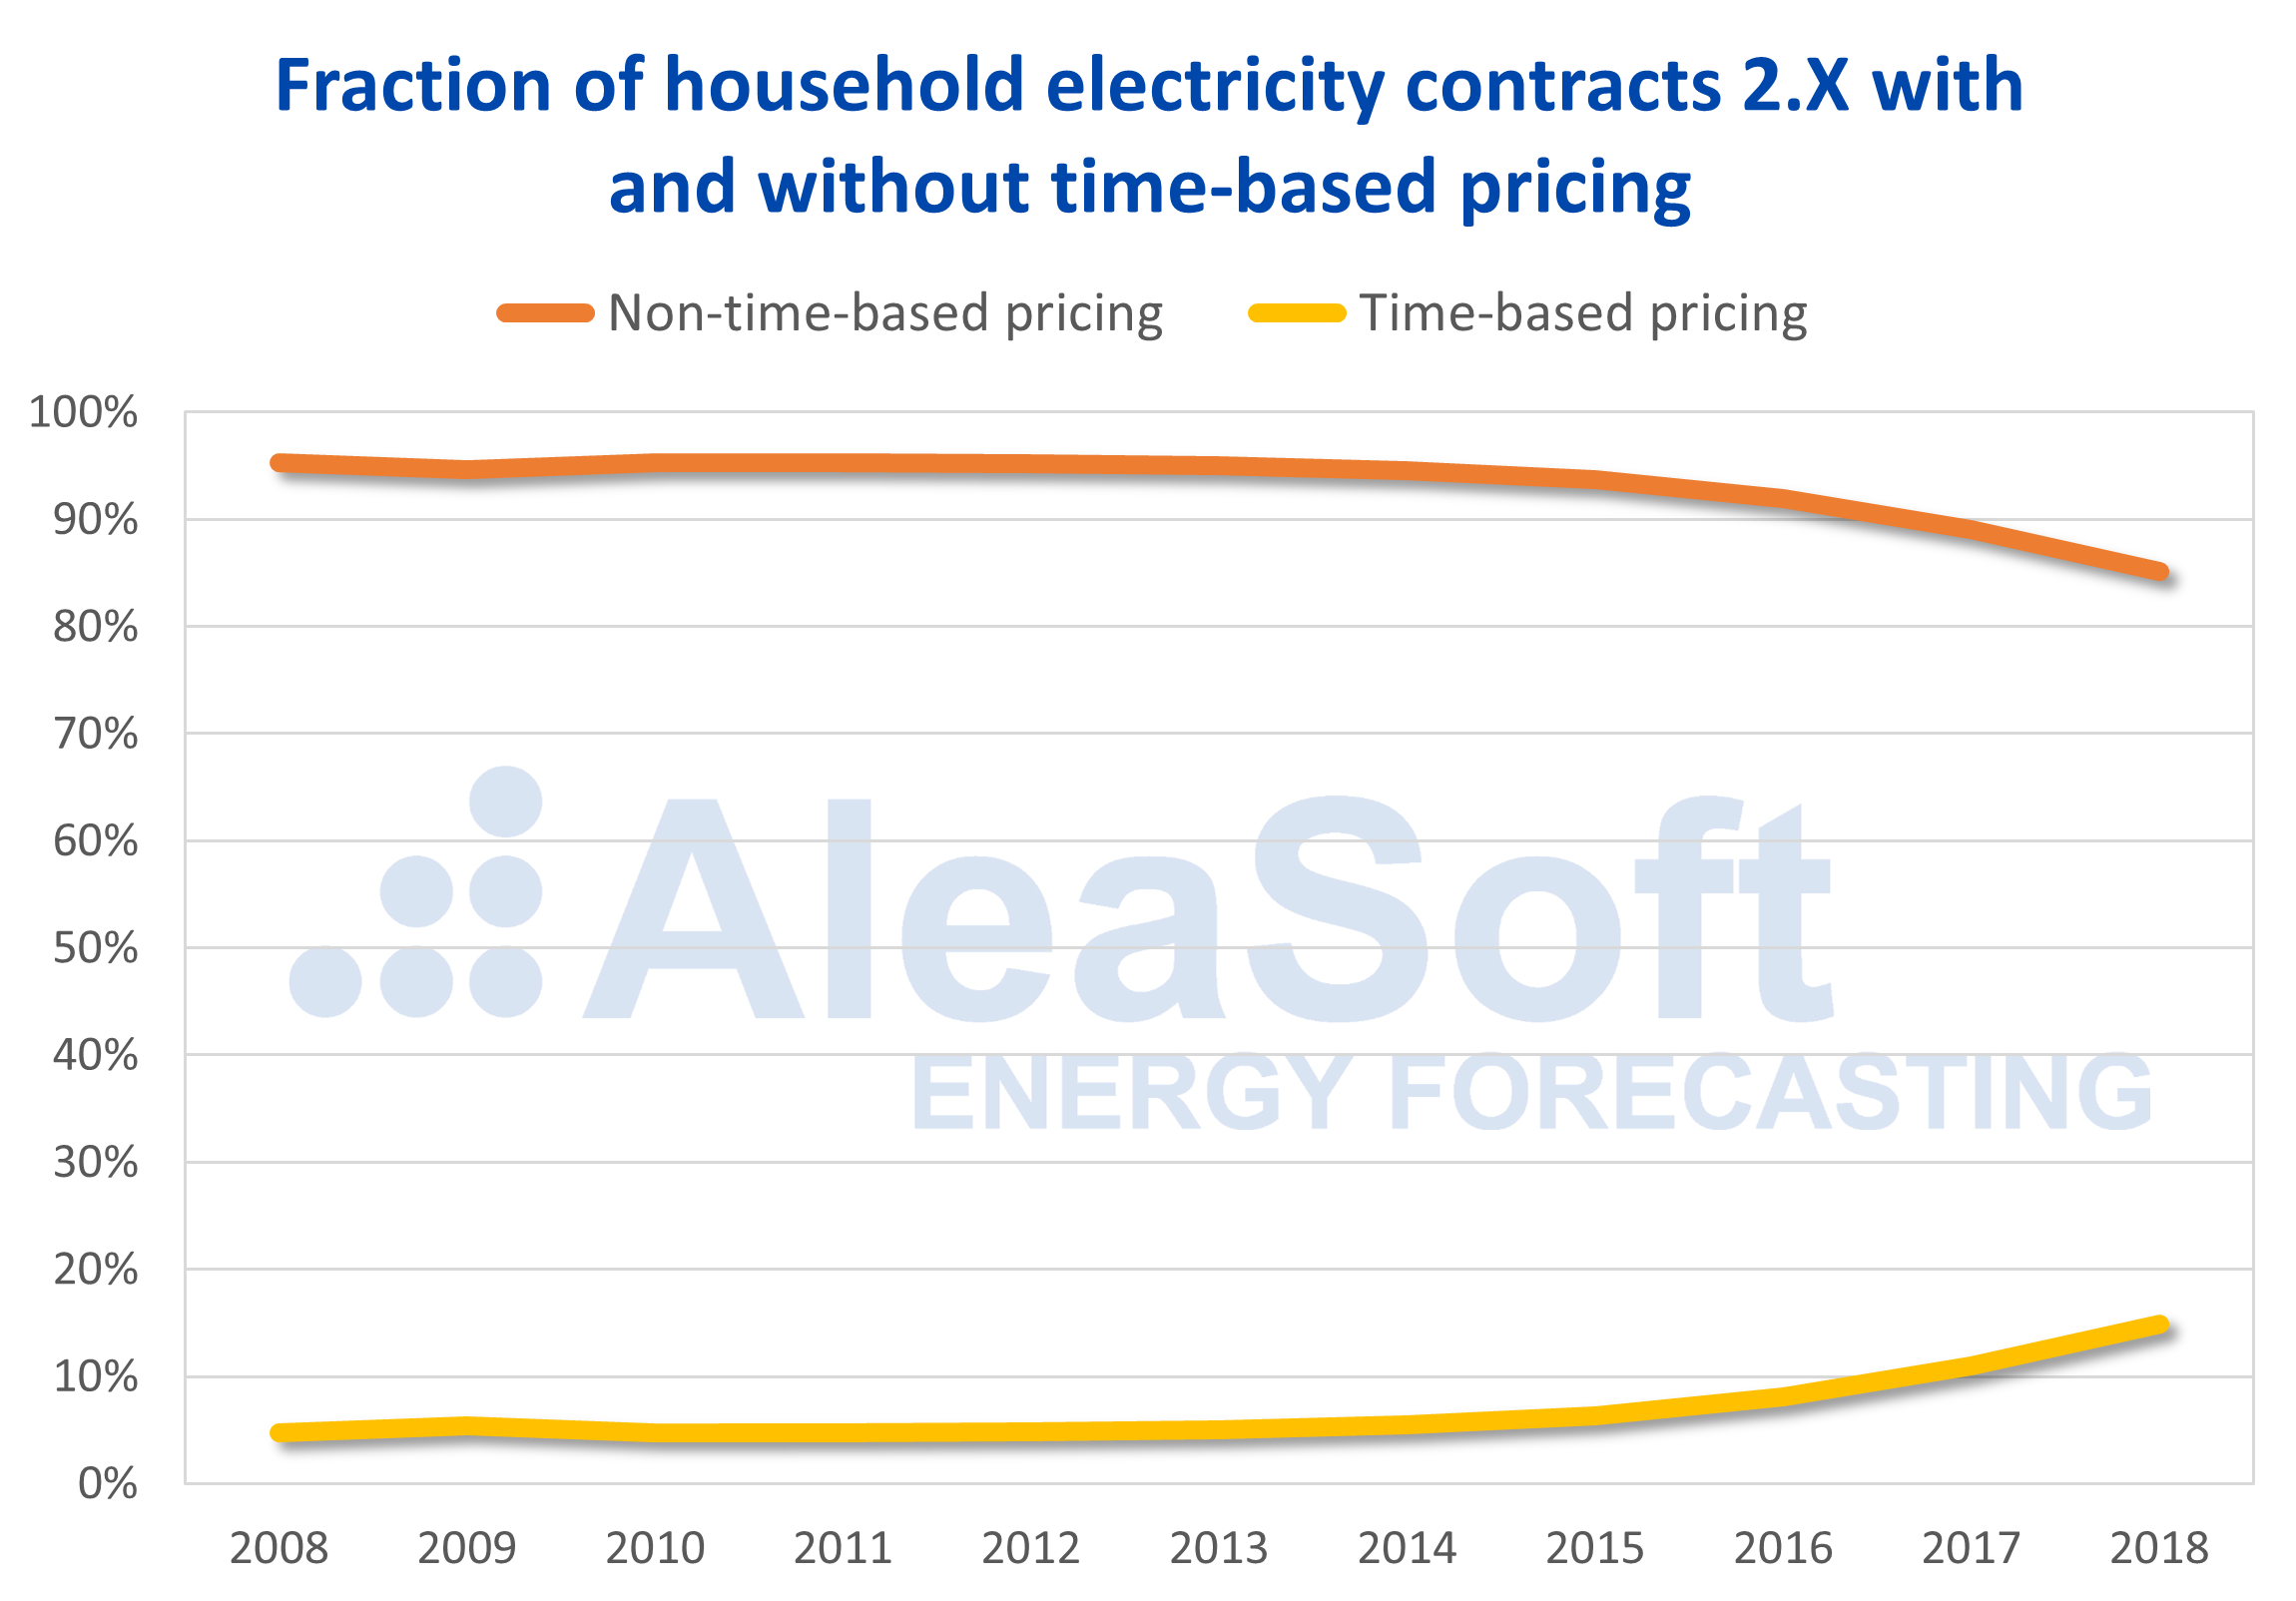
Sources: CNMC data analysed by AleaSoft.
Seasonality of electricity demand patterns
The hourly curve of electricity demand is determined by the labour, commercial and school activity that are what determine to a great extent the use that is made of electricity. The clear difference between the night, a valley with less demand, and the day, at least a peak demand, is maintained throughout the year. But the behaviour during the hours outside the valley has certain characteristics depending on the time of year. During the winter months, there are two peaks during the day: one with the maximum between 10:00 and 12:00, and another one in the evening a little higher with the maximum between 19:00 and 21:00. These peaks coincide with the hours of the beginning of the work and school day, and with the time of returning home and dinner. In contrast, during the summer, the peak of the morning is delayed between 12:00 and 14:00, coinciding with the hottest hours during the workday, and the peak of the afternoon practically disappears.
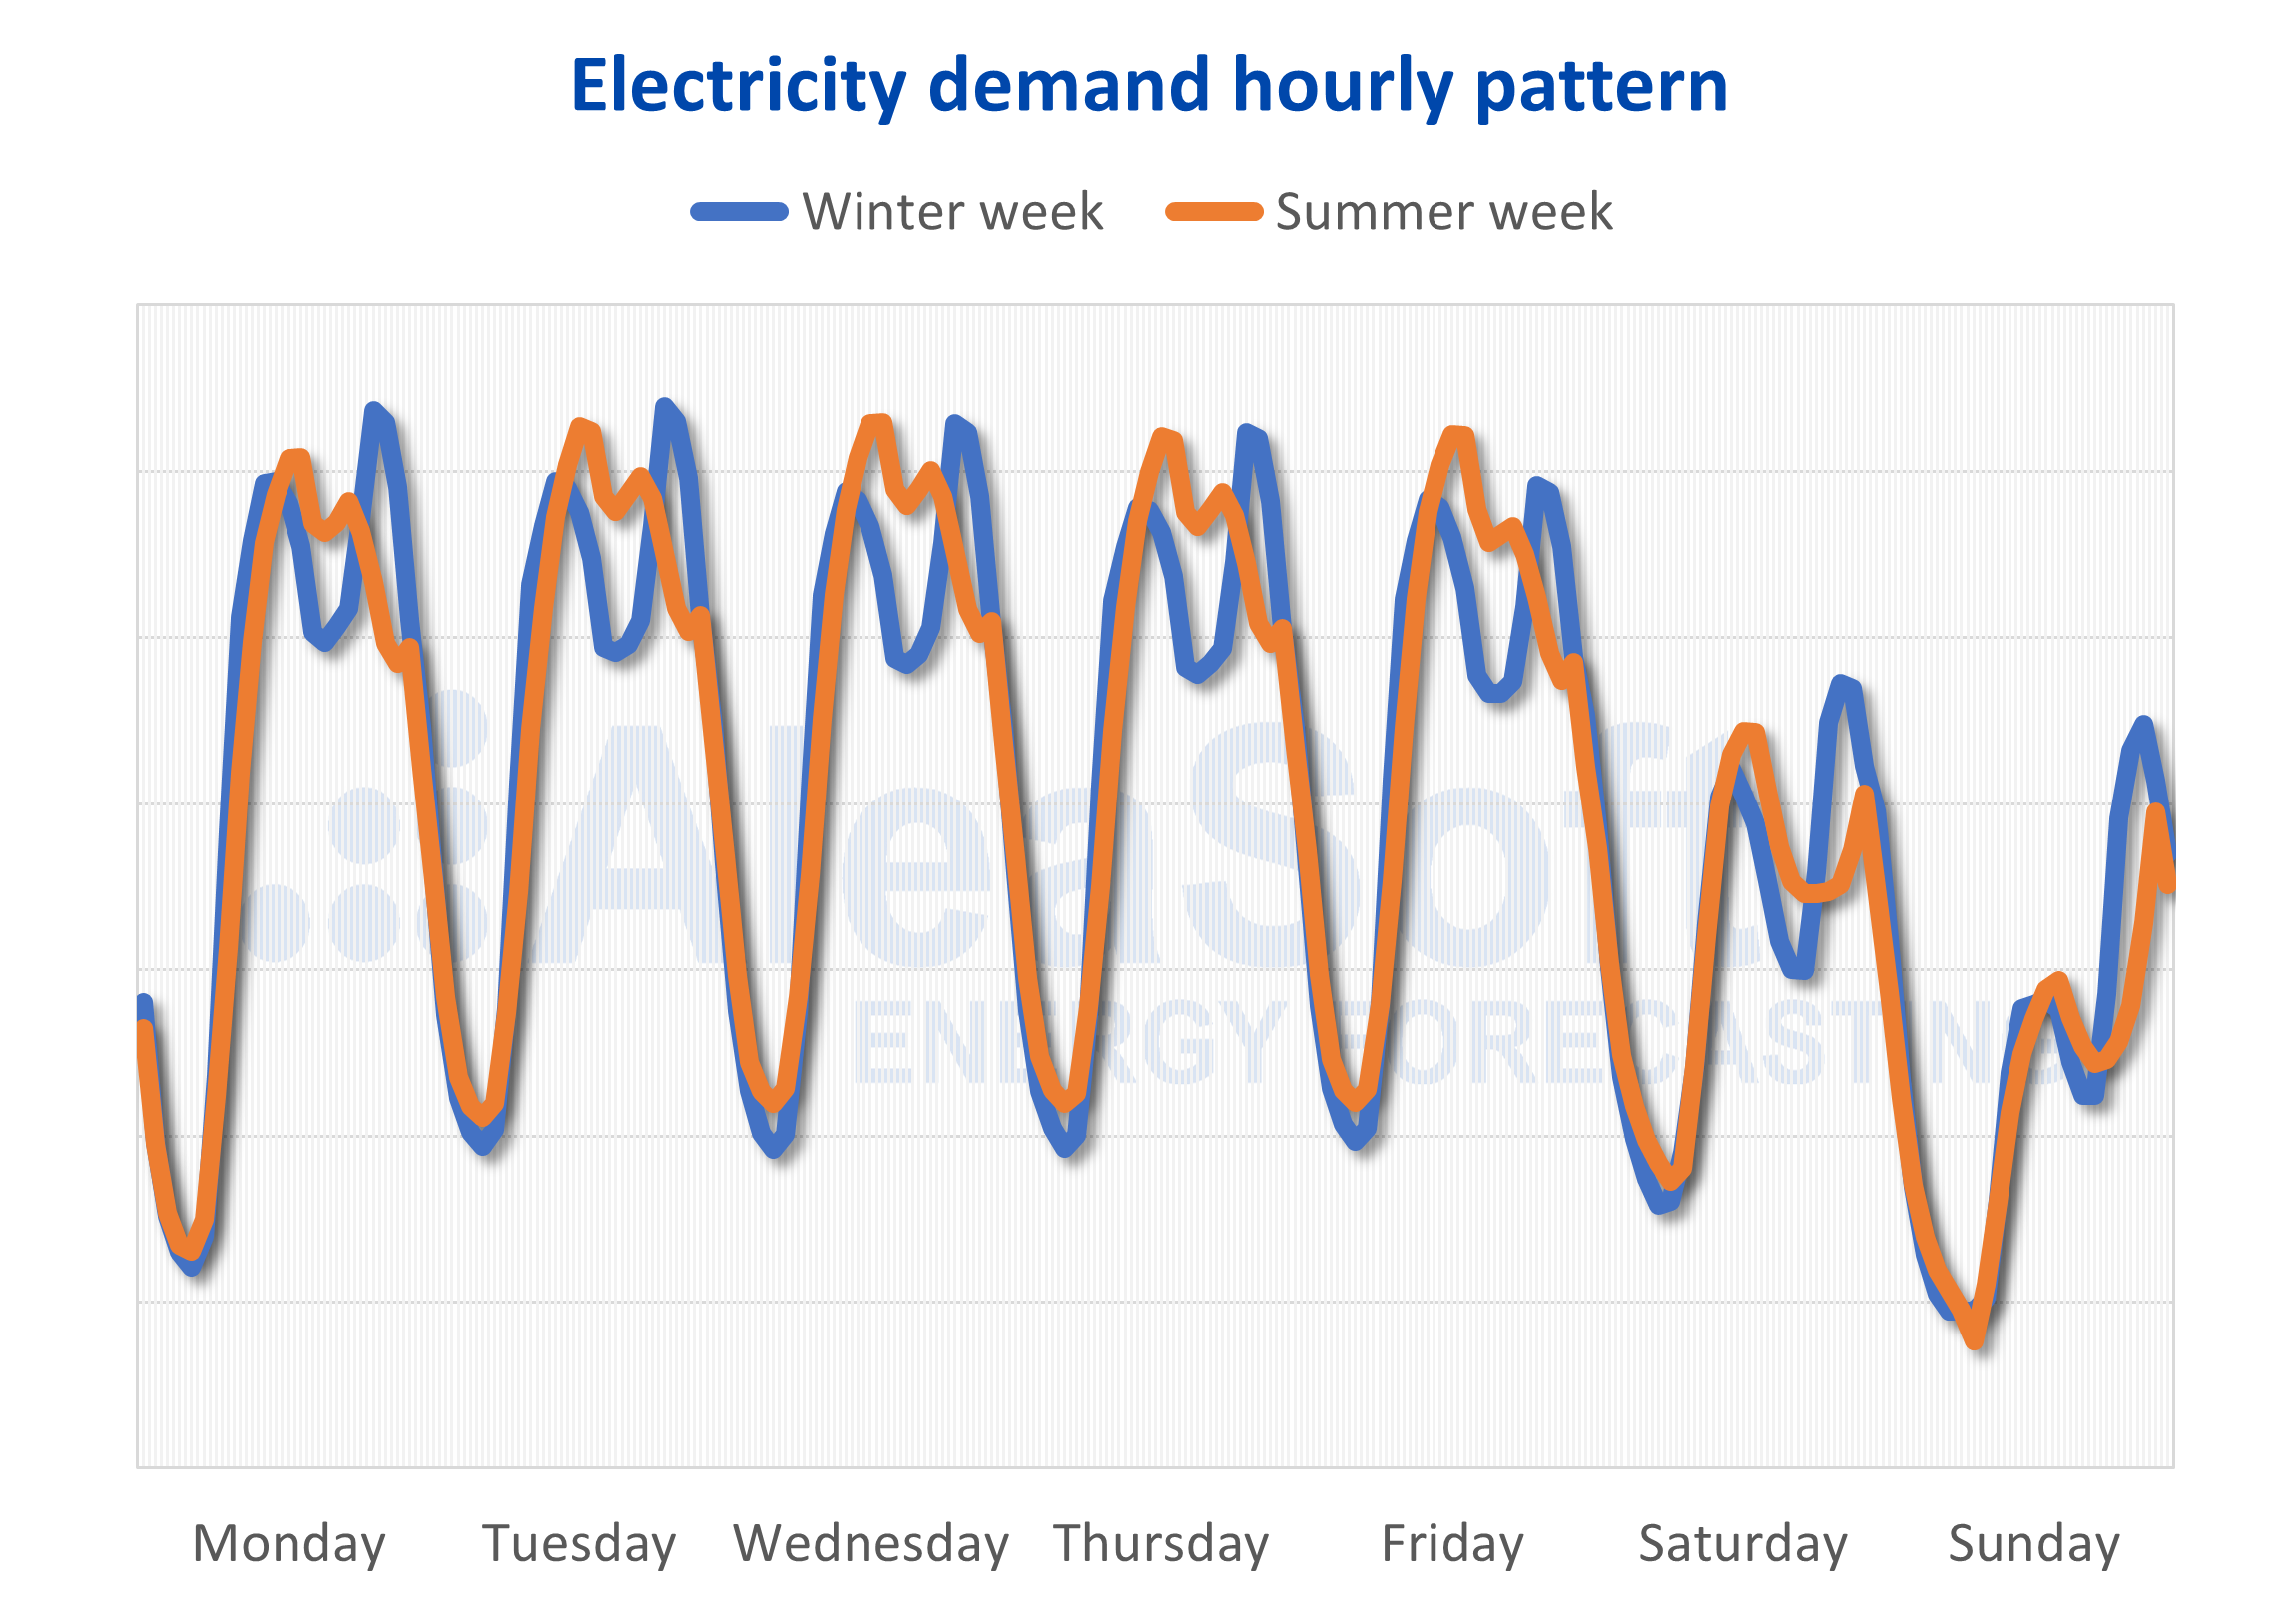
Sources: REE data analysed by AleaSoft.
Outlook of the evolution of the electricity demand
Looking ahead, the trend is to increase energy efficiency, which will mean a reduction in energy intensity, although the volume of demand continues to grow. The demand for electricity faces major challenges in the coming years, among which the massive adoption of the electric vehicle, the increase of self-consumption facilities and the increase in the storage capacity of electricity with batteries and hydrogen stand out.
In addition to efficiency, demand flexibility will also increase. This flexibility, apart from optimizing the cost of electricity, will also become increasingly necessary to cope with the increase in renewable production, most of which, wind and photovoltaic, will be unmanageable. A very important step in this direction will be the integration into the electricity system of the figure of the demand aggregator, already present in several countries in Europe, which will allow the balance between consumption and production to be adjusted also from the demand side.
And finally, the flattening of the demand curve will lead to a flattening of the electricity market price curve, as shown in the AleaSoft analysis of the evolution of electricity market prices.