AleaSoft Energy Forecasting, August 3, 2023. In July, 2023, prices in most European electricity markets fell to their lowest levels since at least June, 2021. Drop in gas prices, which are also the lowest on average since June, 2021, and drop in electricity demand, together with higher solar or wind energy production, contributed to these drops. Spain, Italy, France and Portugal registered their highest ever monthly photovoltaic energy production.
Solar photovoltaic and thermoelectric energy production and wind energy production
In July, 2023, solar energy production increased in most markets analyzed at AleaSoft Energy Forecasting compared to the same month in the previous year. The most notable increases were registered in the Iberian Peninsula, 42% and 31% in the Portuguese and Spanish markets, respectively. The lowest increases were observed in the Italian market, which was 6.9%, and in the French market, which was 4.9%. By contrast, solar energy production in the German market decreased by 3.7% compared to July in the previous year.
Compared to June, 2023, solar energy production increased in July in the south of Europe. It increased by 17% in both Spain and Portugal, and by 6.9% in Italy. The opposite trend was observed in Germany and France where solar energy production decreased by 16% and 2.8%, respectively.
In July, 2023, solar photovoltaic energy production reached the highest monthly value in history in four of the markets analyzed at AleaSoft Energy Forecasting: Spain, Italy, France and Portugal. The highest production among these four markets was 4431 GWh, registered in the Spanish market, followed by 3067 GWh generated in the Italian market. In the same period, France and Portugal produced with this technology 2702 GWh and 434 GWh, respectively.
Furthermore, according to data of REN, the Portuguese electricity system operator, in July, 2023, Portugal increased 6 MW the solar photovoltaic power compared to the installed capacity at the end of June.
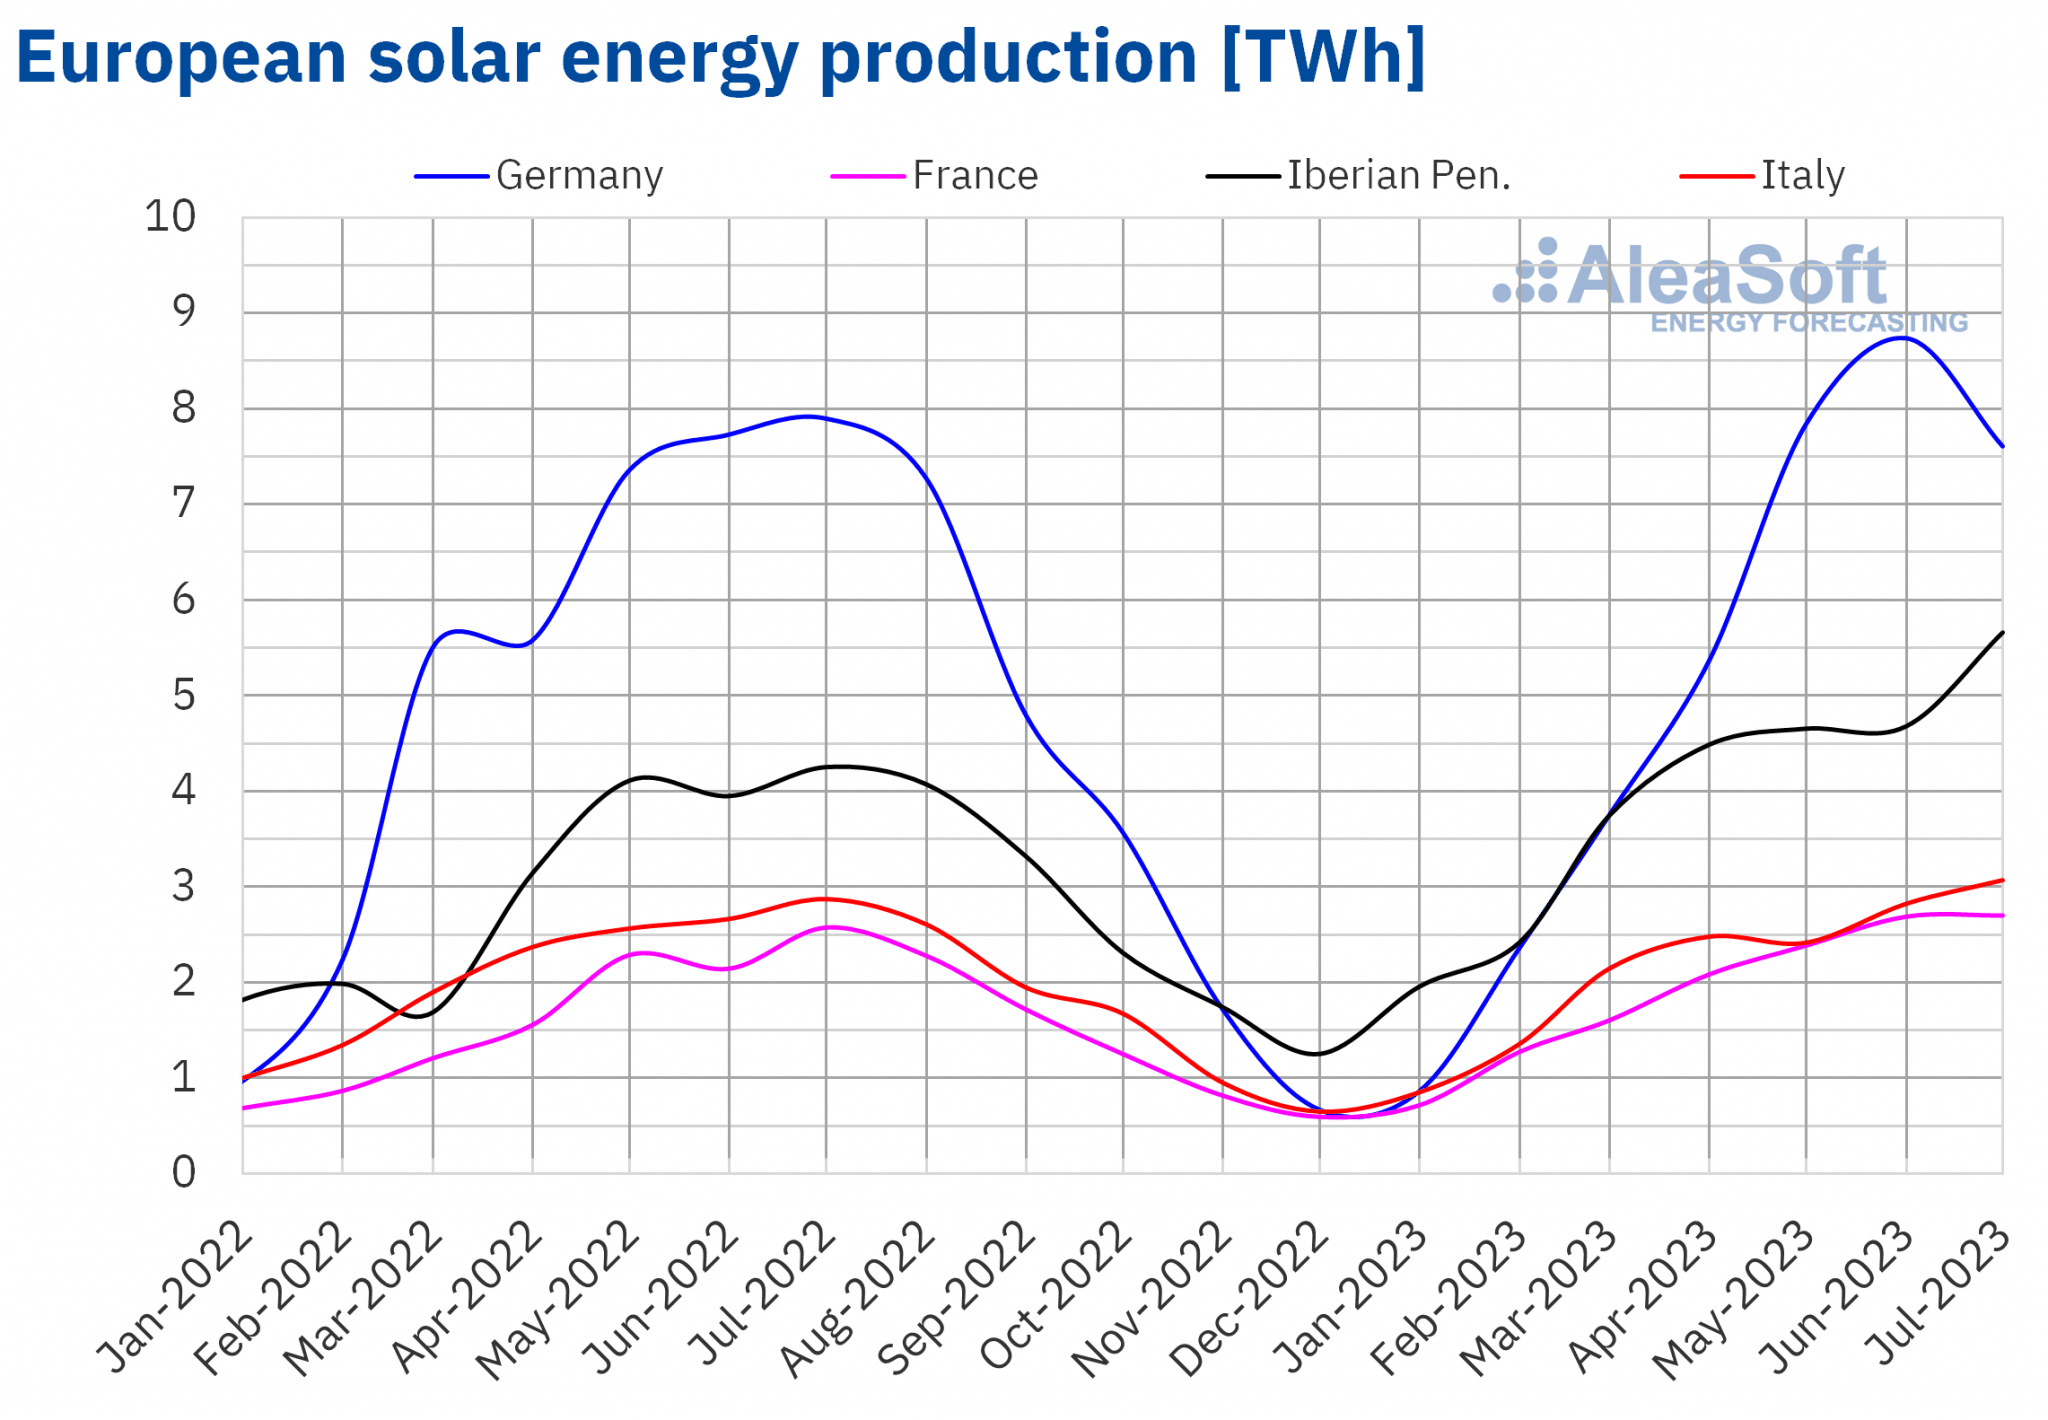 Source: Prepared by AleaSoft Energy Forecasting using data from ENTSO-E, RTE, REN, REE and TERNA.
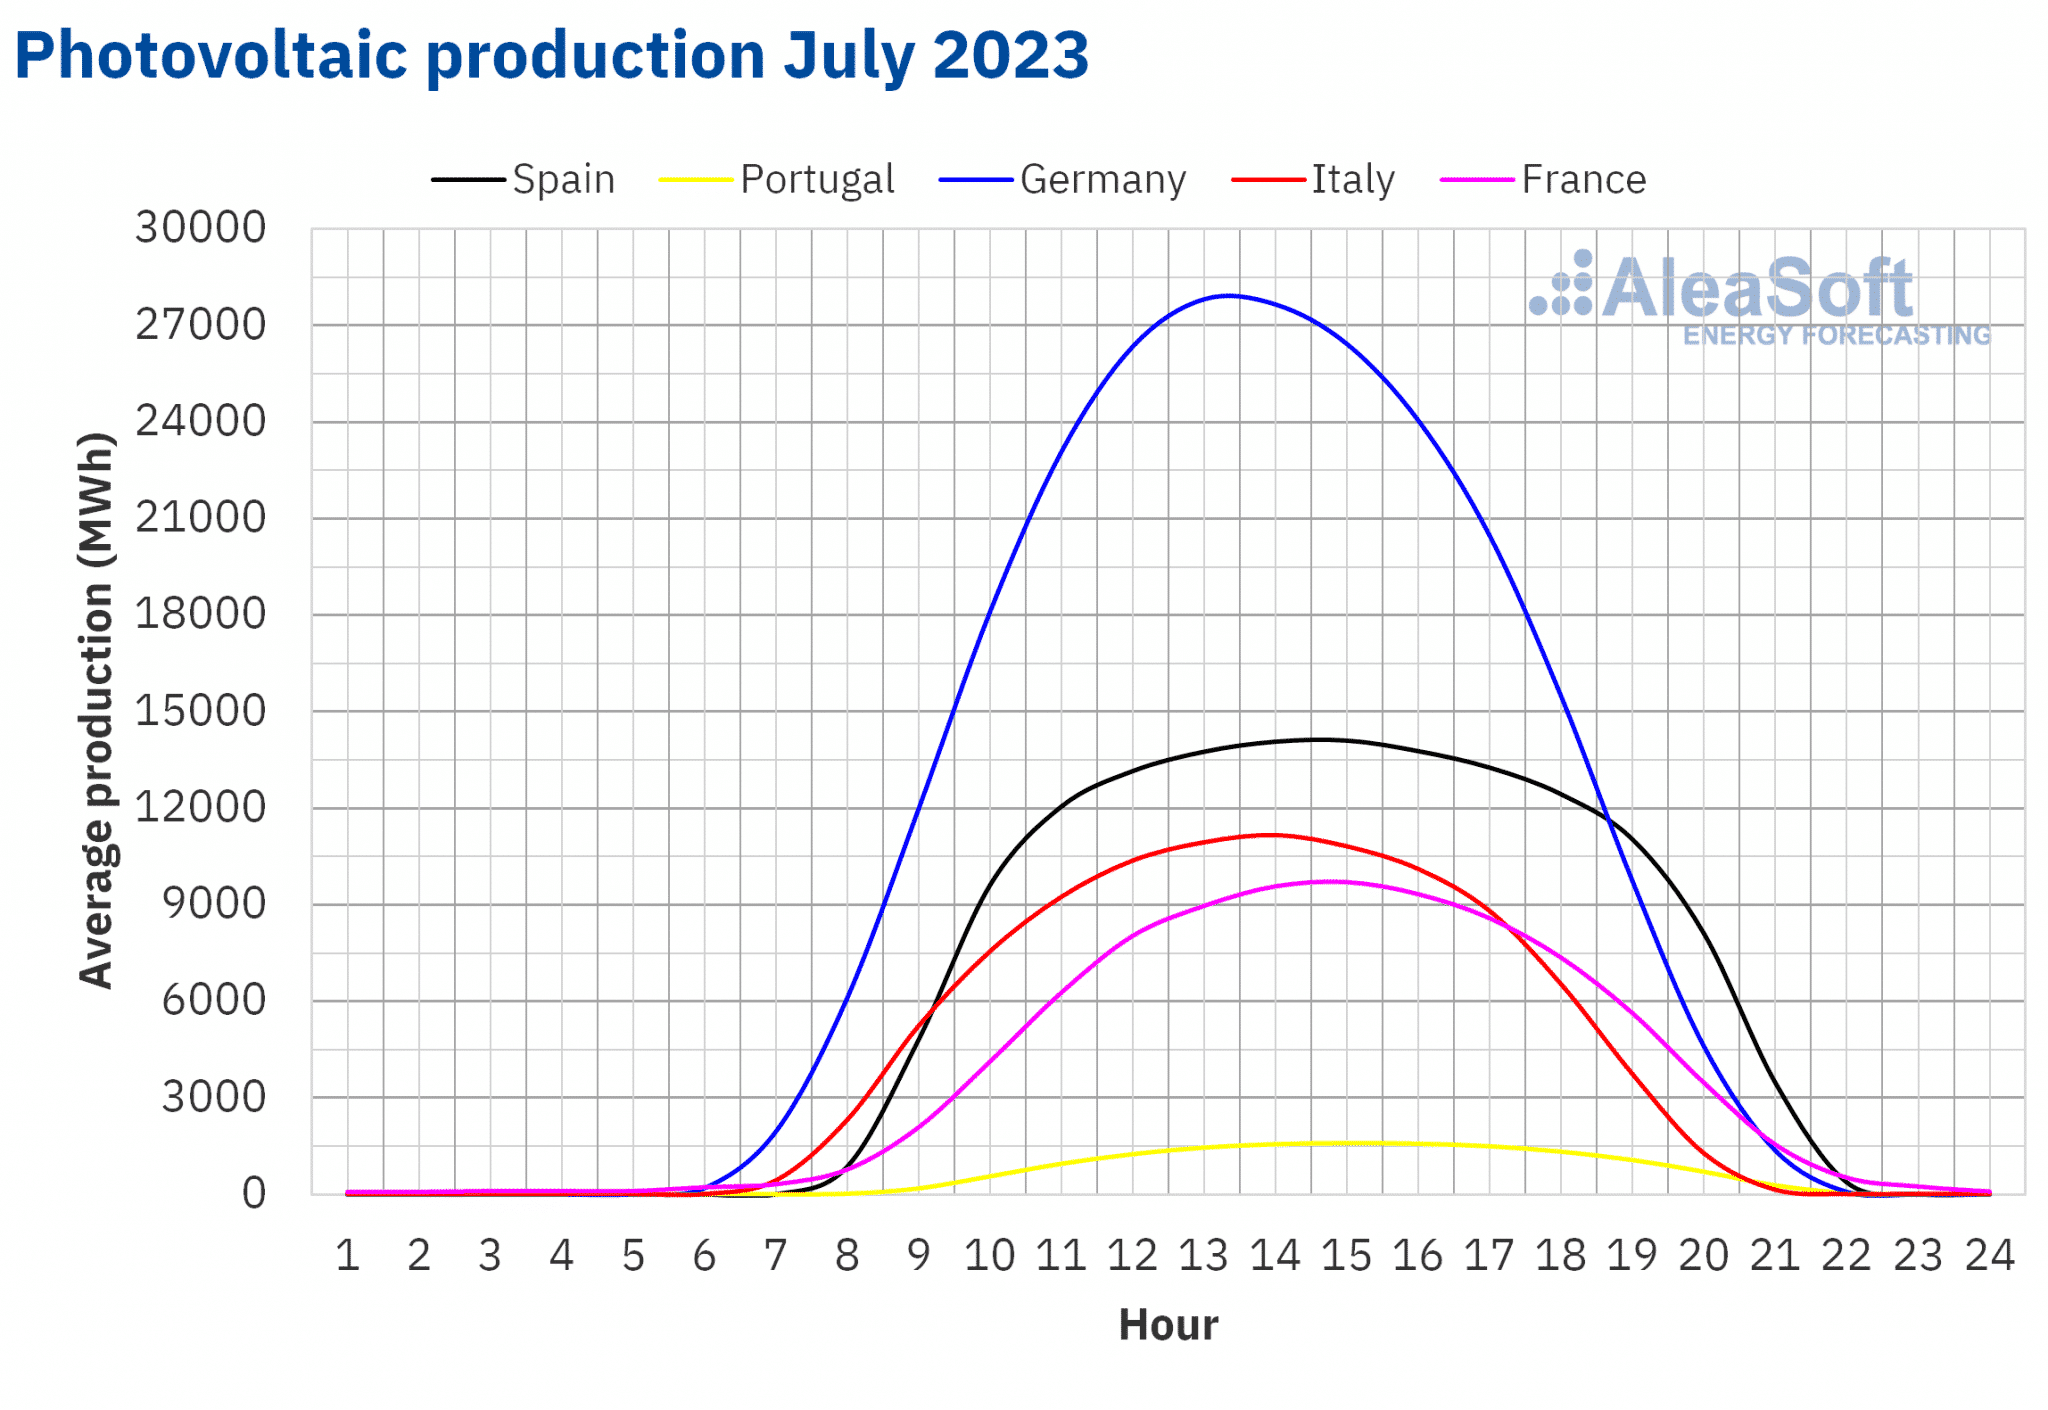 Source: Prepared by AleaSoft Energy Forecasting using data from ENTSO-E, RTE, REN, REE and TERNA.
Regarding wind energy production, a year-on-year rise was registered in July, 2023, in almost all the markets analyzed at AleaSoft Energy Forecasting. The highest increase, which was 67%, was observed in the French market, which was followed by the German, Italian and Portuguese markets that increased 39%, 32% and 26%, respectively. However, the Spanish market registered a 15% fall in wind energy production compared to the one registered in July, 2022.
In comparison with the previous month, in July, 2023, wind energy production increased in all markets analyzed at AleaSoft Energy Forecasting, with increases between 19% in the Spanish market and 58% in the German market.
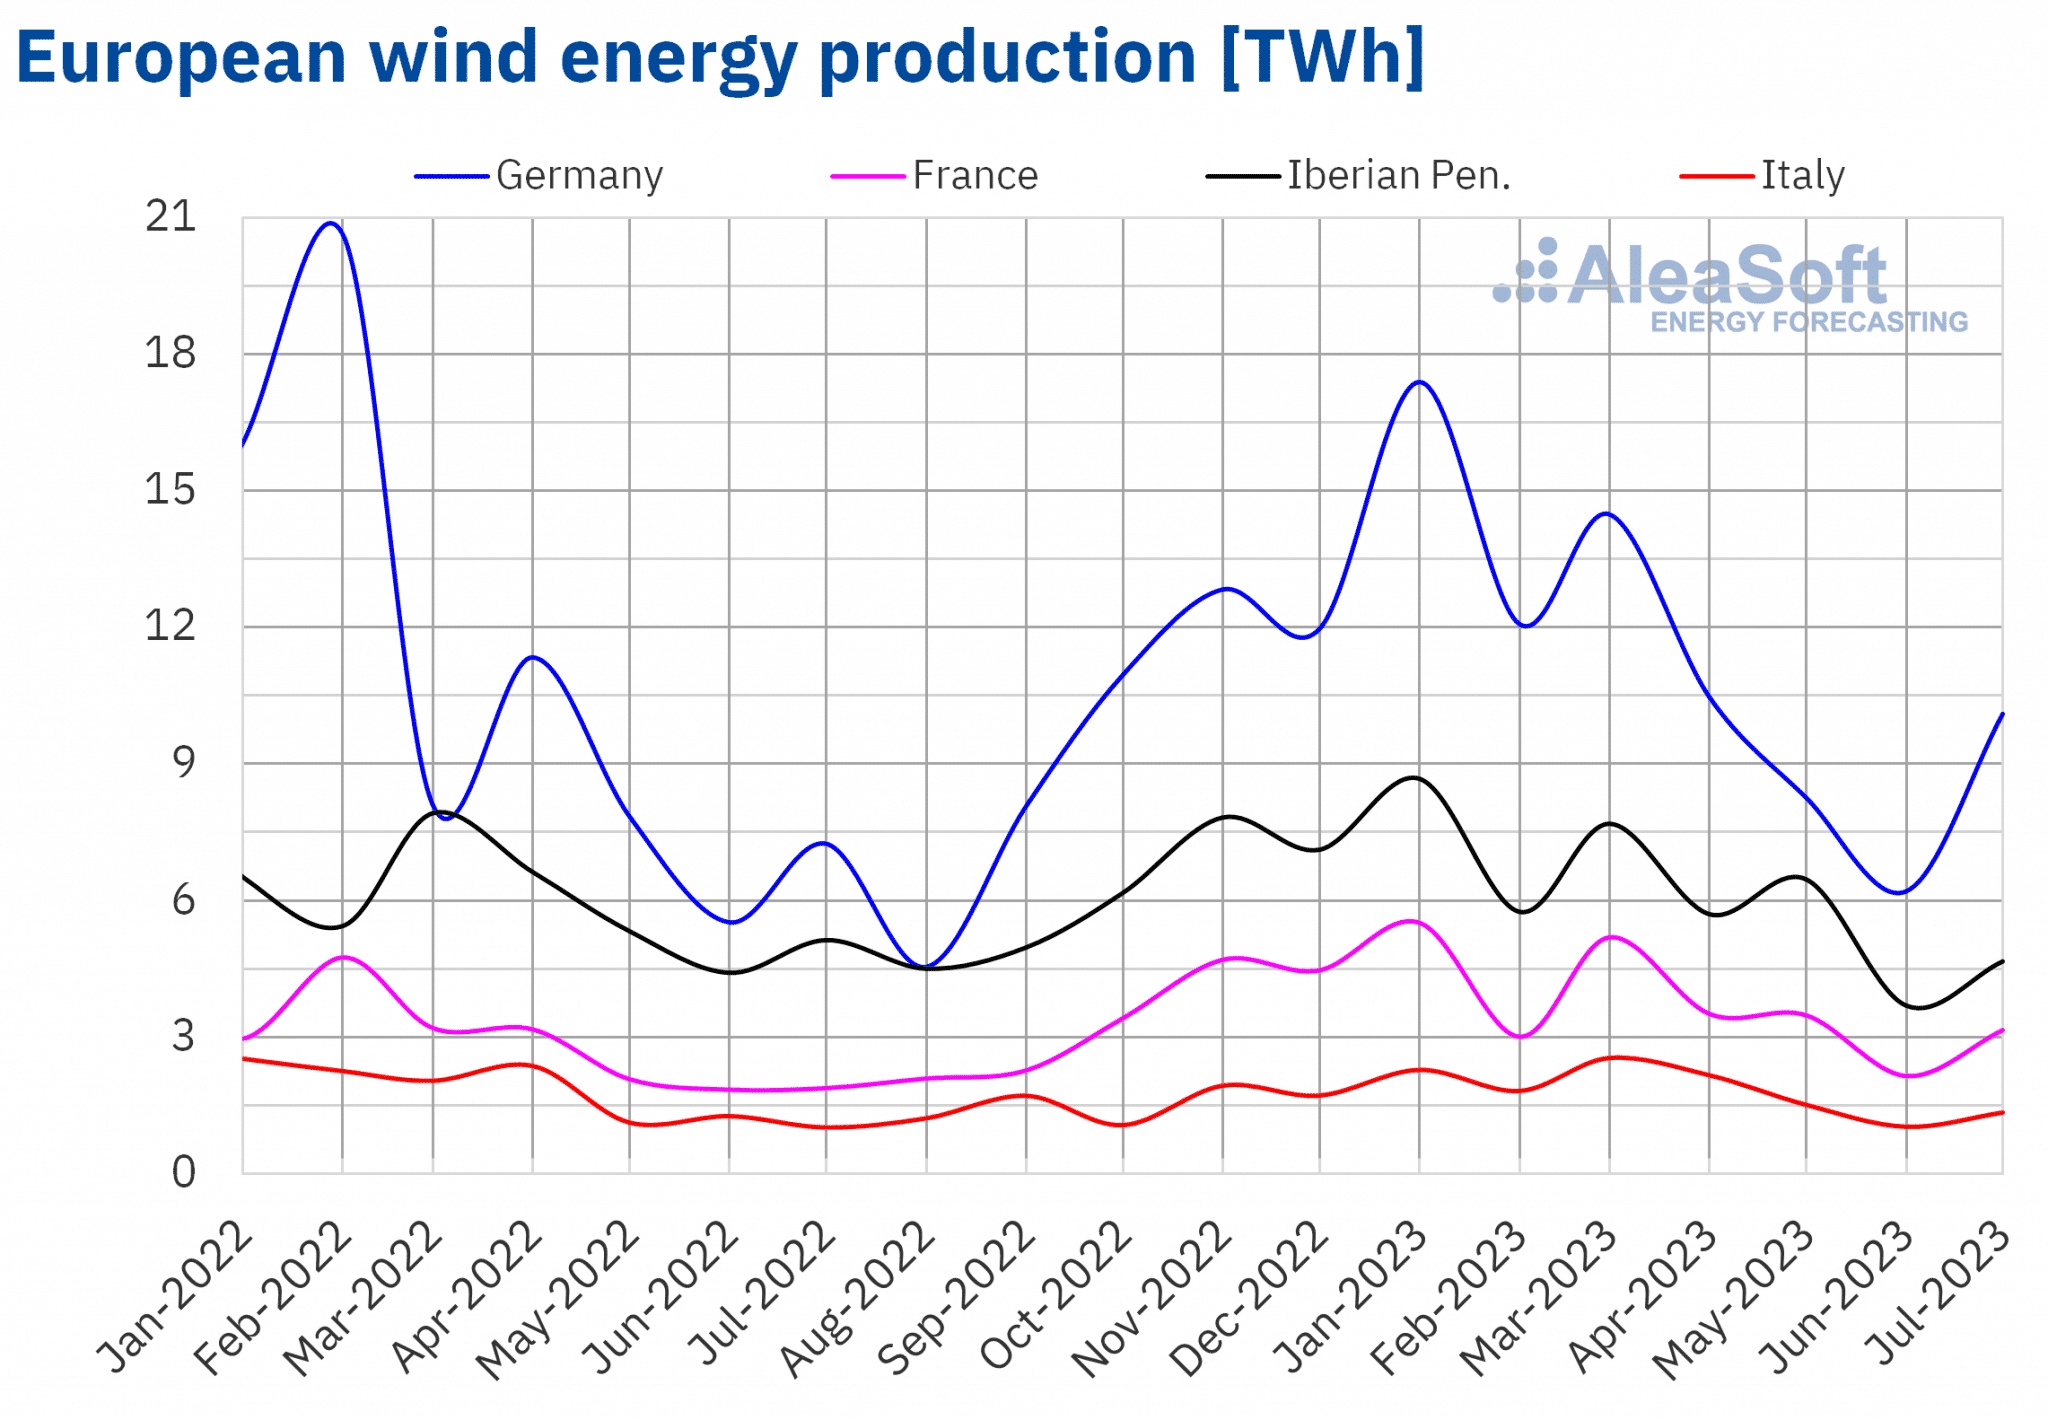 Source: Prepared by AleaSoft Energy Forecasting using data from ENTSO-E, RTE, REN, REE and TERNA.
Electricity demand
Throughout July, 2023, year-on-year declines in electricity demand were registered in all European markets analyzed. The highest drops were 9.7% and 9.6%, registered in the Belgian and German markets, followed by the 9.1% decrease in the Dutch market. In the rest of markets, electricity demand fell between 3.5% in the Italian market and 6.2% in the market of Great Britain.
Compared to the previous month, the highest fall in electricity demand, which was 8.5%, was also registered in Belgium. The same trend was observed in the German market, with a 4.1% fall and in Great Britain, where the demand decreased by 2.5%. Instead, in the south of Europe and Netherlands the electricity demand increased between 1.2% in France and 14% in Italy. The Spanish market observed the second highest increase, which was 11%.
Increases in electricity demand in the south of Europe in July, compared to the previous month, are related with the generalized rise in average temperatures. In both Italy and Spain, the average temperature rose more than 2.5°C yielding the notable increases in demand.
Compared to the same month of the previous year, in July, 2023, average temperatures were lower, with falls between 0.1°C in Netherlands and 2.1°C in Great Britain, keeping the opposite relation between average temperature and electricity demand.
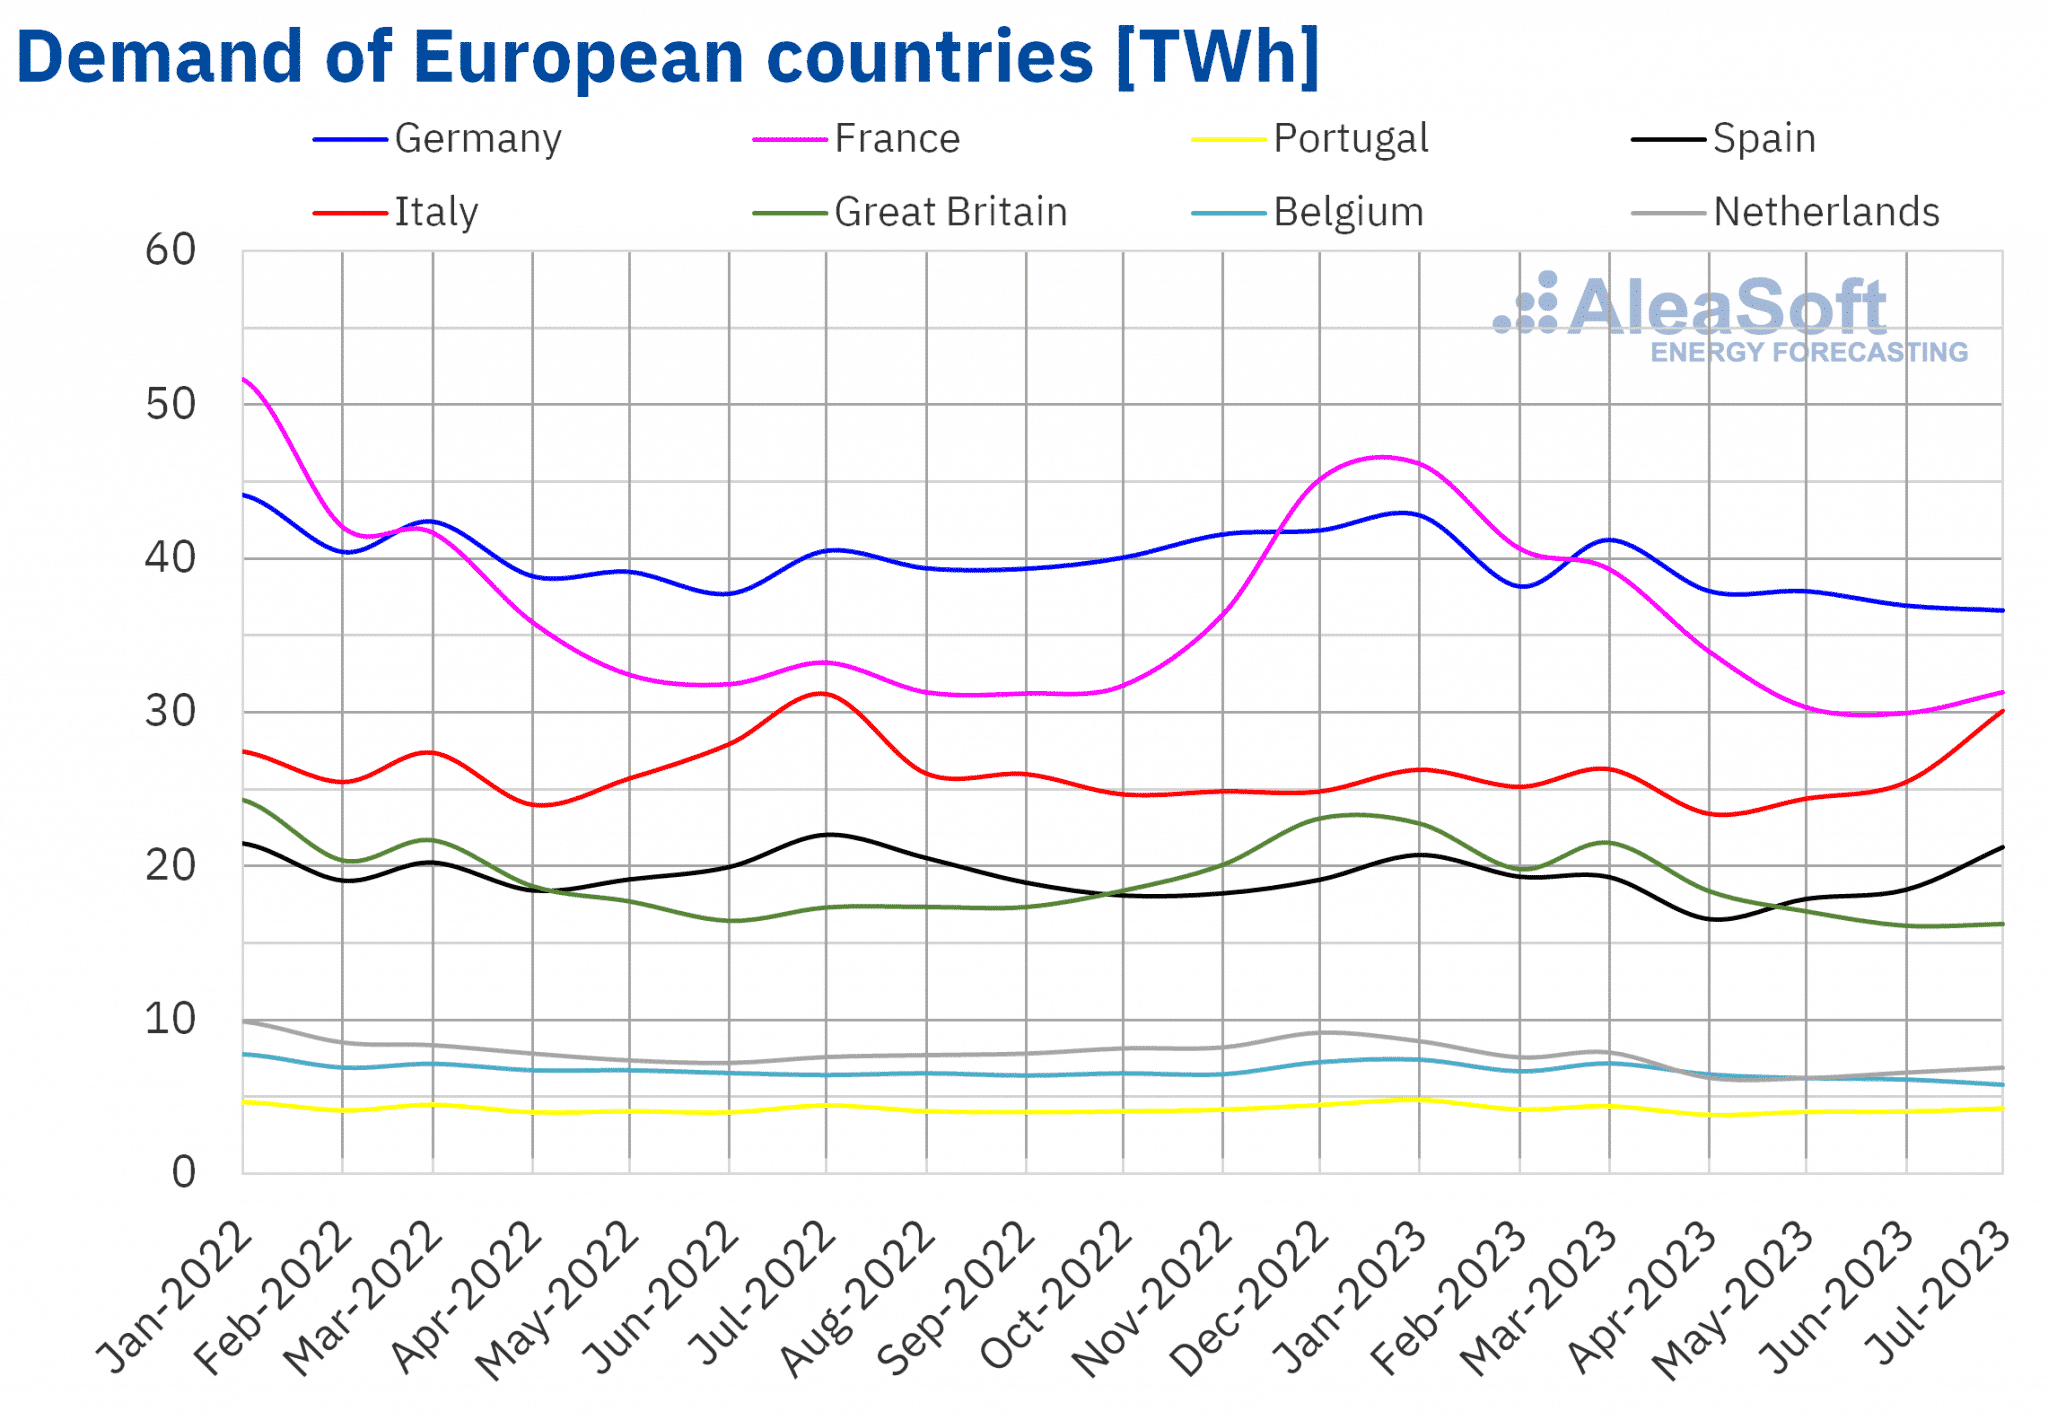 Source: Prepared by AleaSoft Energy Forecasting using data from ENTSO-E, RTE, REN, REE, TERNA, National Grid and ELIA.
European electricity markets
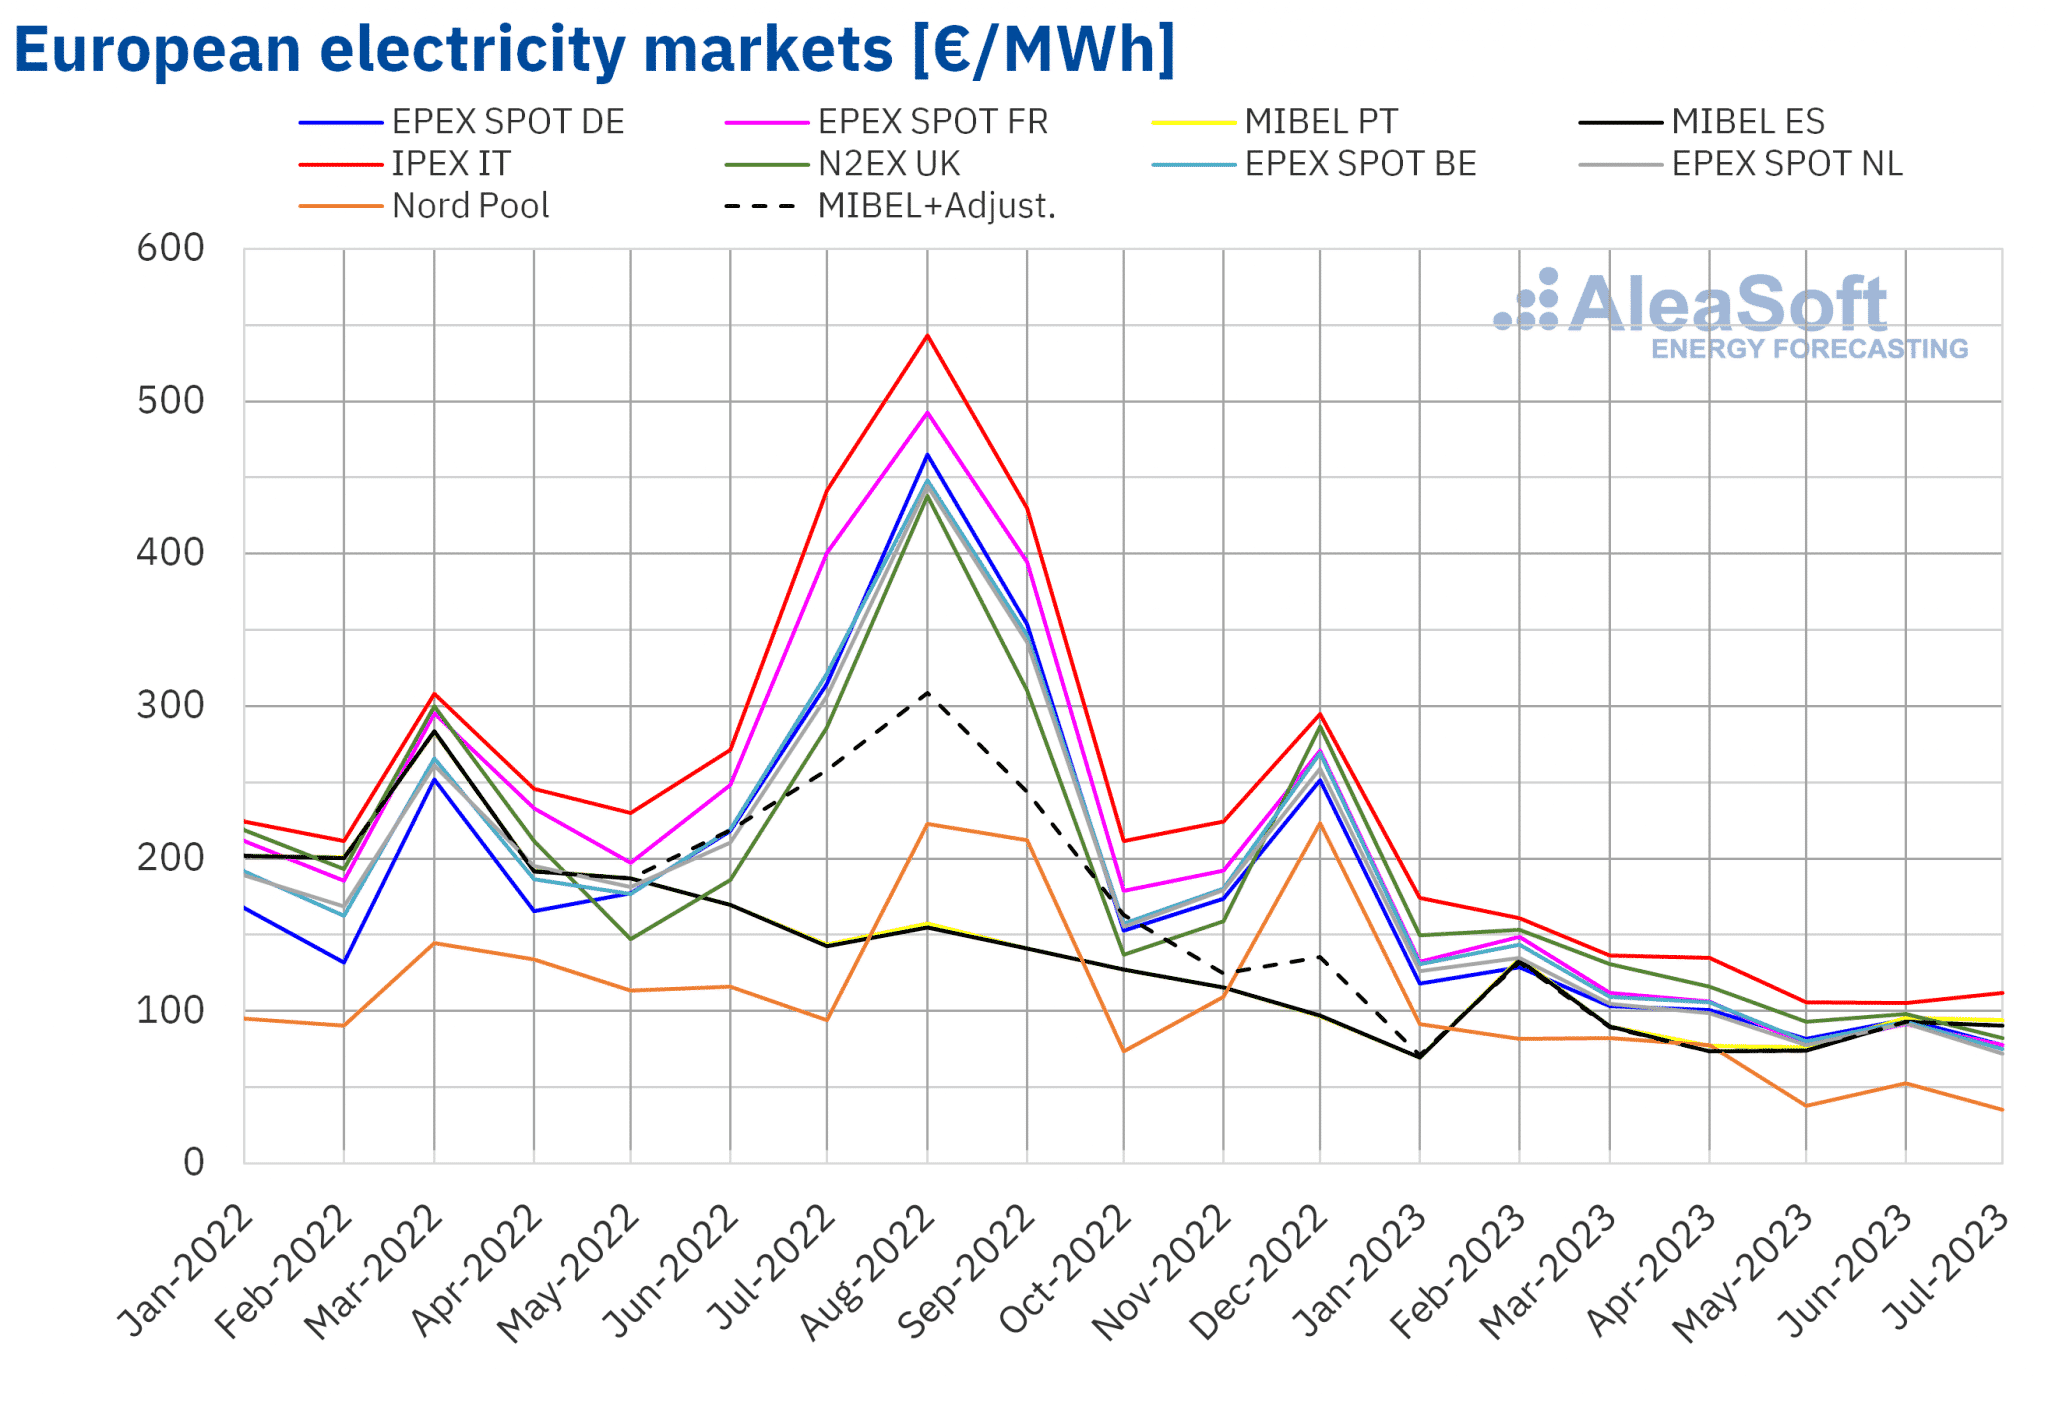
In July, 2023, the monthly average price was below €95/MWh in almost all European electricity markets analyzed at AleaSoft Energy Forecasting. The exception was the IPEX market of Italy, averaging €112.09/MWh. In addition, the lowest monthly price, which was €35.10/MWh, was registered in the Nord Pool market of the Nordic countries. In the rest of the markets, averages were between €71.79/MWh in the EPEX SPOT market of Netherlands and €93.80/MWh in the MIBEL market of Portugal.
Compared to June, in July, average prices decreased in almost all European electricity markets analyzed at AleaSoft Energy Forecasting. The exception was the Italian market, increasing 6.4%. Furthermore, the largest drop, which was 33%, was reached in the Nordic market, whereas in the MIBEL market of Portugal and Spain the lowest decreases were registered, which were 1.9% and 2.7%, respectively. The rest of the markets registered decreases in prices between 15% in the French market and 22% in the Dutch market.
Comparing average prices of July with the ones registered in the same month of 2022, prices fell in all analyzed markets. In this case, the largest drop was in the French market, which was 81%. In the rest of the markets, the decreases were between 35% in the Portuguese market and 77% in the Belgian and Dutch markets.
As a consequence of the decreases in registered prices, the average in July was the lowest since at least June, 2021, in most of the analyzed markets. In the case of the Nordic market, it reached the lowest monthly price since March, 2021. In the N2EX market of the UK, July’s price was the lowest since April, 2021, whereas in Netherlands it was the lowest since May of this year. In the case of Germany and Belgium, the lowest averages since June, 2021, were registered.
In July, 2023, the year-on-year decrease in prices of European electricity markets was favored by the fall in average price of gas and the generalized decrease in demand. Moreover, wind and solar energy production increased in almost all the markets analyzed. Besides, the decrease in average price of gas compared to the previous month, the generalized rise in wind energy production and the increase in solar energy production in most of the markets also contributed to the lowering of prices compared to June, despite of the increases in electricity demand registered in most of the markets analyzed.
 Source: Prepared by AleaSoft Energy Forecasting using data from OMIE, EPEX SPOT, Nord Pool and GME.
Brent, fuels and CO2
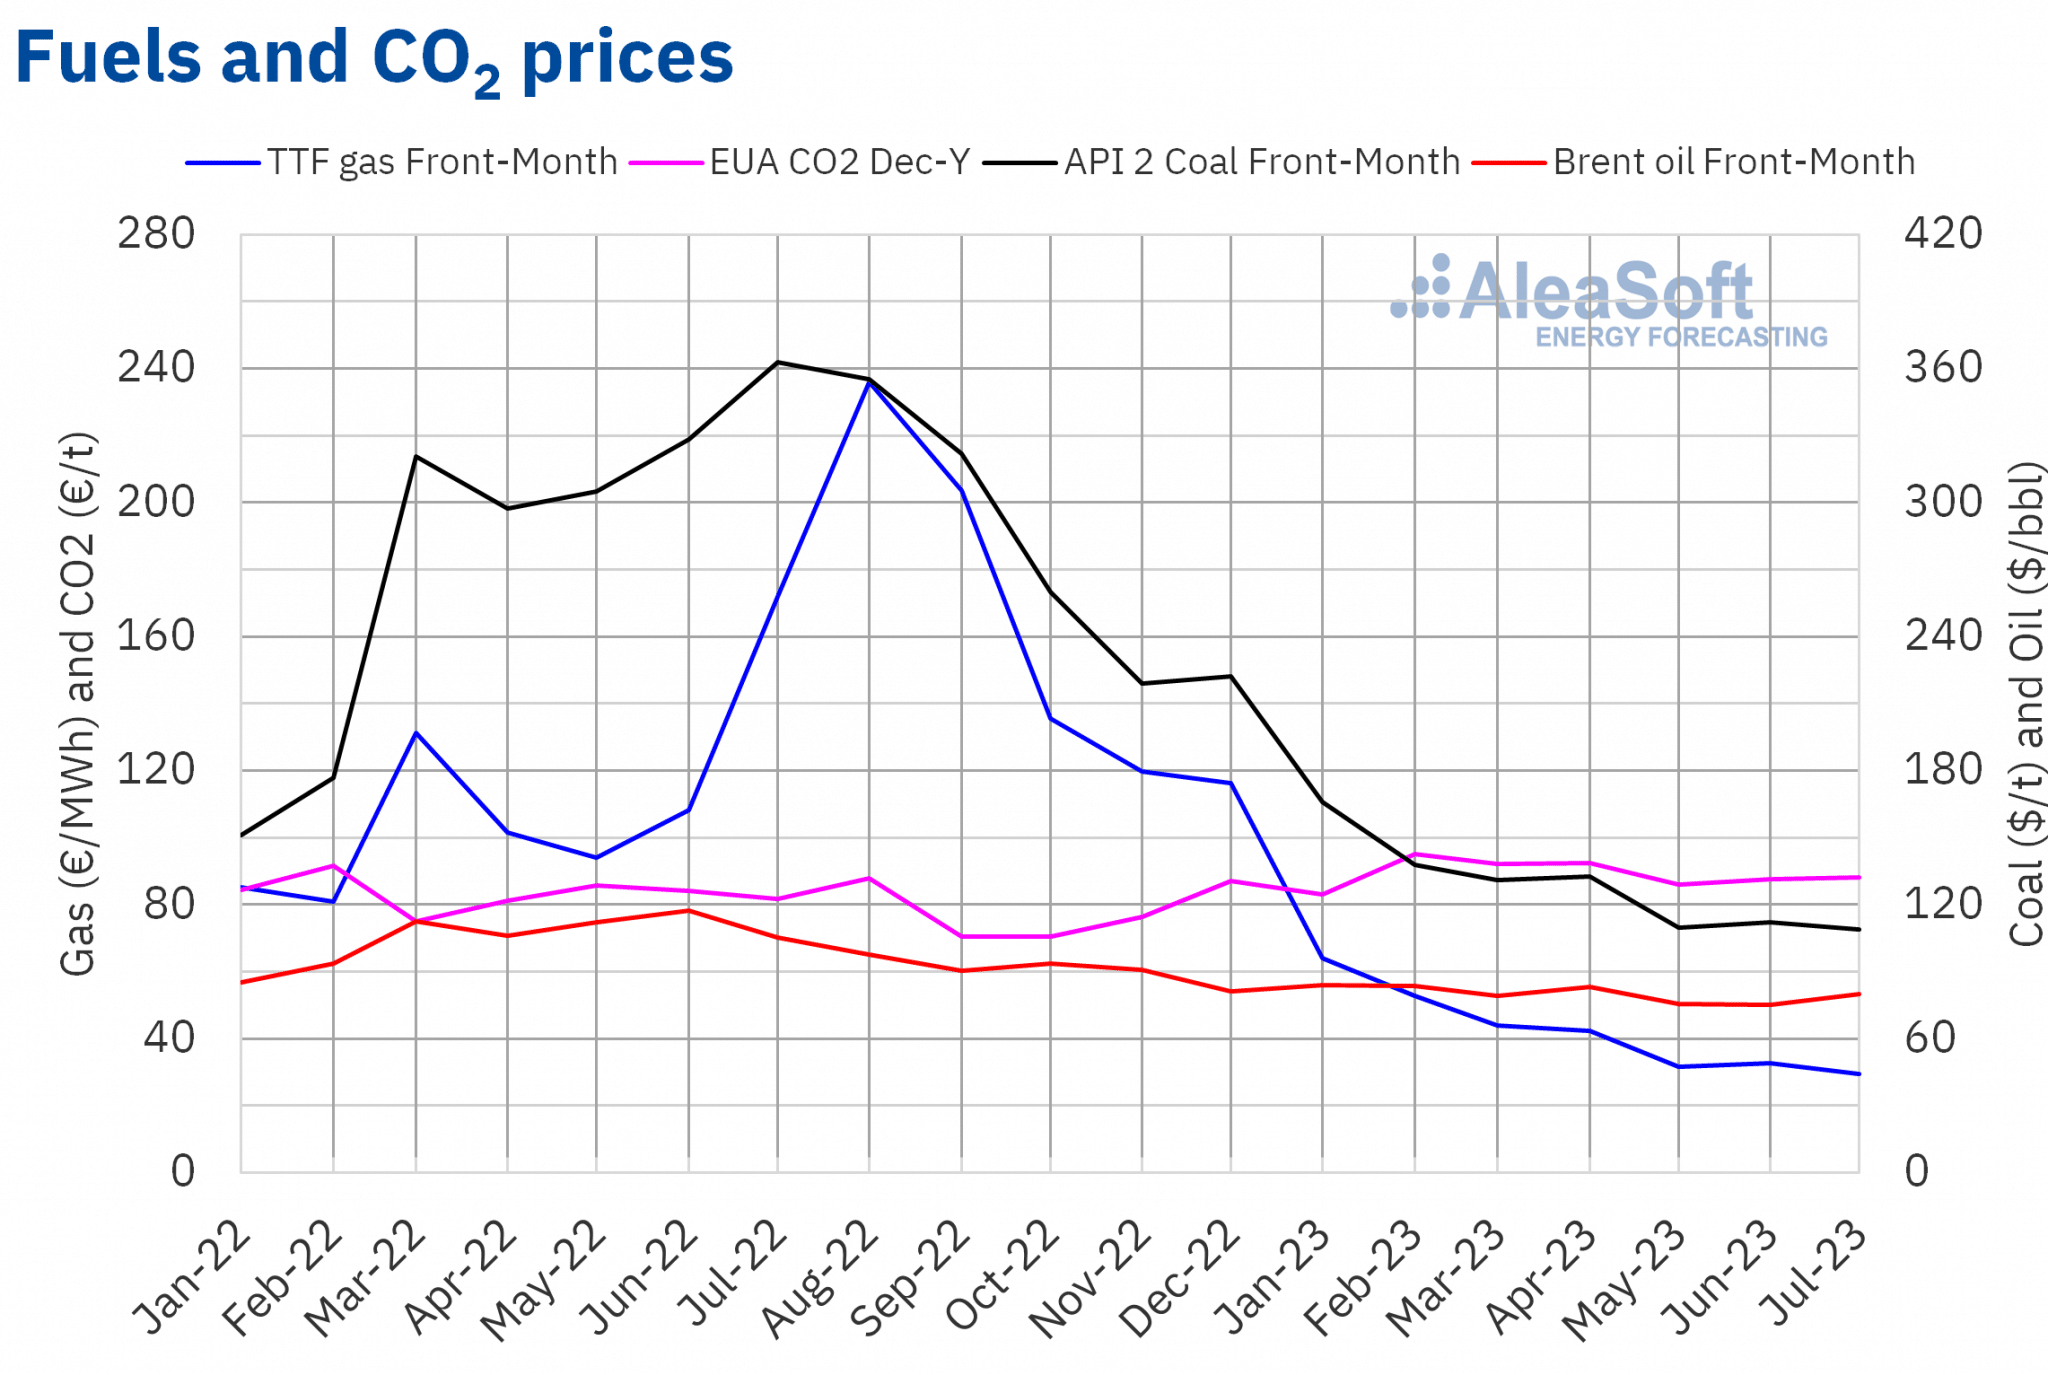
Brent oil futures for the Front‑Month in the ICE market registered $80.16/bbl in monthly average price in July. This value was 6.9% larger than the one reached by the Front‑Month futures of June, which was $74.98/bbl, but was 24% lower than the one corresponding to the Front‑Month futures negotiated in July, 2022, which was $105.12/bbl.
Throughout July, concerns continued due to the evolution of the world economy and the crude oil demand. In the month’s second week, the OPEC modified upward its demand forecasts for 2023, whereas the International Energy Agency modified them in the opposite way.
However, both production cuts scheduled as of July and supply disruptions from Libya and Nigeria in the second week of the month influenced prices upwards. The rise of tensions between Russia and Ukraine, the announcement of measures focused on boosting the Chinese economy and some positive economical data from the US and Europe also favored the increase in prices in the second half of the month. As a result, Brent crude oil futures prices registered a rising trend in July.
Regarding TTF gas futures in the ICE market for the Front‑Month, the average value registered over July was €29.48/MWh. Compared to the one corresponding to the Front‑Month futures negotiated in June, which was €32.58/MWh, the average fell 9.5%. If it is compared to the Front‑Month futures negotiated in July, 2022, when the average price was €171.96/MWh, there was an 83% decrease. In addition, the monthly average price of July, 2023, was the lowest since 2021.
In the beginning of July, the drop in supply from Norway due to maintenance tasks influenced TTF gas futures prices upwards, though subsequently, supply from this country rose again. The increase in demand for electricity generation due to high temperatures and the lowering of wind energy production also contributed the upward direction in the second half of July. In the Asian markets, demand also increased. As a consequence, part of the liquefied natural gas supply through the sea route was deviated to those markets. However, both high levels of the European reserves and the huge supply allowed the decrease in TTF gas futures average price over July.
Regarding CO2 emission rights futures in the EEX market for the reference contract of December, 2023, they reached €88.02/t in average price in July. This represents a 0.4% light increase compared to the previous month average, which was €87.65/t. Compared to July’s average of 2022 for the reference contract of December of that year, which was €81.72/t, July’s average of 2023 was 7.7% larger.
 Source: Prepared by AleaSoft Energy Forecasting using data from ICE and EEX.
AleaSoft Energy Forecasting’s analysis on the energy markets in Europe
For energy producers, retailers, data analysts, journalists specialized in the energy sector and all actors operating in the mentioned sector, it is important to be provided of updated data related with energy markets. For that purpose, the online platform Alea Energy DataBase has been developed at Aleasoft Energy Forecasting. This platform allows data display and analysis of energy markets. Alea Energy DataBase includes data from fuel markets as well as from the main European electricity markets. In the platform, it is possible to custom the display of time series, choosing the granularity of data or the dates range.
Source: AleaSoft Energy Forecasting.
