Information prepared by Aleasoft, a leading company in the development of price and consumption forecasting models in energy markets.
July 30th, 2015 – During the first half of 2015 the price in the Spanish wholesale electricity market MIBEL registered relatively high values with an average price of 47.12 €/MWh during that period. It should be noted that, from the beginning of the year up to now, not a single hour registered a price of 0 €/MWh. That hadn’t occurred in the first six months since 2009. These high price values were due to low hydroelectric production, the lowest of the last three winters and springs, and the subsequent increase in production with the more expensive coal and gas.
Evolution of the most important variables in the Spanish market during the first half of 2015
During the first half of 2015 Electricity demand in Spain was 1.9% higher than in the same period of 2014, although, according to the system operator (REE), once working days and temperature effects were corrected, the increase was 0.5%.The increase registered during the month of June, +3.8% due to the high temperatures, is very relevant. According to REE, this growth was only 0.2%, excluding working days and temperature effects.
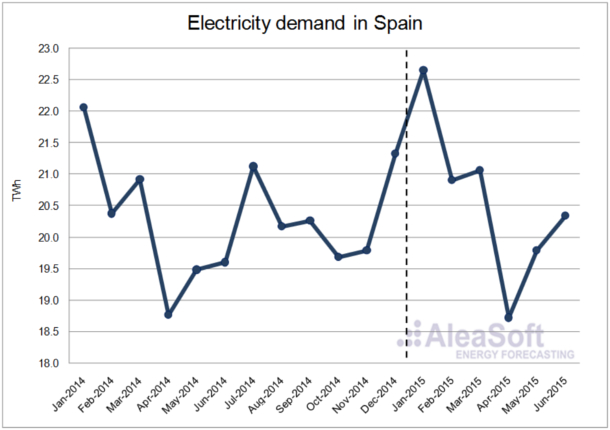
Electricity demand evolution in Spain.
Data Source : REE.
The wind power production decreased by 5.3% compared to the first half of 2014, with no variation in the installed power since then. The largest year-on-year variation was in January, when the production with this technology fell by 24.9%.
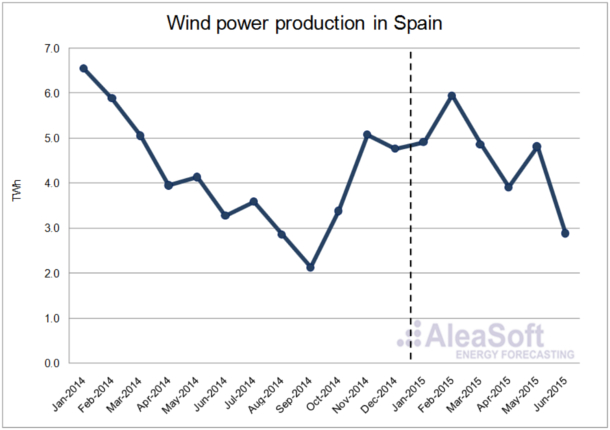
Wind power production evolution in Spain.
Data Source: REE.
In the first half of 2015 the year-on-year decrease of the hydroelectric production reached 32.5%, as it was especially large from January to April, with monthly year-on-year falls between 30% and 50%. Such low production values had not been registered since 2012, one of the driest years.
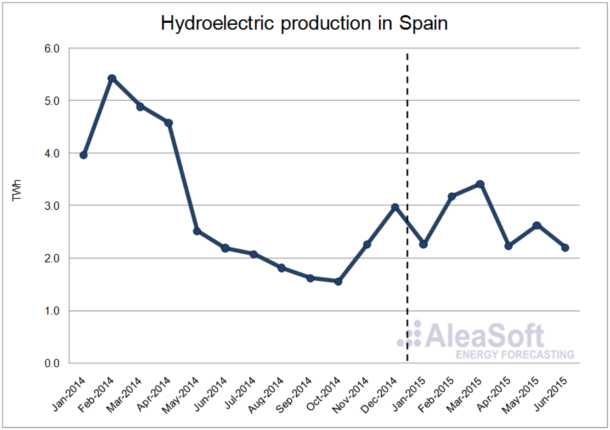
Hydroelectric production evolution in Spain.
Data source: REE.
In the case of the nuclear production, a slight increase of 0.6% was registered during the first six months of 2015 with respect to the same period of the previous year. This year, the scheduled stops started in May, which registered a year-on-year variation of -18.0%, but the whole first half year was offset by the increased production in January and June, 15.5% and 10.3% respectively.

Nuclear production evolution in Spain.
Data source: REE.
The electricity production using coal registered a large growth (59.5%) during the first half of 2015 compared to the same period of 2014. The greatest increases coincided with the months of lower hydroelectric production, between January and April, reaching annual variations of +284% in February.
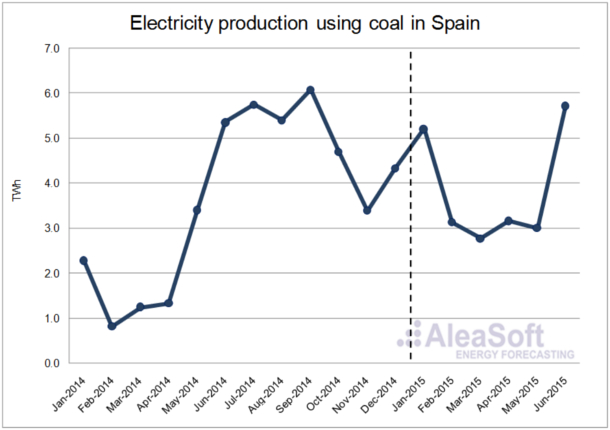
Evolution of electricity production using coal in Spain
Data source: REE.
The combined cycle production had a similar behaviour to that with coal, but with a lower growth. In the first six months the production with this technology increased by 25.2%, and the largest year-on-year increase was in January with +46.8%.
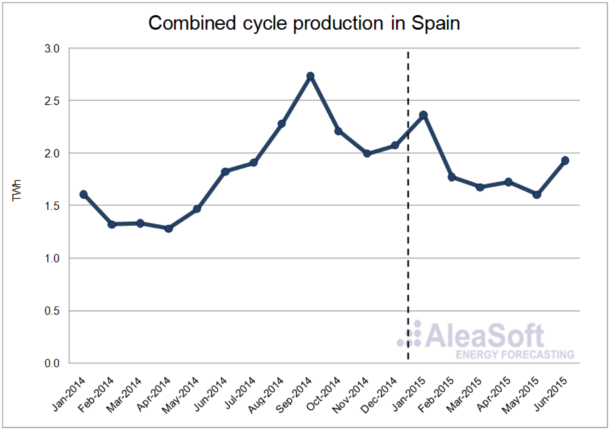
Evolution of combined cycle production in Spain.
Data source: REE.
In the case of the solar photovoltaic production, a slight increase (2.6%) was registered during the first half of the year. In the first quarter, the year-on-year increase was 10.2%, while in the second quarter the production was 1.8% lower than the same quarter of 2014. According to REE, the solar photovoltaic installed power did not change during the first half of 2015.
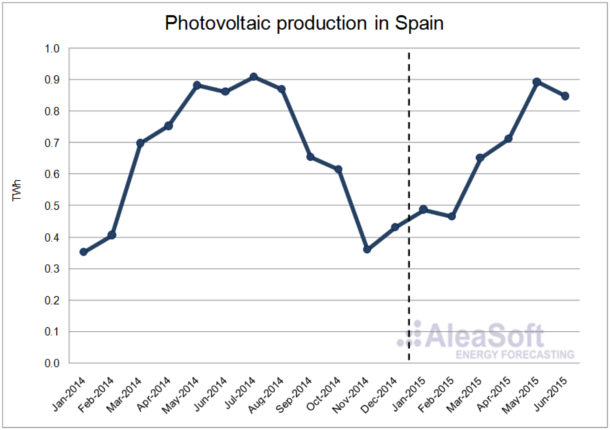
Evolution of solar photovoltaic production in Spain.
Data source: REE.
The solar thermal production registered a growth of 10.7% during the first half of 2015. In the first quarter, it registered year-on-year increase of 38.0%, and in the second quarter the production was 2.3% higher than in the same period of the previous year. In the case of the solar thermal power, according to REE, the installed power did not change in the first half of 2015.
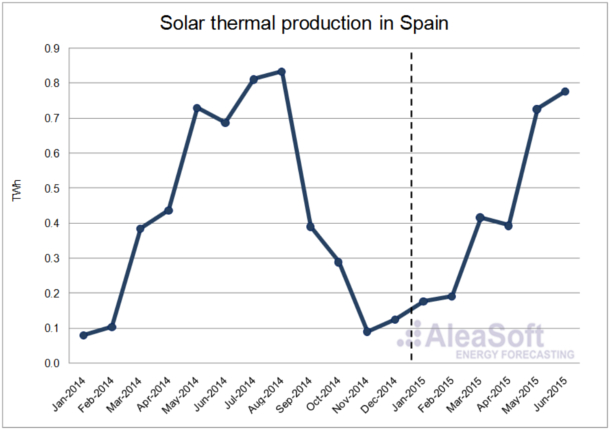
Evolution of solar thermal production in Spain.
Data source: REE.
The renewable thermal production diminished by 1.0% compared to the production of the first half of 2014. In the first quarter, the production increased in a year-on-year basis, and it decreased by 5.4% in the second quarter.
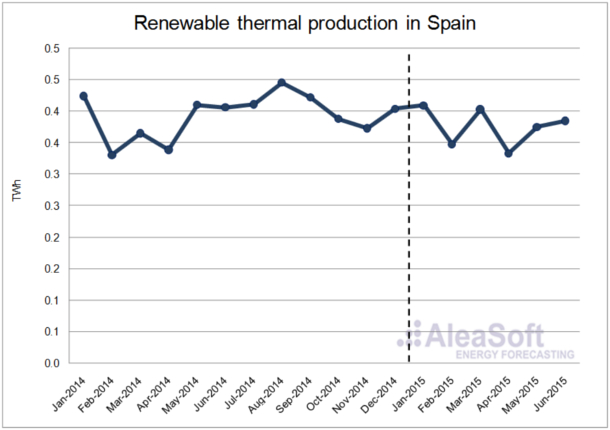
Evolution of renewable thermal production in Spain
Data source: REE.
The rest of the hydroelectric production, that includes production with units smaller than 50 MW, had the same behaviour as the conventional hydroelectric production but with a smaller decrease (19.0%).
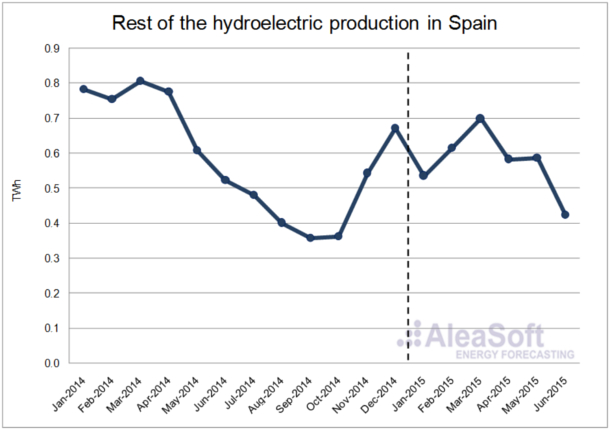
Hydroelectric production with units of power smaller than 50 MW in Spain.
Data source: REE.
Finally the cogeneration production, together with other technologies, suffered a slight increase of 3.6% in the first half of the year, after the large decrease registered during 2014 due to legislation changes in electricity production.
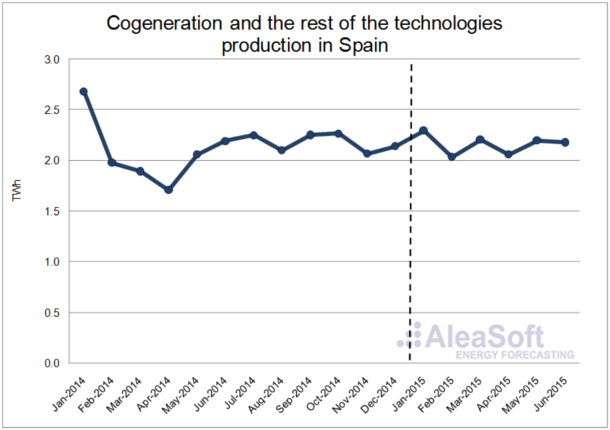
Evolution of cogeneration and the rest of the technologies production in Spain.
Data source: REE.
Price of the main fuels in electricity generation
In the first half of 2015 the Zeebrugge gas average price was 21.25 €/MWh, 1.04 €/MWh more than in the last half of 2014. The monthly average price was stable around this value, and its lowest value was 20.04 €/MWh in January. The average price of the Brent oil barrel was $57.86 in the first half of 2015. The monthly average price started in its lowest value in January with $48.12 after the important fall during the second half of 2014. It grew, reaching $64.10 in May. In June, it slightly lowered to $62.63. The behaviour of the CIF ARA European coal price during the first six months of 2015 was relatively stable around the average value of 59.76 $/t. This value was 15.60 $/t lower than the average price during 2014.
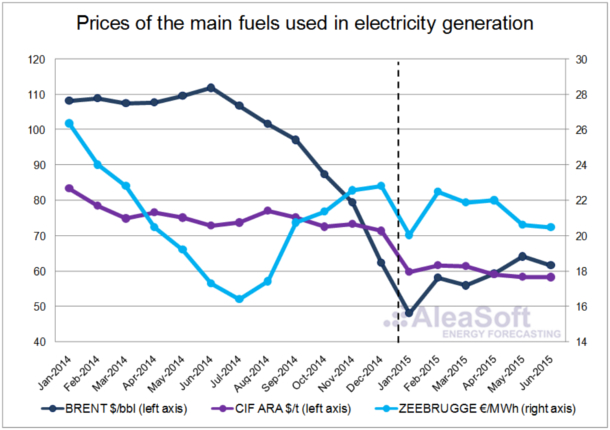
Evolution of the prices of the main fuels used in electricity generation.
Data sources: BRENT – EIA, CIF ARA – EEX, ZEEBRUGGE- NetConnect Germany.
Price of CO2 emission rights
The CO2 emission rights price had a slightly ascendant behaviour during the first half of 2015, reaching a monthly average price of 7.47 €/t in June, 0.50 €/t more than the average price in December 2014.
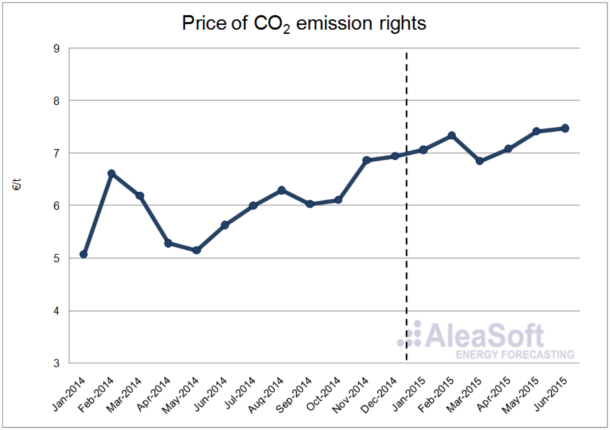
Evolution of the price of CO2 emission rights.
Data source: EEX.
Spain-Portugal interconnection
In the first half of 2015 the monthly net balance of the electricity exchange between Spain and Portugal established Spain as a net exporter, with 1064 GWh exported. In contrast, during the first half of 2014, Spain imported more electricity from Portugal than it exported.
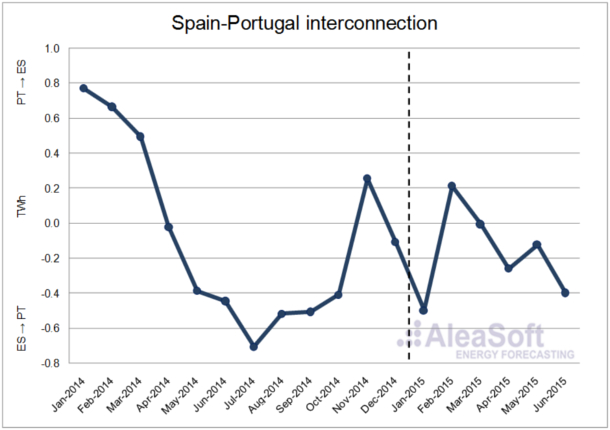 Evolution of the monthly net balance of the interconnection between Spain and Portugal. Positive values indicate that Spain imports electricity from Portugal while negative values indicate that Spain exports electricity to Portugal.
Data sources: ENTSO-E and REE.
Spain-France interconnection
The monthly net balance of the electricity exchange between Spain and France in the first half of 2015 established Spain as a net importer. Spain imported from France 2229 GWh, 2140 GWh more than in the first half of the previous year.
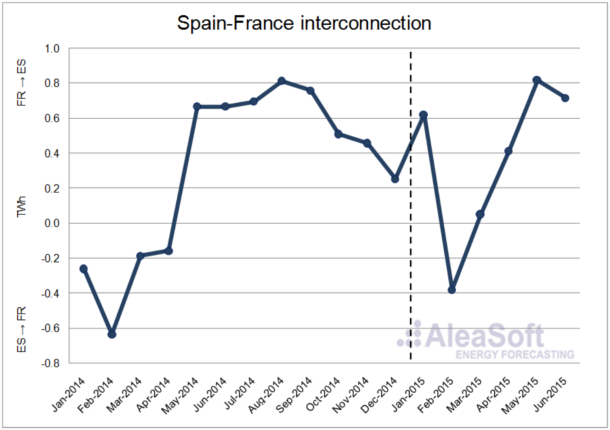
Evolution of the monthly net balance of the interconnection between Spain and France. Positive values indicate that Spain imports electricity from France while negative values indicate that Spain exports electricity to France.
Data sources: ENTSO-E and REE.
Price of the Spanish day-ahead market
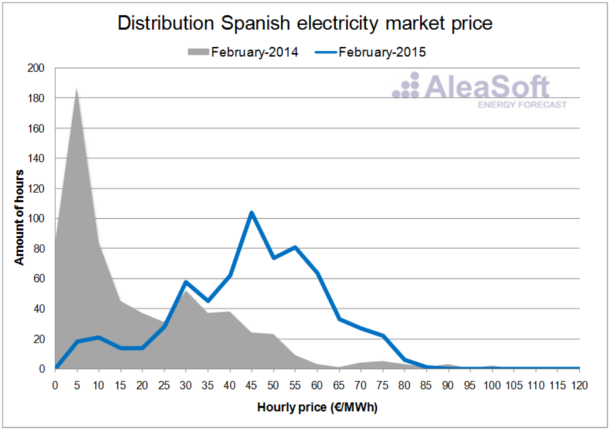
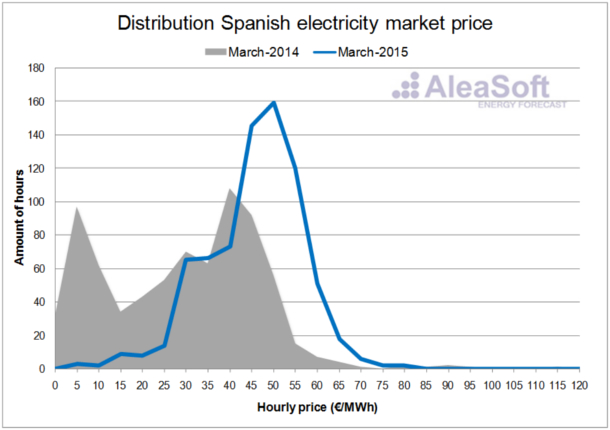
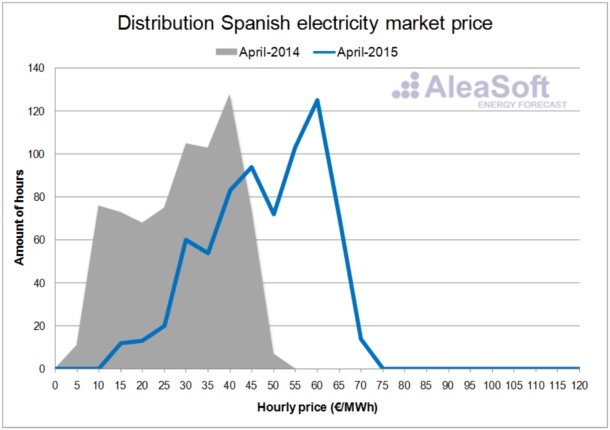
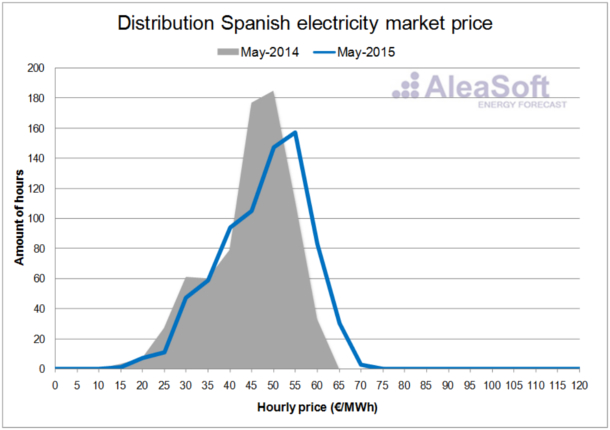
In the first half of 2015, the behaviour of the electricity price in the day-ahead MIBEL market in Spain was clearly influenced by the low hydroelectric production in winter and spring, when usually the greatest hydroelectric production is registered. This production gap was filled with coal and gas based production. The higher cost of these technologies entailed an average price of 47.12 €/MWh in the first half of 2015, 14.06 €/MWh more expensive than the same period of 2014. The lowest hourly price of this period was 4.00 €/MWh, and was registered during 8 hours in January and February; and the highest price, 85.05 €/MWh, registered during one hour in January. In the first half of 2015, not a single hour registered a price of 0 €/MWh. That didn’t occur in the first six months of the year since 2009.
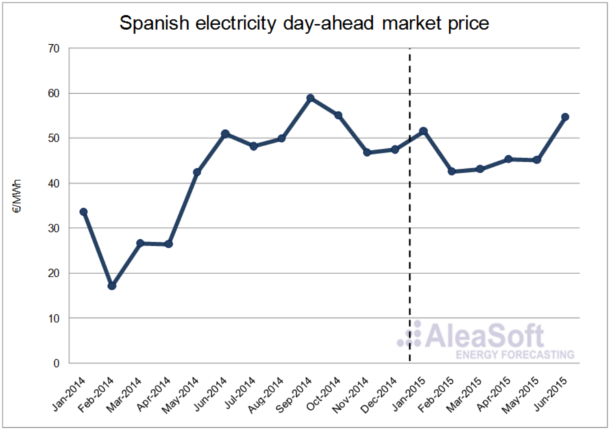
Evolution of the Spanish electricity day-ahead market price.
Data source: OMIE.
The distributions of the hourly Price for each month clearly show that prices in 2015 are shifted towards higher values with respect to prices in 2014.
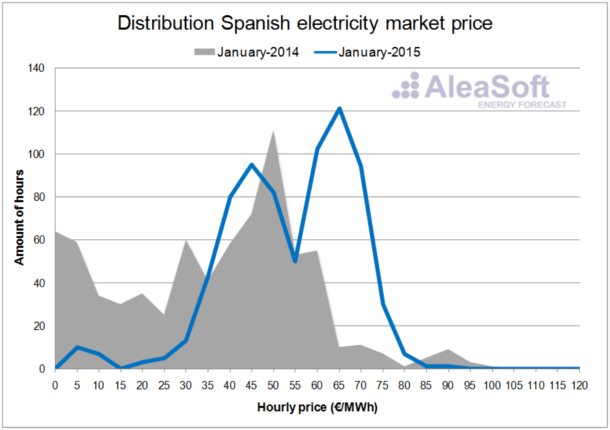
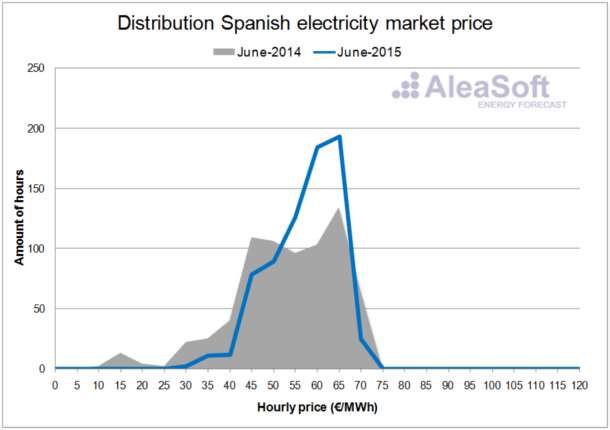 Distribution of the hourly price of the day-ahead market
Data source: OMIE
