AleaSoft, July 3, 2019. This week at AleaSoft the analysis of the European electricity markets in the recently completed quarter and first half of year was carried out, in which the general trend was the fall in prices. In this article, the analysis focuses on the Iberian MIBEL market, where prices also fell in line with the continent’s trend due to the lower prices of gas and coal and the increase in renewable energy production.
The Iberian electricity market MIBEL registered an average price of 51.80 €/MWh in Spain and 52.20 €/MWh in Portugal during the first half of 2019. These values represent an important reduction compared to the maximum prices reached during 2018. The Iberian market prices did not stop falling since last September when a monthly average of 71.27 €/MWh was reached in Spain and 71.30 €/MWh in Portugal. That peak in price was reached by the upward trend of the CO2 emission rights, gas and coal prices. Since then, the prices of the main fossil fuels used in the electricity generation, gas and coal, experienced a fall that lowered the pressure on the electricity market price, which has also clearly trended downward. All this favoured by the seasonal increase in renewable energy production. In June, an average price of 47.19 €/MWh was reached in Spain and 47.21 €/MWh in Portugal, values that were not registered since April 2018.
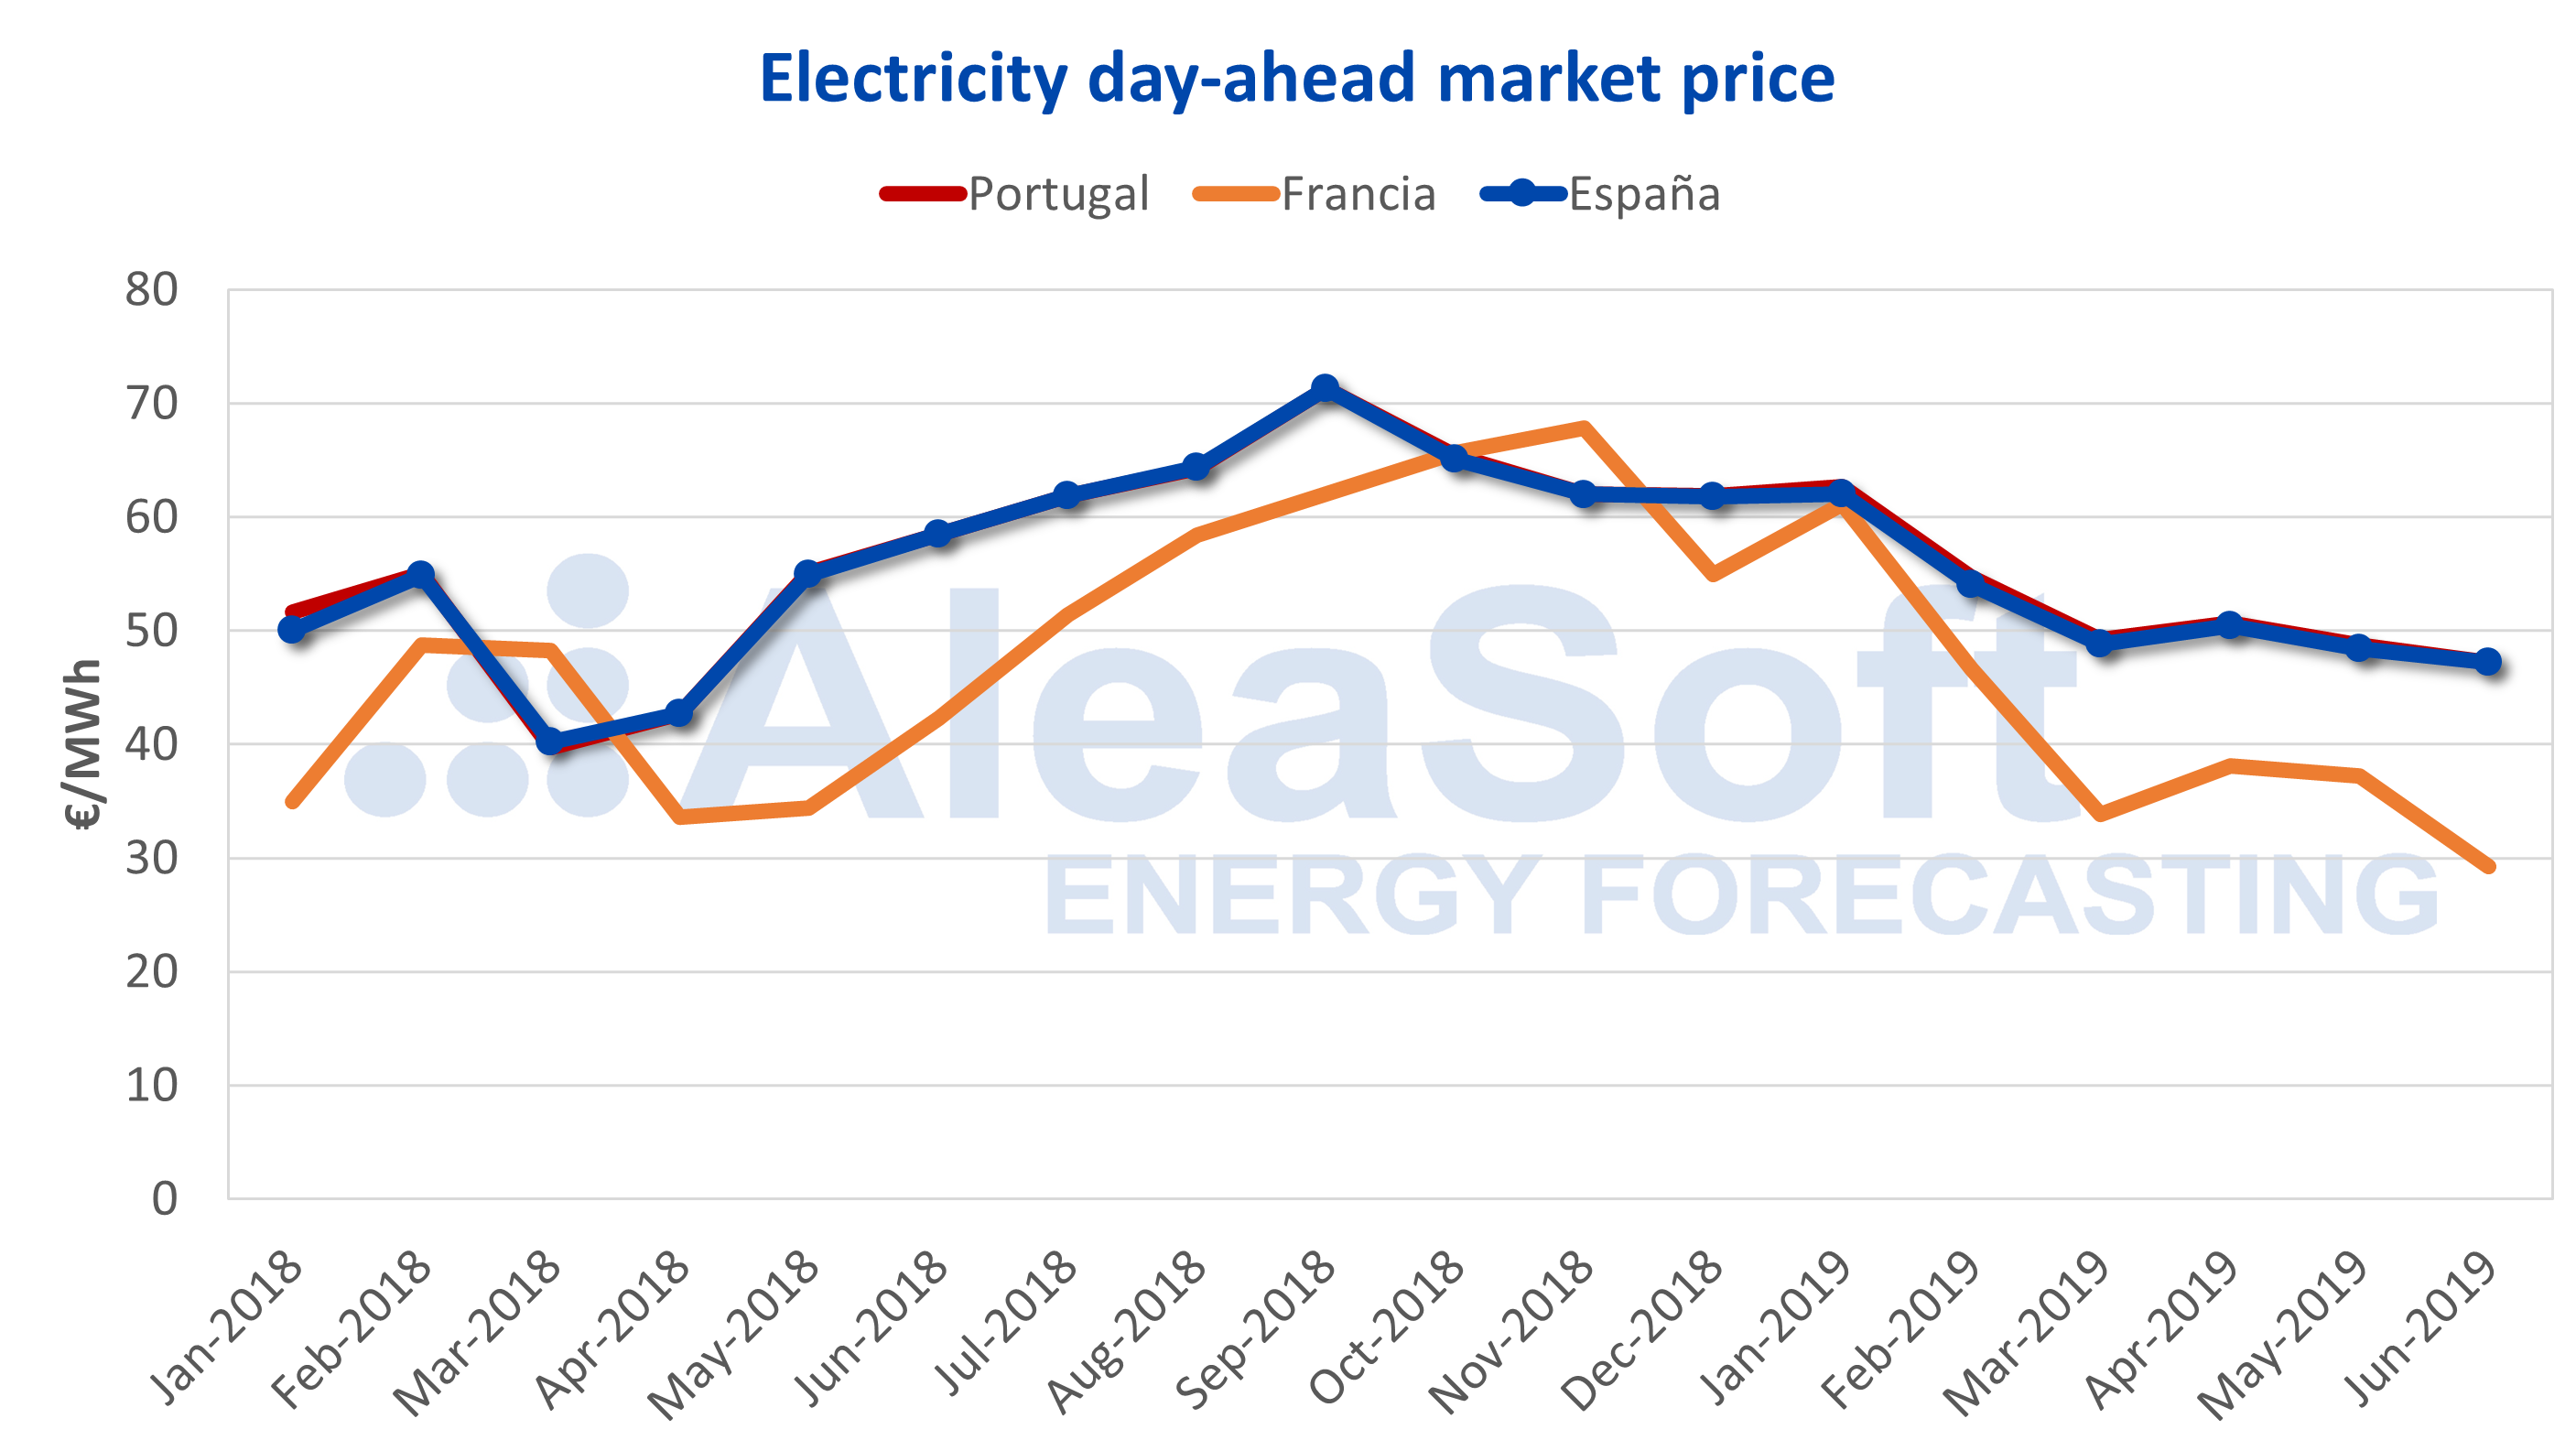
Sources: Prepared by AleaSoft using data from OMIE and .
During the first half of the year, specifically on April 1, the Tax on Electricity Production Value (IVPEE) was reintroduced in Spain, better known as the 7% tax on generation. The reappearance of this tax was due to the end of the six-month suspension that the Ministry for the Ecological Transition applied in September 2018 to slow down the escalation of the market prices. According to AleaSoft’s estimates, the end of the generation tax suspension had an impact on the market price, increasing it by around 5%.

Regarding the extreme hourly prices, the minimum hourly price was recorded in Spain during the early morning hours of March 4 and it was 3.52 €/MWh. The highest hourly price was reached in Spain and Portugal on January 15, during the afternoon price peak and registered a value of 74.74 €/MWh.
Market coupling
In these first six months of 2019, the markets of Spain and Portugal were coupled and recorded exactly the same price for 3992 hours, 91.9% of the total. This percentage is lower than that recorded during the second half of 2018, 97.2%, and in the first half, 92.4%.
The coupling with the French market also fell compared to the values of 2018. During the first part of 2019 in just 731 hours both markets were coupled, 16.8% of total hours, compared to 22.5% in 2018. The coupling with France was affected by the restrictions on the interconnections with the Gallic country that have occurred since April, and especially in June, when the coupling was only 4.6% of the hours of the month.
The total coupling between the three markets, Spain, France and Portugal, occurred in 613 hours in the first six months of this year, 14.1% of the time.
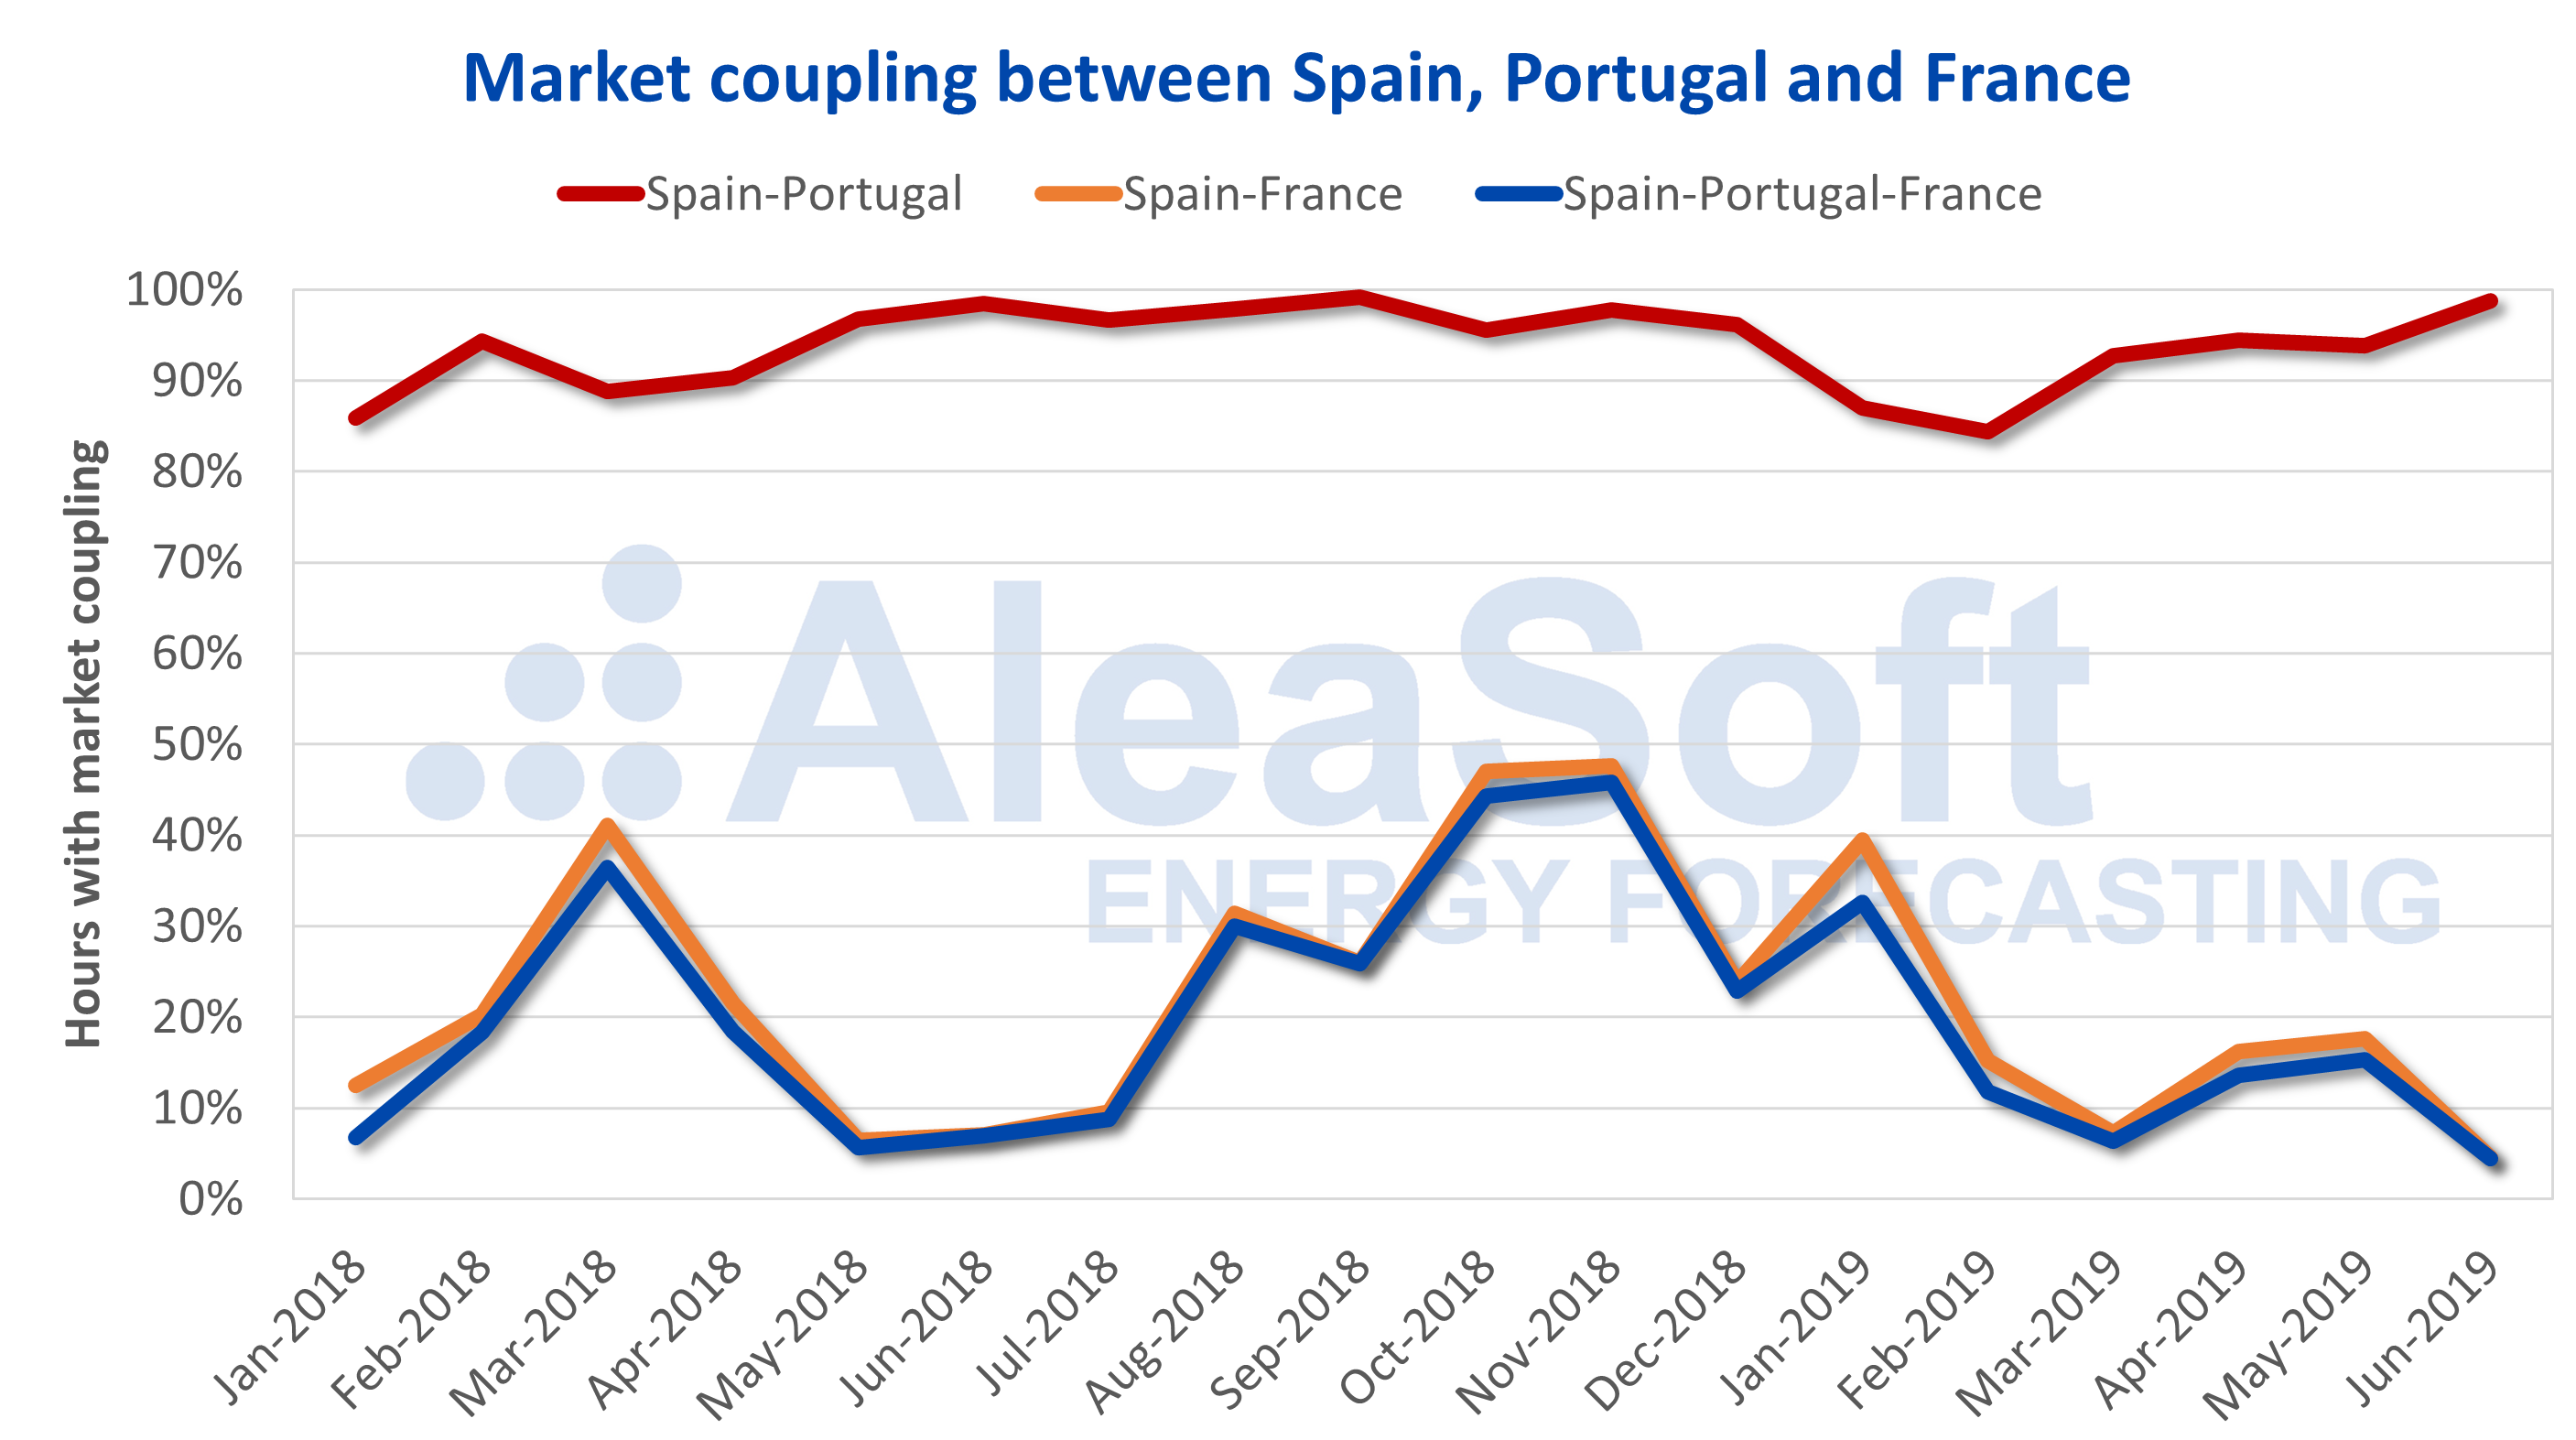
Sources: Prepared by AleaSoft using data from OMIE and .
Renewable energies captured price: wind and solar energies
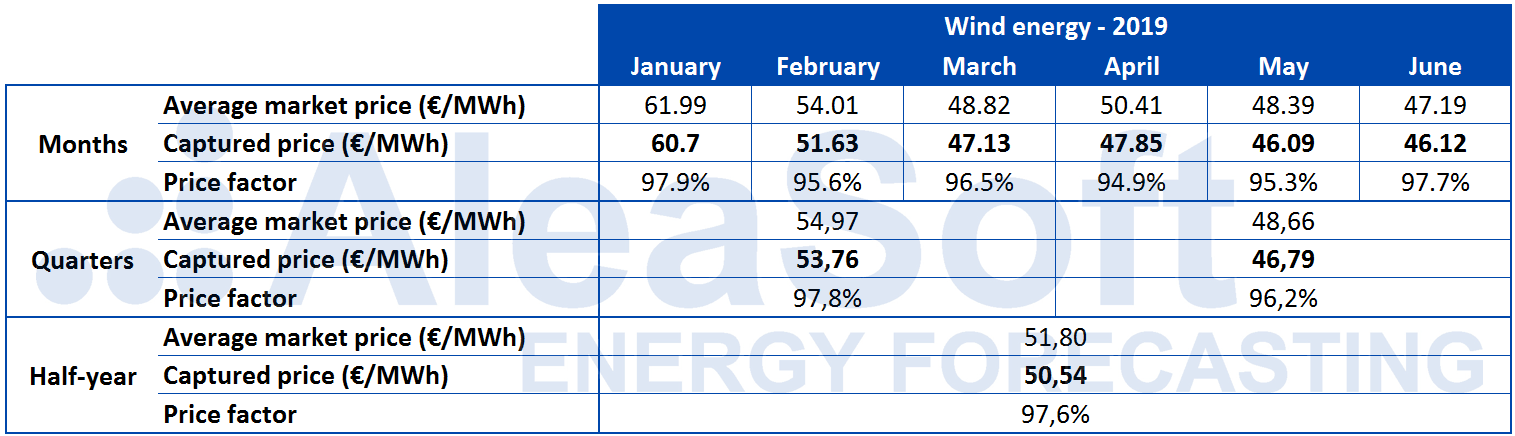
During the whole of the first six months of 2019, the solar energy captured price, both by photovoltaic and solar thermal, with respect to the average market price was clearly lowered compared to both the second half of 2018 and year-on-year with the first half of 2018. For the wind energy, even having a clearly lower price factor than the solar energy, it remained practically the same as the second half of 2018 and improved clearly compared to the first six months of 2018.
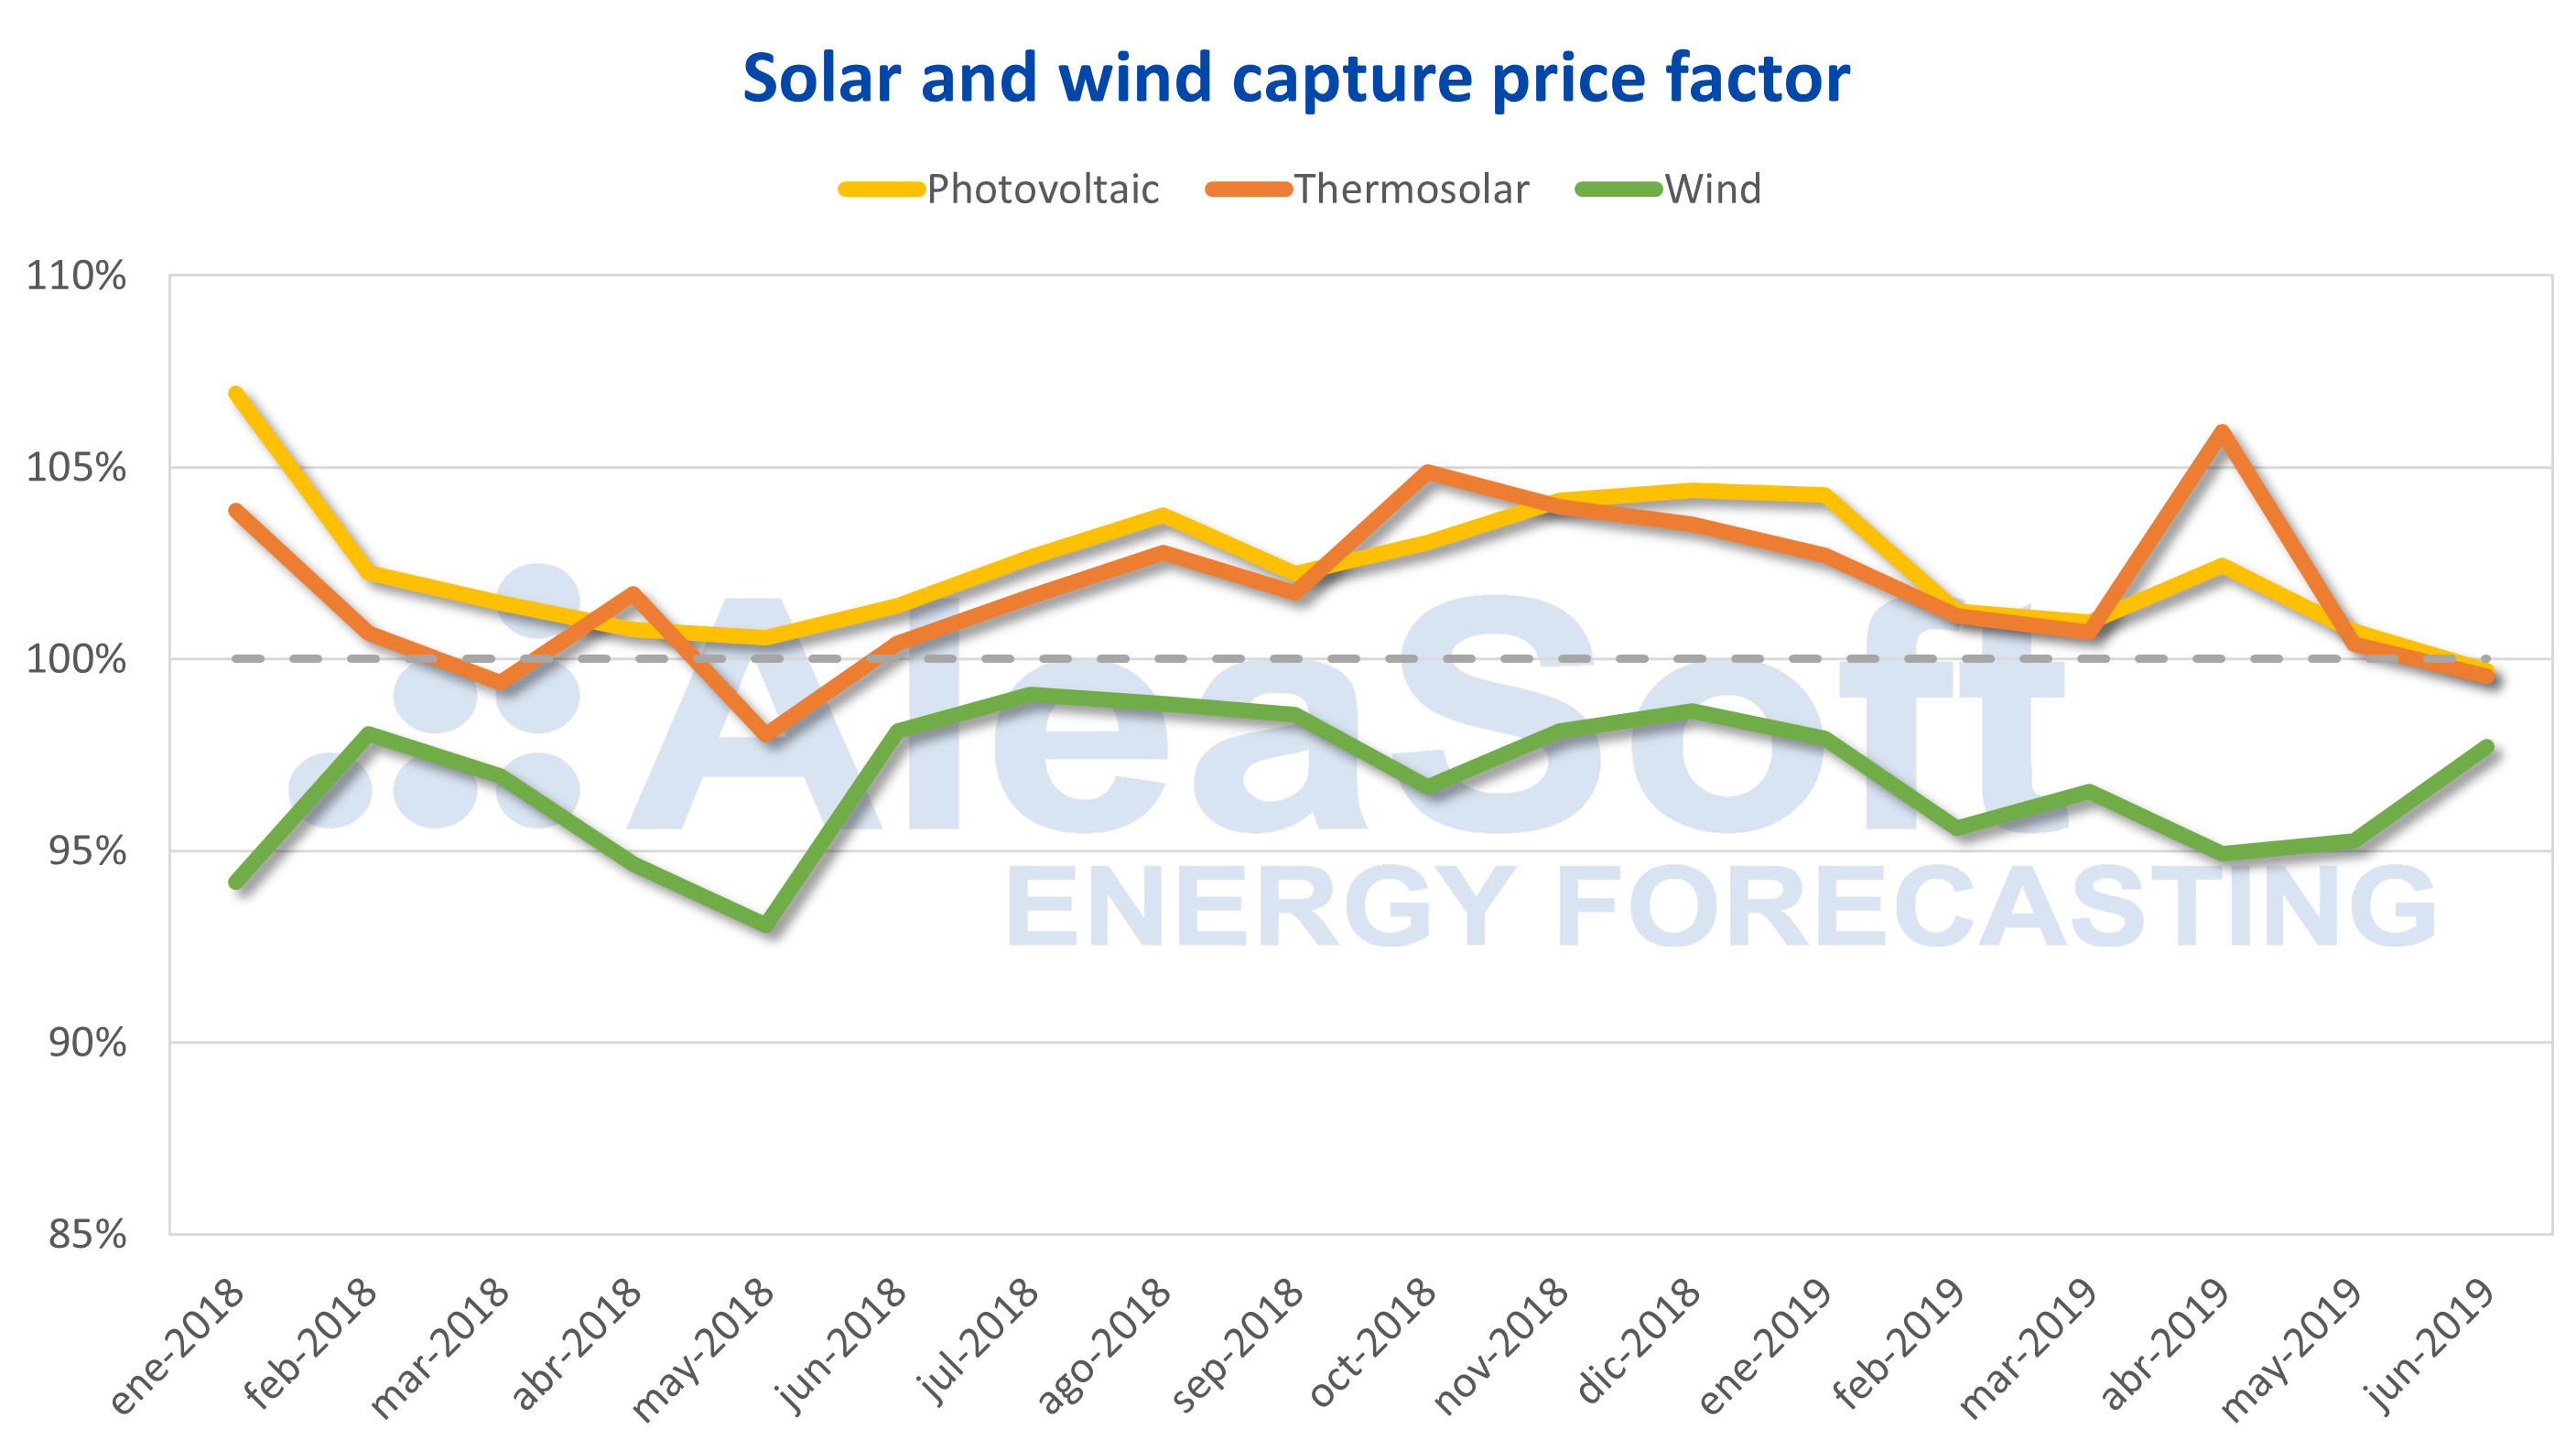
Sources: Calculations carried out by AleaSoft using data from REE and OMIE.
The solar photovoltaic captured price during the first half of 2019 was 51.48 €/MWh compared to 51.80 €/MWh of the average market price, which represents a price factor of 99.4%. However, month by month and even for each quarter separately, the photovoltaic price factor remained above 100%, except in the month of June which was just below, at 99.7%. This happened because, although the photovoltaic energy production is concentrated in peak hours with prices usually higher than the daily average, the months in which more electricity was produced with photovoltaic, that were the months with higher radiation, had lower market prices.

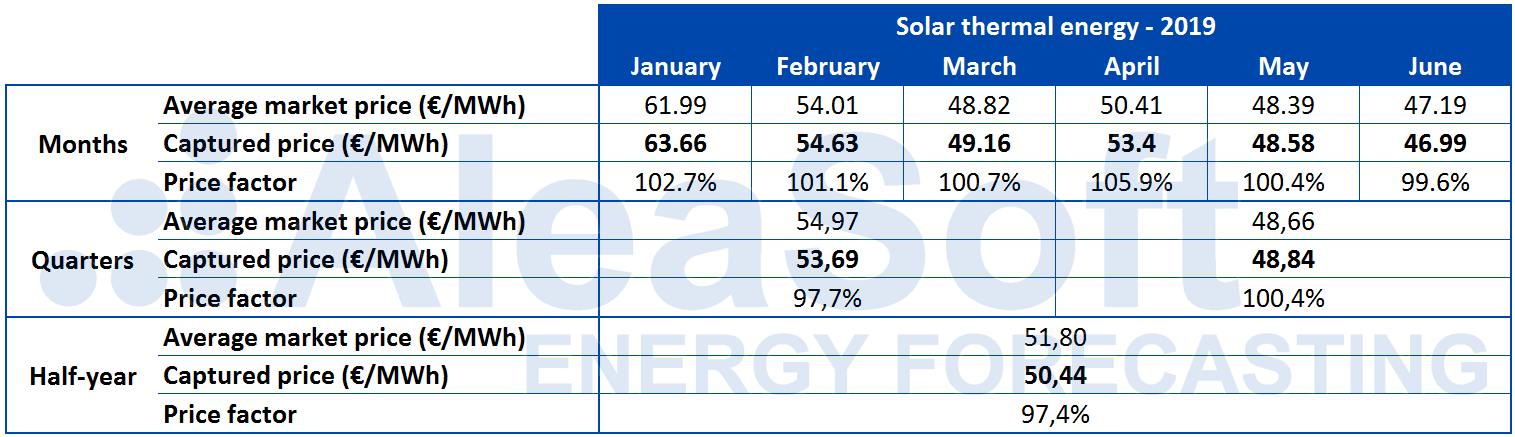
In the case of the solar thermal, the captured price in the global of the first six months was 50.44 €/MWh, more than 1 €/MWh below the price captured by the solar photovoltaic, which represents a score of 97.4%. In the same way as with the photovoltaic, month by month the captured price remained above the average market price, although with values below those of the photovoltaic, with the exception of the month of April, when the solar thermal reached a price factor of 105.9%.
For the wind energy, the numbers are clearly more modest because the installed capacity of this technology is five times the photovoltaic capacity and its depressing effect on the market price is much clearer. At a global level, in the first half of 2019 the wind energy captured price stood at 50.54 €/MWh, with a price factor of 97.6%, clearly below the value of the photovoltaic, but slightly above the solar thermal.
In none of the six months of the first half of the year the price captured by the wind energy has managed to exceed the average market price. The best month was January with a price factor of 97.9%, well below the worst month for the photovoltaic or solar thermal.
Brent, fuels and CO2
The Brent oil futures prices for the M+2 product in the ICE market acquired an upward trend during the first half of 2019, reaching the maximum value of the period on April 24, at 74.57 $/bbl. As of that date, it started trading downwards and changed the trend that was observed. However, towards the end of June it started to climb again, settling at the session of July 1 at 65.06 $/bbl, although it had a 4% decrease in yesterday’s session, July 2, compared to the price quoted the previous day, due to the pessimistic approach with which the extension of the OPEC+ restrictions was perceived. The main factors that influenced the rise in oil prices in the last half-year were the political crisis in Venezuela, the geopolitical tensions between the United States and Iran, and the OPEC production cuts. Finally, the members of OPEC+ agreed that these cuts will be extended for another 9 months, until March 2020. On the other hand, the trade dispute between the United States and China is the main factor that caused the prices to fall, despite of the recent trade truce agreed at the G20 summit by the two countries.
Throughout the first six months of this year, the TTF gas futures prices in the ICE market for the M+1 product registered a downward trend, with historical minimum values of the last two years and a 58% decrease in the prices recorded between the first and last session of the first half of 2019.
The prices of the API 2 coal futures in the ICE market for the M+1 product behaved similarly to the TTF gas futures, falling throughout the first half of 2019 and registering a 42% drop between January 2 and June 28. The most competitive gas prices and the excess of supply worldwide throughout the first six months of 2019 are the main factors that have influenced the low prices of this market.
The CO2 emission rights futures prices in the EEX market for the reference contract of December 2019 ended the first half with an increase of 3.8% compared to the beginning of the year. During approximately the first quarter until the first week of April they kept oscillating between 18.80 €/t and 25.40 €/t, starting from April 2 an accelerated growth in which historical maximum values were reached, being the settlement price of April 23, at 27.54 €/t, the highest of the half-year. After this rise, the rest of the analysed period remained oscillating in the range of 23.70 €/t to 27.60 €/t. Volatility in this market is strongly conditioned by the news that continues to emerge about the Brexit negotiation process.
Electricity futures
The electricity futures of Spain in the OMIP and EEX markets, as well as those of Portugal in the OMIP market for next year 2020, showed a decreasing trend throughout the first quarter of 2019 until reaching the minimum values on March 18. As of that date, they began to rise in parallel with the CO2 emission rights futures, until reaching the maximum values of the half-year again. After this rise, the price during the rest of the six months was maintained, ranging from 53.30 €/MWh to 57 €/MWh.
The futures of France and Germany in the EEX market for next year ended the first half of 2019 with a fall of 3.8% in the case of Germany and 5% in the case of France, with respect to the first day of the period. During the first quarter of this year they traded down and ended the last day of that quarter by 9.4% lower for Germany and 9.2% lower for France. The first week of April turned around, reaching values close to the six-month highs in less than a week. After this fast rise, the rest of the period maintained a downward trend. The electricity futures were strongly affected by the behaviour of the CO2 emission rights futures prices during this first half of the year.
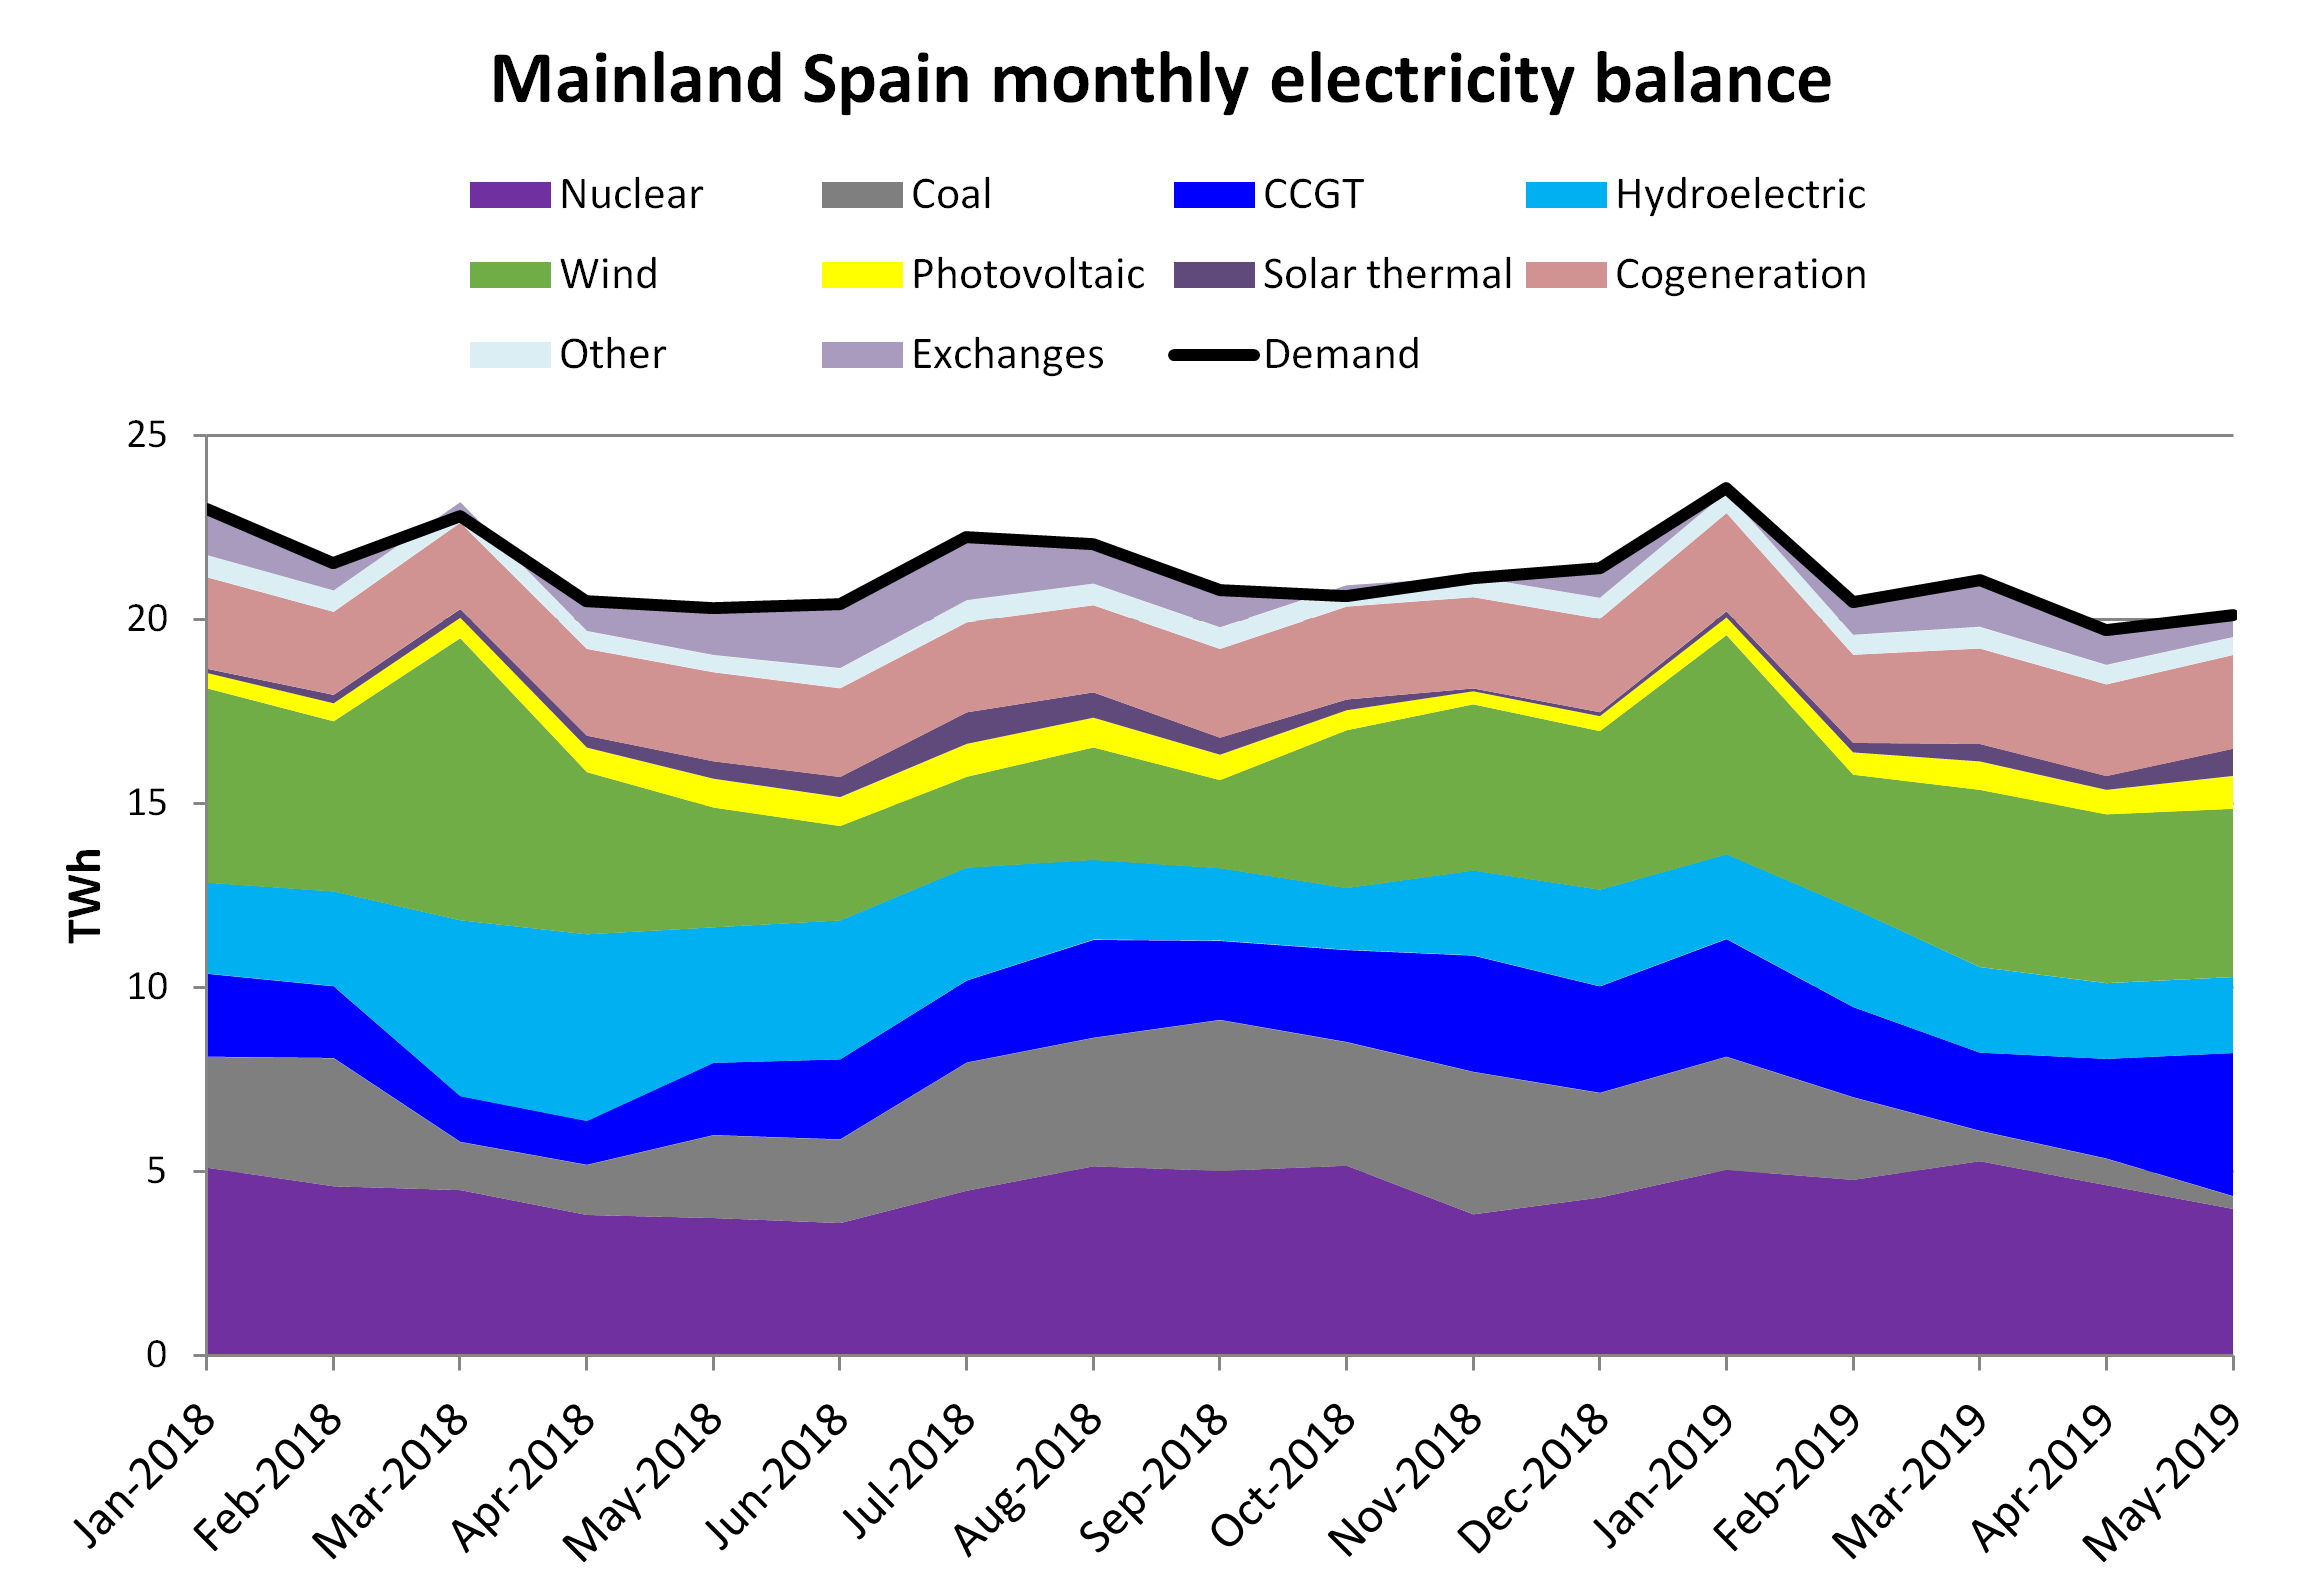
Mainland Spain: demand and production
As mentioned in a recent news from AleaSoft, the electricity demand in mainland Spain decreased by 1.6% in the last quarter, compared to the first three months of 2019. In year-on-year terms, the decrease of the six-month period that just ended was 2.2%.
The wind energy production increased by 20% last quarter compared to the same period of the previous year. On the other hand, comparing the first six months of 2019 and 2018, the decrease was 3.8%.
According to REE data, between January and May of 2019, 89 MW of wind power were installed in the peninsular territory, equivalent to an increase of 0.4% of the installed capacity of this technology.

Sources: Prepared by AleaSoft using data from REE.
The photovoltaic energy production rose by 9.0% in the quarter that recently ended, compared to the same interval of the previous year. Analysing the first half of 2019 compared to the first half of 2018, the increase was 16%.
The installed capacity of photovoltaic energy increased by 154 MW from January to May of 2019, which represents an increase of 3.5%.
On the other hand, the solar thermal energy production grew by 43% in the quarter from April to June of this year compared to the second quarter of 2018. As expected, due to the seasonal increase in solar radiation, compared to the months of January to March the production with this technology increased significantly by 1029 GWh, which represented 111%.
Analysing the first half of this year of solar thermal production, it is observed that it also increased with respect to the values of the first half of 2018, with an increase of 47%.
Altogether, the solar energy production increased at year-on-year terms, by 22% and 27%, in the just-ended quarter and half-year respectively.
The production with coal decreased by 75% in the second quarter of this year, compared to the second quarter of the previous year. In the six-month interval that just ended, the decrease was 44% in year-on-year terms.
The installed coal power capacity was reduced by 347 MW in the period from January to May 2019, which means a decrease of 3.6%.
The production of combined cycles plants increased by 6430 GWh, that is a 120% increase in the quarter that began in April compared to the same interval of the previous year. In relation to the half-year that ended last week, the year-on-year growth was 81%.
Regarding the nuclear energy production, among the relevant events there were three scheduled shutdowns. The first was a short stop for maintenance of the Cofrentes plant from January 19 to 21. Later, the Ascó II nuclear power plant stopped for refueling from April 27 to June 4. And in parallel to the aforementioned stop, the Trillo power plant stopped, also for refueling, from May 10 to June 9. To this is also added the unscheduled shutdown of Vandellós II from April 5 to 17, when problems were detected in a valve.
In general, the nuclear energy production decreased by 13% in the last quarter compared to the first quarter of the year. In year-on-year terms, production increased by 19% in the months from April to March.
As for the six months that ended on June 30, the nuclear energy production increased by 12% compared to the same period of January 2018.
In the quarter that just ended, the hydroelectric energy production decreased by 54% compared to the same quarter of the previous year, that is, 6481 GWh less were produced. When analysing the first half of 2019 in year-on-year terms, the fall was 8760 GWh, which represented 41%.
Sources: Prepared by AleaSoft using data from REE.
In the recently ended quarter, the average level of hydroelectric reserves increased by 1265 GWh, which is 12% higher than in the first quarter of the year.
T±he total hydroelectric reserves recovered by 1630 GWh in the last half-year, which represents 16% more than the reserves available at the end of the second half of 2018, according to the Hydrological Bulletin of the Ministry for Ecological Transition. In year-on-year terms, the average values of reserves ±decreased by 4.5% in the first half of 2019.
International exchanges
In all the first six months of 2019, the net balance of electricity exchanges between Spain and Portugal placed Spain as a net exporter. The total net balance of the first six months of the year is 2692 GWh exported. During this period, exports increased by 59% in year-on-year terms.

Sources: Prepared by AleaSoft using data from REE.
The net balance of electricity exchanges between Spain and France during the first half of the year placed Spain as a net importer with 7080 GWh net imported. Between April and June, both imports and exports with the French country declined, by 28% and 27% respectively in year-on-year terms, which also led to a year-on-year decrease in imports of 5.2% in the same period of the year, and of 39% in exports.
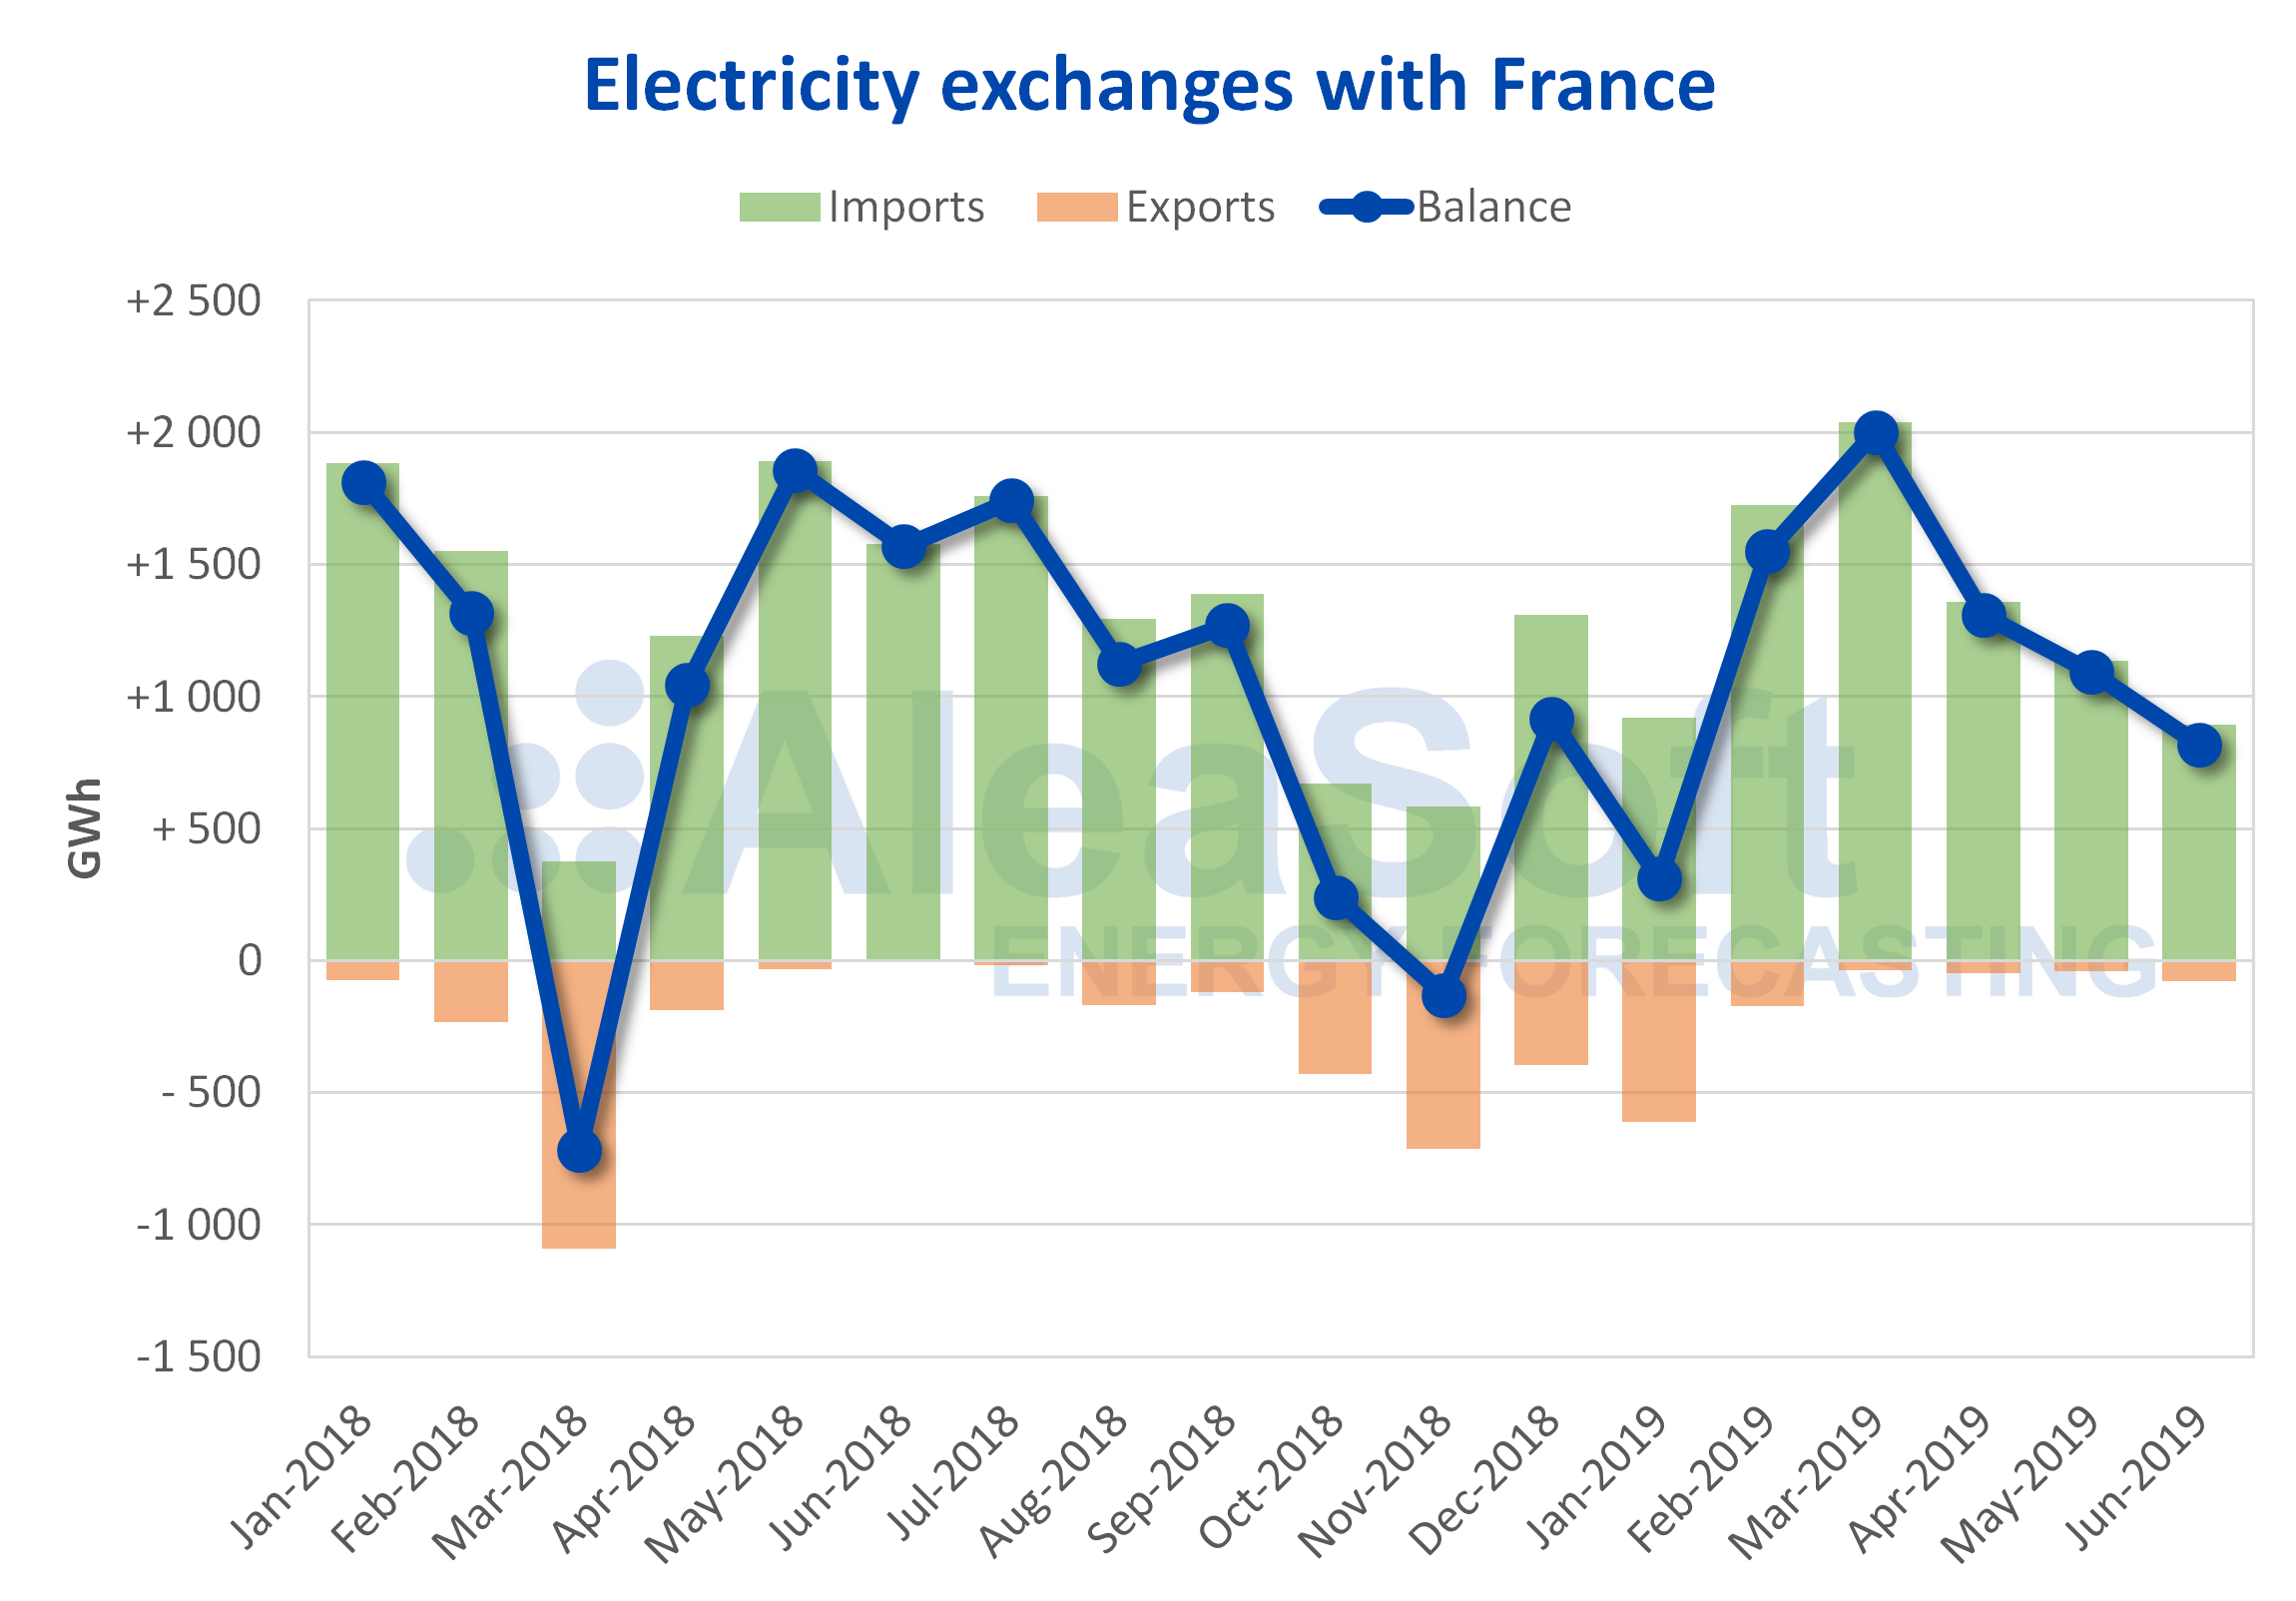
Sources: Prepared by AleaSoft using data from REE.
The available transmission capacity with France was reduced considerably in the second quarter of this year, when compared with that available in the first quarter: 39% in the direction of France to Spain and 22% in the opposite direction, which has favoured the above commented falls of imports and exports with France in the quarter just concluded.
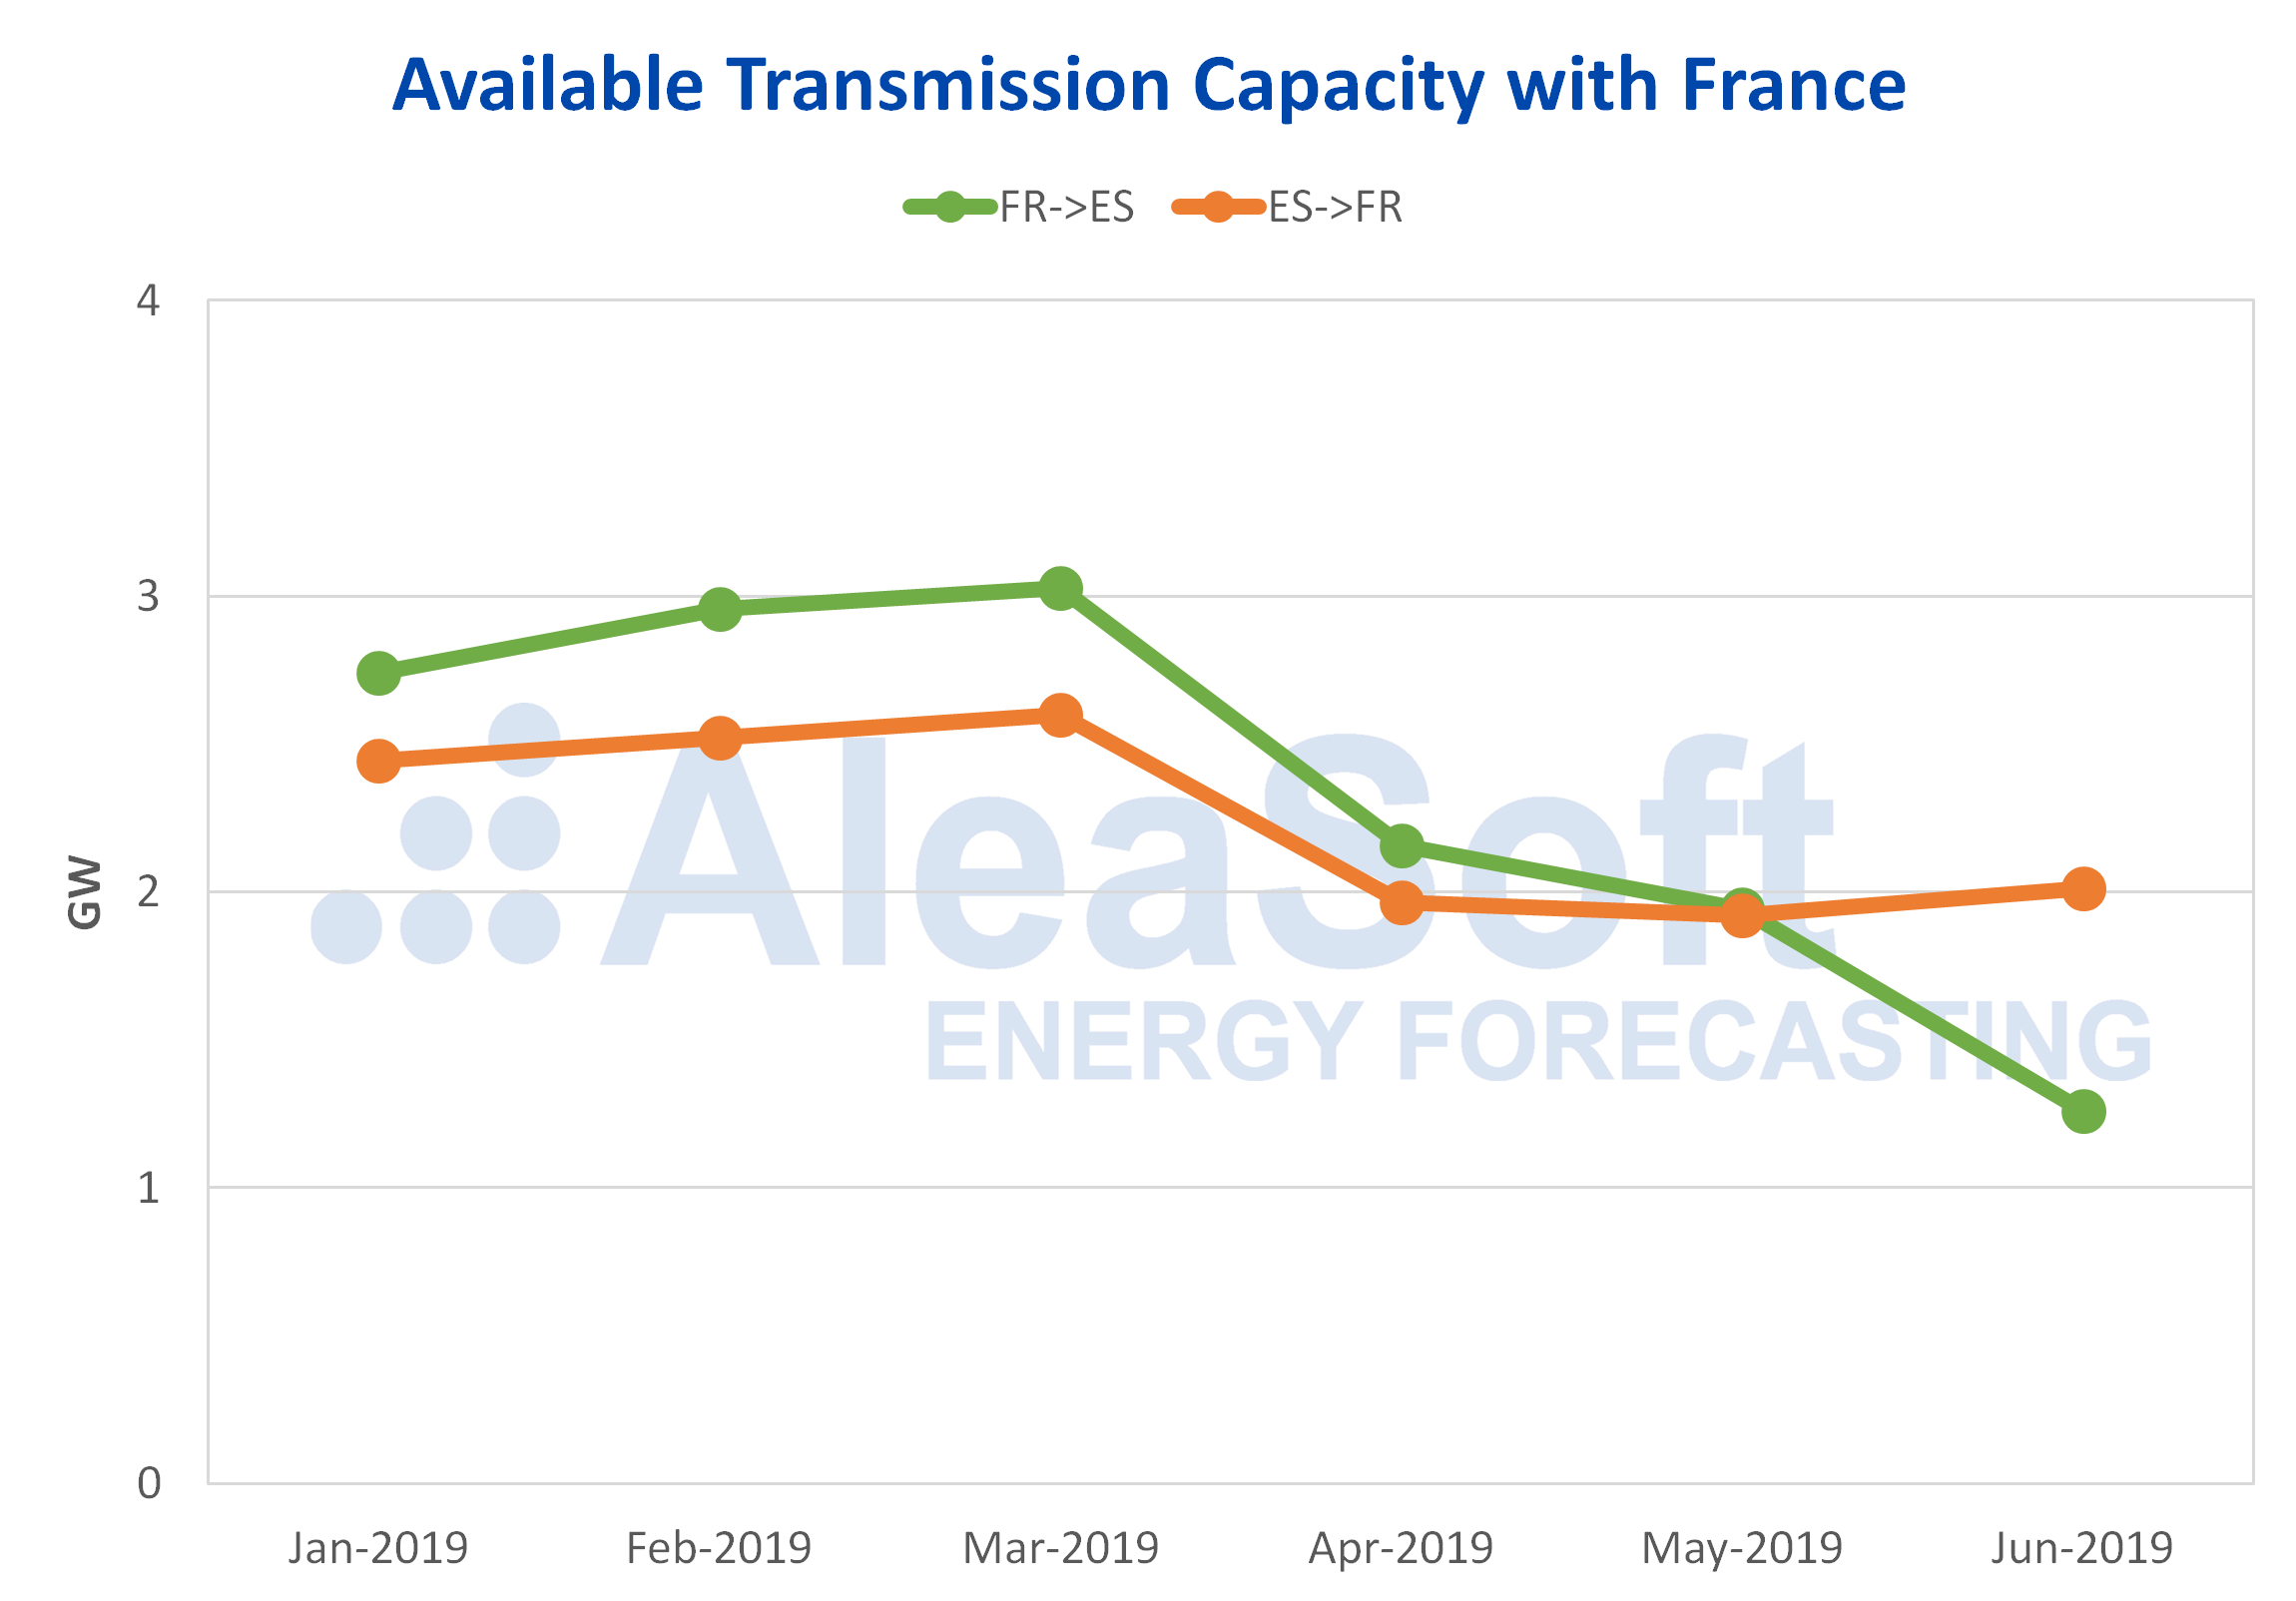
Sources: Prepared by AleaSoft using data from IESOE.
Source: AleaSoft Energy Forecasting.