AleaSoft Energy Forecasting, May 26, 2023. What are probabilistic metrics and how can they be used? When modelling energy markets prices for forecasting over several decades of horizon, it is important to understand how these markets work in the long term in order to use the most appropriate methodology. This news item describes probabilistic metrics and why they are better and more appropriate than the usual TraditionalconsultantLow, in terms of the useful and necessary information they provide.
Europe in general, and the European electricity sector in particular, are immersed in the energy transition to meet the commitment of “net zero” carbon emissions by 2050. This decarbonisation will require investments of billions of Euros. In the case of renewable energy projects, each operation involves tens or hundreds of millions of Euros. Hence the importance of having reliable and quality long‑term market price curves forecasts for the financing and valuation of renewable energy projects.
Energy price forecasts are necessary in virtually all areas of the energy sector and for all players involved in it. Project finance, PPA, M&A, asset valuation, power purchase, operational planning and risk management are just a few examples.
In all these cases, a clear and descriptive vision of the future of markets and prices is necessary to estimate yields, consumption costs or the value of a project based on the value of the energy it will produce.
Forecasting with an understanding of the nature of energy markets
To make coherent, valid and reliable energy markets forecasts it is necessary to understand how these markets work. Beyond knowing how hourly pricing mechanisms work, it is important to understand how these markets behave in the medium and long term in order to be able to make forecasts that extend over a horizon of several decades and that continue to be coherent.
The operating principle of the electricity markets, as in any other liberalised market, is based on a balance between supply and demand. There is a long‑term balance between the price offered by energy producers and the price offered by consumers. The market equilibrium matched price is the one that allows producers to obtain the expected returns throughout the lifetime of the project, and for consumers is the one that allows them to be competitive with their costs in the medium and long term.
There is also a balance between profitable and unprofitable technologies. Over time, new technologies gradually displace others that are becoming obsolete. For example, combined cycle gas turbines displaced fuel oil and coal plants, and now wind and photovoltaic energy are displacing gas plants, while the market balance is maintained.
This balance must be maintained in the long term, but that does not mean that prices cannot fluctuate in the short and medium term. In fact, electricity markets prices can be very volatile due to the conditions that occur at any given time: in hours or months with more production from renewable energies, prices will tend to fall, in times of high demand prices will rise, if fuels prices rise, electricity prices will rise.
But looking at the picture of the markets with enough perspective, it is possible to see how all these fluctuations occur around the equilibrium point of the market in the long term. In other words, there have been, and will be in the future, hours or months or years with very low prices, in the same way that there have been and will be very high price spikes. But in the long run, the equilibrium holds, it is the only way for the market to work.
Modelling energy markets prices
Based on understanding how electricity markets work, it makes perfect sense to model prices as time series. The Box‑Jenkins methodology allows applying SARIMA models. These models allow describing and predicting time series such as electricity markets prices series that show seasonality derived from the seasonality of energy demand depending on working hours or temperatures, or the seasonality or periodicity of renewable energies based on the seasonality of resources such as wind, solar radiation or rainfall. In this way, it is possible to estimate the evolution of prices over time around the equilibrium point of the market.
On the other hand, to model price volatility, energy prices can be analysed as stochastic processes and their probability distribution can be determined based on the variability of each of the variables. In this way, it is possible to estimate the variability of prices in the future and assign intervals or bands where there is a certain probability that prices will be at a certain point on the horizon.
Probabilistic metrics allow providing, not only a price forecast, but also an estimate of the probability of fluctuation of those prices. These metrics are essential for risk management where they allow using a price forecast with an associated risk or probability.
Forecasts with probabilistic metrics versus TraditionalconsultantLow
In the renewable energy projects financing, for financial entities it is necessary to estimate the viability of the projects in adverse conditions such as low electricity market prices. Historically, low alternative scenarios have been used for these cases. That is, the price curve forecasting provider chooses an unfavourable scenario for each variable and runs a price forecast based on them, thus obtaining a low forecast, known as TraditionalconsultantLow.
The problem with the TraditionalconsultantLow is that they do not provide any useful information about that low‑price future. The arbitrariness of choosing a specific scenario of low demand and a specific scenario of low gas and coal prices makes the resulting forecast equally arbitrary, since it does not contemplate the probability that these scenarios actually occur, nor the probability that all these scenarios (that of demand, that of gas, that of coal…) occur at the same time.
On the contrary, forecasts with probabilistic metrics use a scientific basis when estimating those pessimistic situations that financial entities need. The approach is based on estimating all the possible future scenarios of each variable from the probability distributions of each of them, so that the resulting price simulations describe each of the possible future prices with the probability associated with each one of them.
In this way, the probability distributions of future prices are obtained, and they allow the financial entity, depending on risk tolerance, to choose a price forecast with a certain probability, without having to arbitrarily assume a specific low scenario. Making an investment of millions without probabilistic metrics is dangerous since it considerably increases the risk of not adequately contemplating the future evolution of market prices.
Annual confidence bands
The long‑term market price curves forecasting service of AleaSoft Energy Forecasting and AleaGreen includes, in addition to the central P50 forecast, annual confidence bands for different probabilities Pa and Pb.
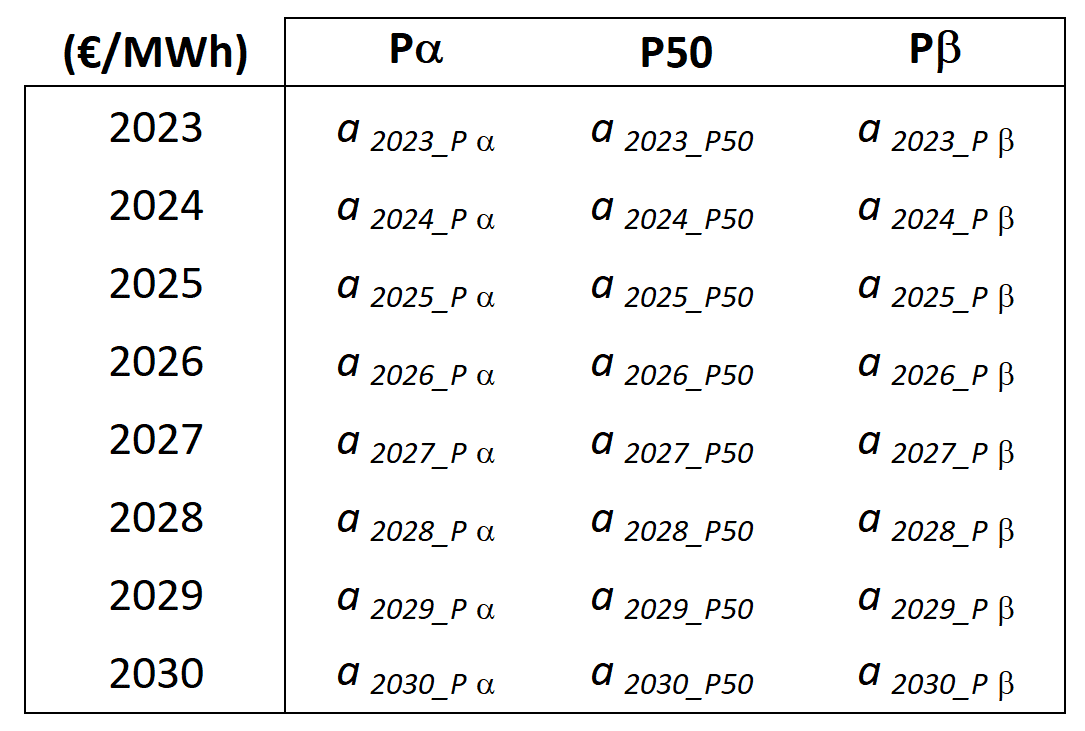 Source: AleaSoft Energy Forecasting.
Confidence bands are calculated from market price simulations and represent the probability that the price will exceed or fall below a given value for each horizon year. That is, the confidence band is an annual statistical metric, and represents the expected price variability for each year of the horizon, also with an associated probability.
These forecasts and bands are necessary for any renewable energy project or for large consumers, for financing, PPA, M&A, risk management or operational planning. A clear example, for a financial institution, is that the annual low‑price band allows it to estimate the probability of failure to repay the debt for a given year of the horizon.
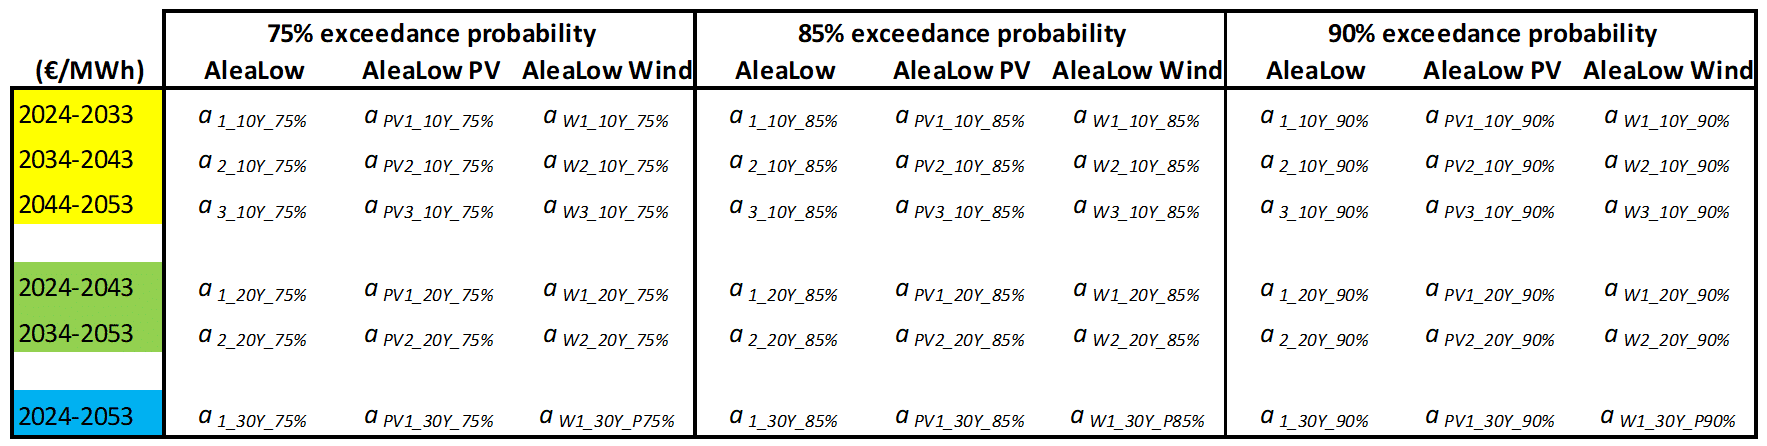
AleaLow, AleaLow Wind and AleaLow PV
The long‑term forecasting service of AleaSoft Energy Forecasting and AleaGreen also includes AleaLow, another probabilistic metric of market prices. The AleaLow estimates a price for which there is a specific probability that the average market price during the entire forecast horizon, or a range of years, will be higher than this value. The AleaLow values allow estimating the most bearish forecast scenarios from a scientific basis and with the added value of an associated probability and not representing arbitrary scenarios.
Continuing with the example of a financial institution, the AleaLow allows determining the feasibility of the project being able to repay the debt within the required period.
The results are included in a table similar to the one shown below. Thus, the value of AleaLow for the period 2024‑2053 for which there is an 85% probability that the average market price for that entire period exceeds a price value represented in the table by a1_30Y_85%.
 Source: AleaSoft Energy Forecasting.
Other results of the forecasts of AleaSoft and AleaGreen are AleaLow PV and AleaLow Wind, which, analogously, represent the most bearish scenario of prices captured by solar photovoltaic and wind energy, respectively, for a range of years with an associated probability. If the values shown in the previous table are taken into account, for the period 2024‑2053 it is estimated that the price captured by solar photovoltaic energy will exceed the value represented by aPV1_30Y_85% with a probability of 85%.
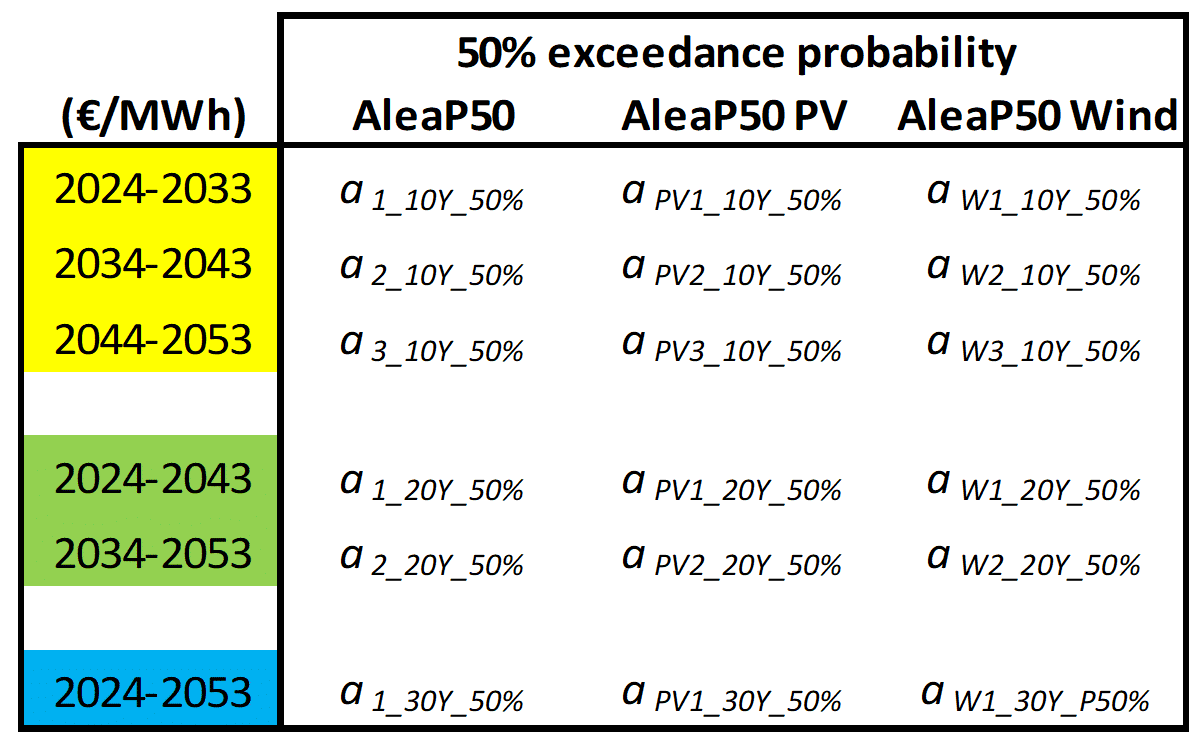
Generally, the most demanded AleaLow are those associated with 75%, 85% and 90%, as shown in the table above, but they can be calculated for other probabilities. Specifically, the AleaLow associated with the 50th percentile, AleaP50, represents the most probable average price for that set of years.
 Source: AleaSoft Energy Forecasting.
The AleaLow values are calculated directly from price simulations for various periods of years in the forecast horizon, and do not correspond to and should not be understood as averages of the annual confidence bands.
AleaLow vs TraditionalconsultantLow
The AleaLow probabilistic metrics provide scientific estimates of possible future lower price scenarios, always associated with a probability of occurrence and a given year or period of years. This makes them the best existing tool for risk management inputs, financial modelling, or debt sizing.
In contrast, TraditionalconsultantLow are arbitrary scenarios that do not provide any information on their probability of occurrence and are not specifically defined for specific years or periods of years.
AleaSoft Energy Forecasting’s analysis on the prospects for energy markets in Europe and the financing and valuation of renewable energy projects
The renewable energy projects financing and PPA will be one of the topics that will be analysed in the next webinar of AleaSoft Energy Forecasting and AleaGreen, which will take place on June 8 at 10:00 CET. The webinar will have the participation of speakers from Engie Spain, who have vast experience on this topic. The main regulatory issues of the Spanish electricity sector and the evolution and prospects of European energy markets in the second part of 2023 and during the coming winter will also be analysed.
Source: AleaSoft Energy Forecasting.