AleaSoft, September 1, 2020. The European electricity markets prices rose in August compared to those of July. However, they are still lower than those of August 2019 in most cases. One of the causes of this behaviour is the gas prices, which recovered compared to July but are still lower than in August 2019. A positive figure is the year‑on‑year increase in wind and solar energy production in all markets. On the other hand, the demand fell compared to that of August 2019 due to the coronacrisis.
Photovoltaic and solar thermal energy production and wind energy production
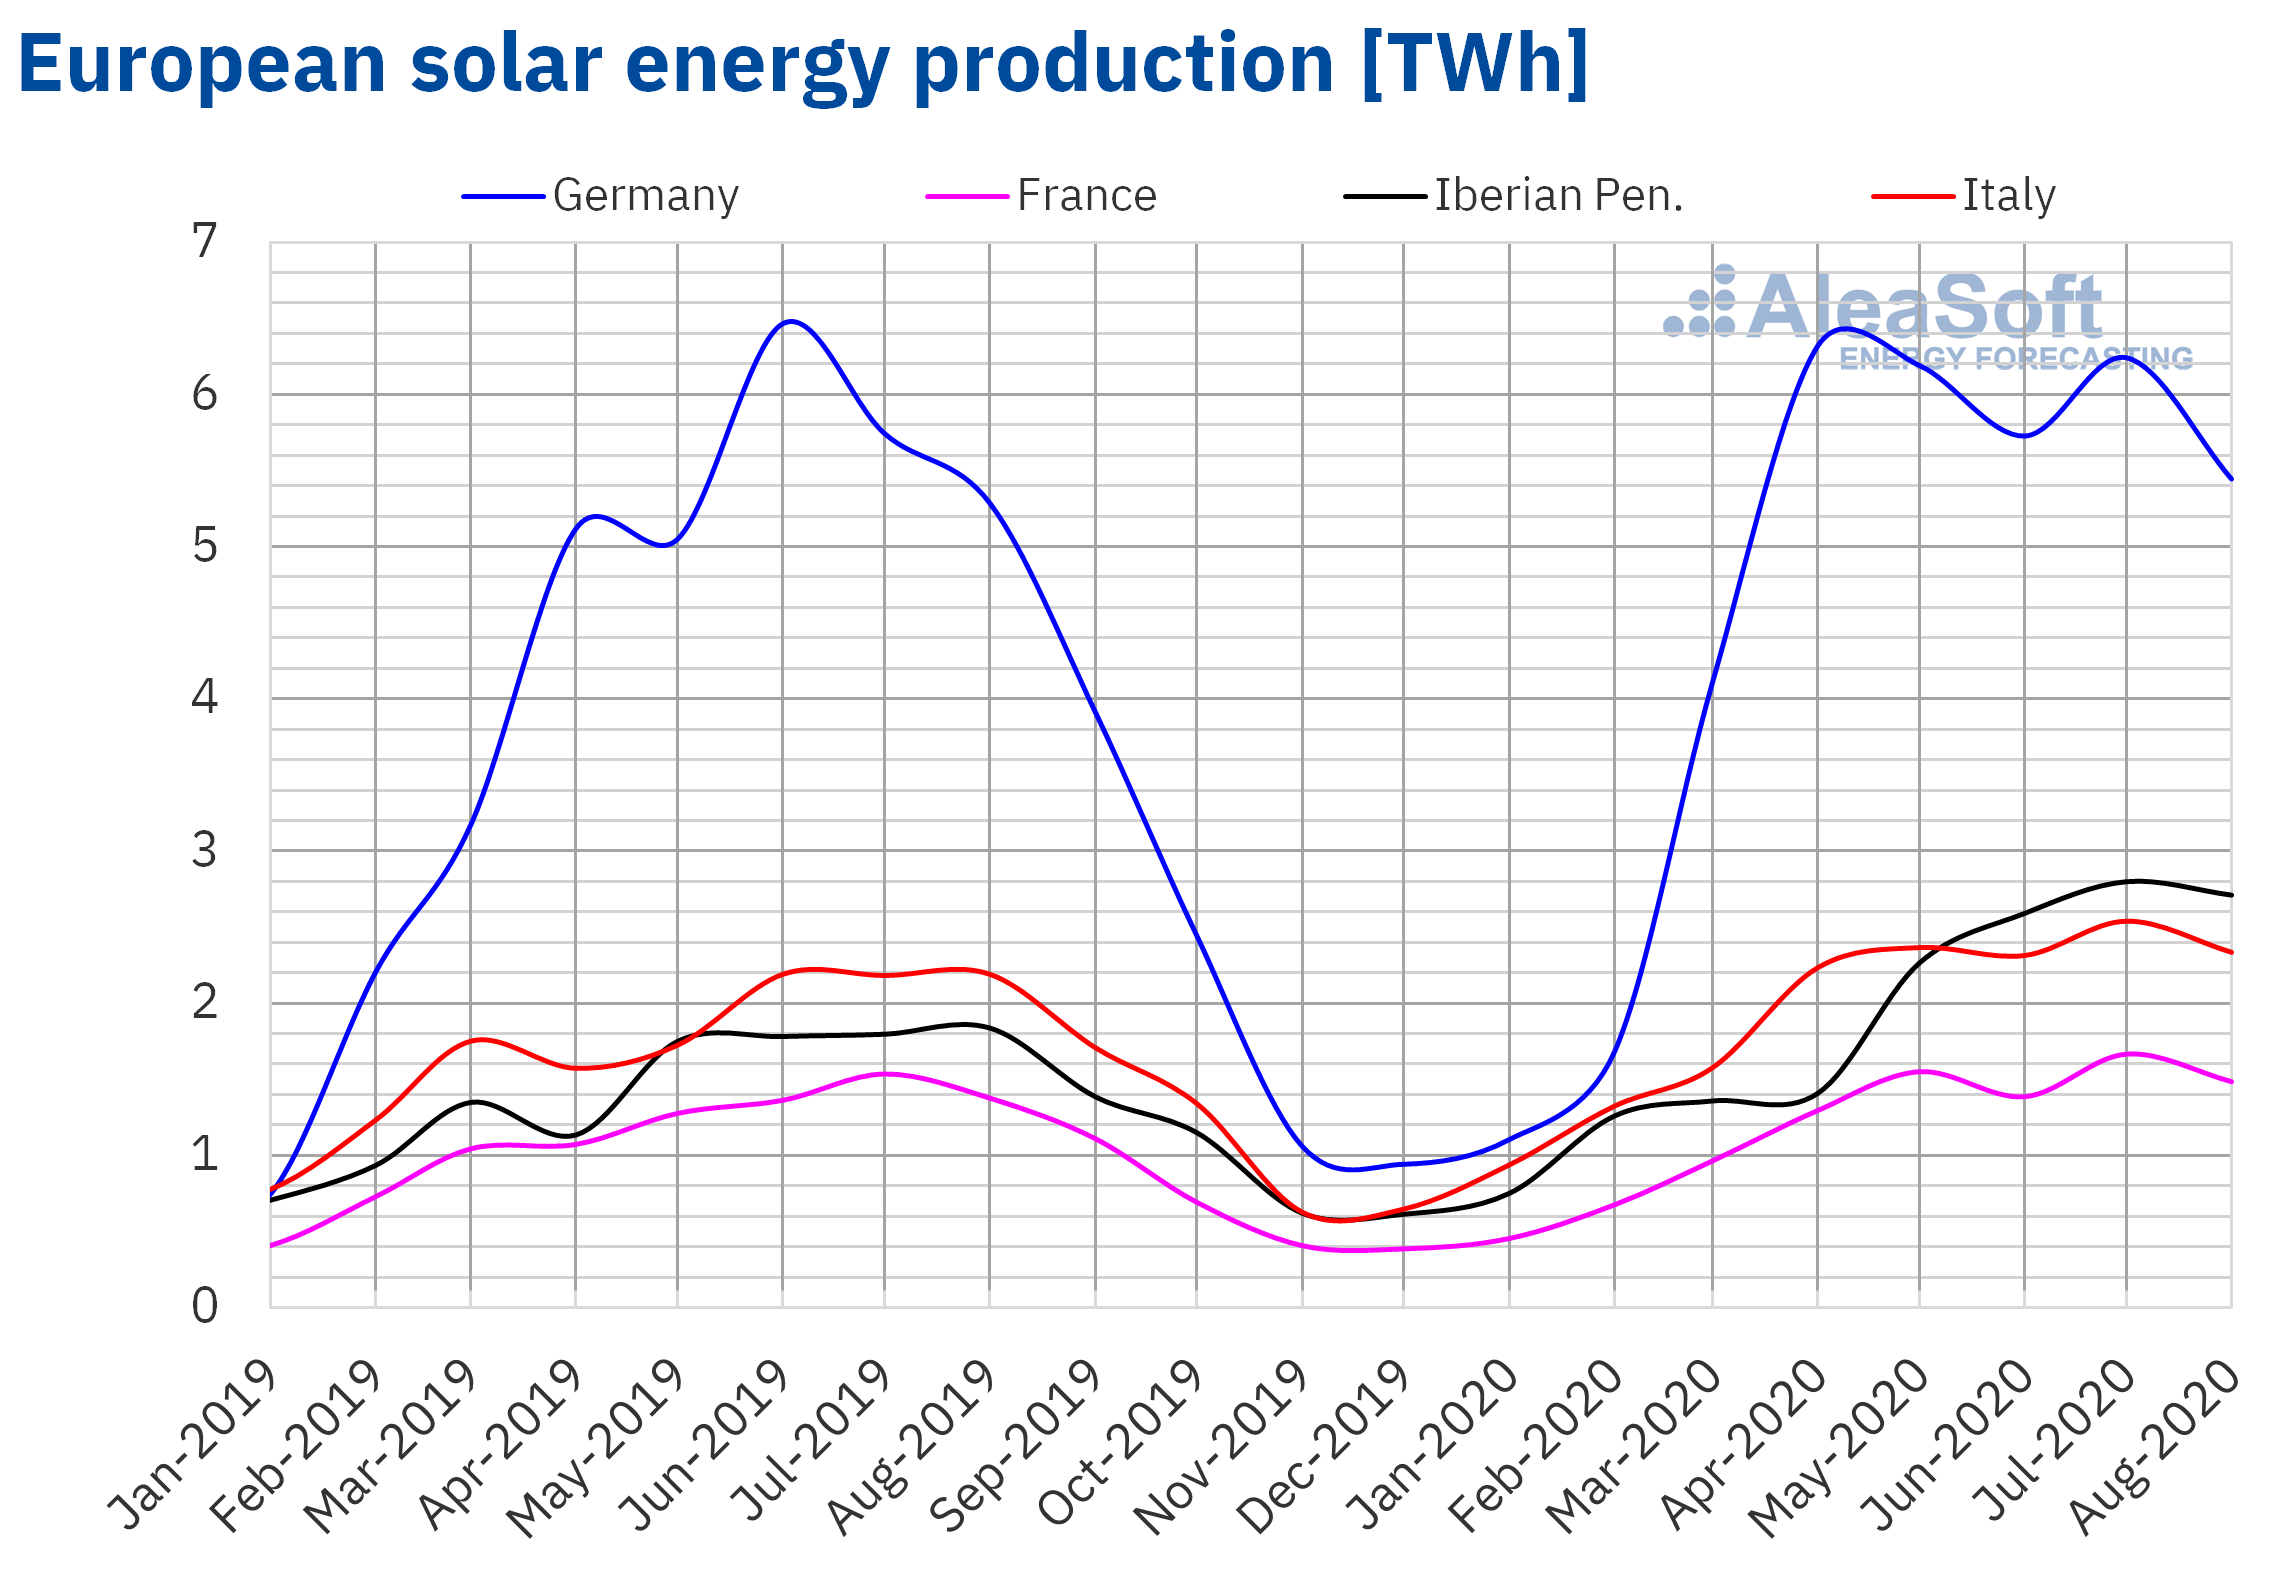
The solar energy production increased in all the European markets analysed at AleaSoft during the month of August compared to August 2019. The largest increase in production was registered in the Iberian Peninsula and it was 48%. In Italy the increase was 6.6%, in France 7.9% and in Germany 3.0%.
On the contrary, if the solar energy production during last August is compared to that of July, it decreased in all European markets. The fall of 13% in the German market and 11% in the French market stand out. In the rest of the markets, the decrease in production was between 0.4% of the Portuguese market and 8.1% of the Italian market.
 Source: Prepared by AleaSoft using data from ENTSO-E, RTE, REN, REE and TERNA.
 Source: Prepared by AleaSoft using data from ENTSO-E, RTE, REN, REE and TERNA.
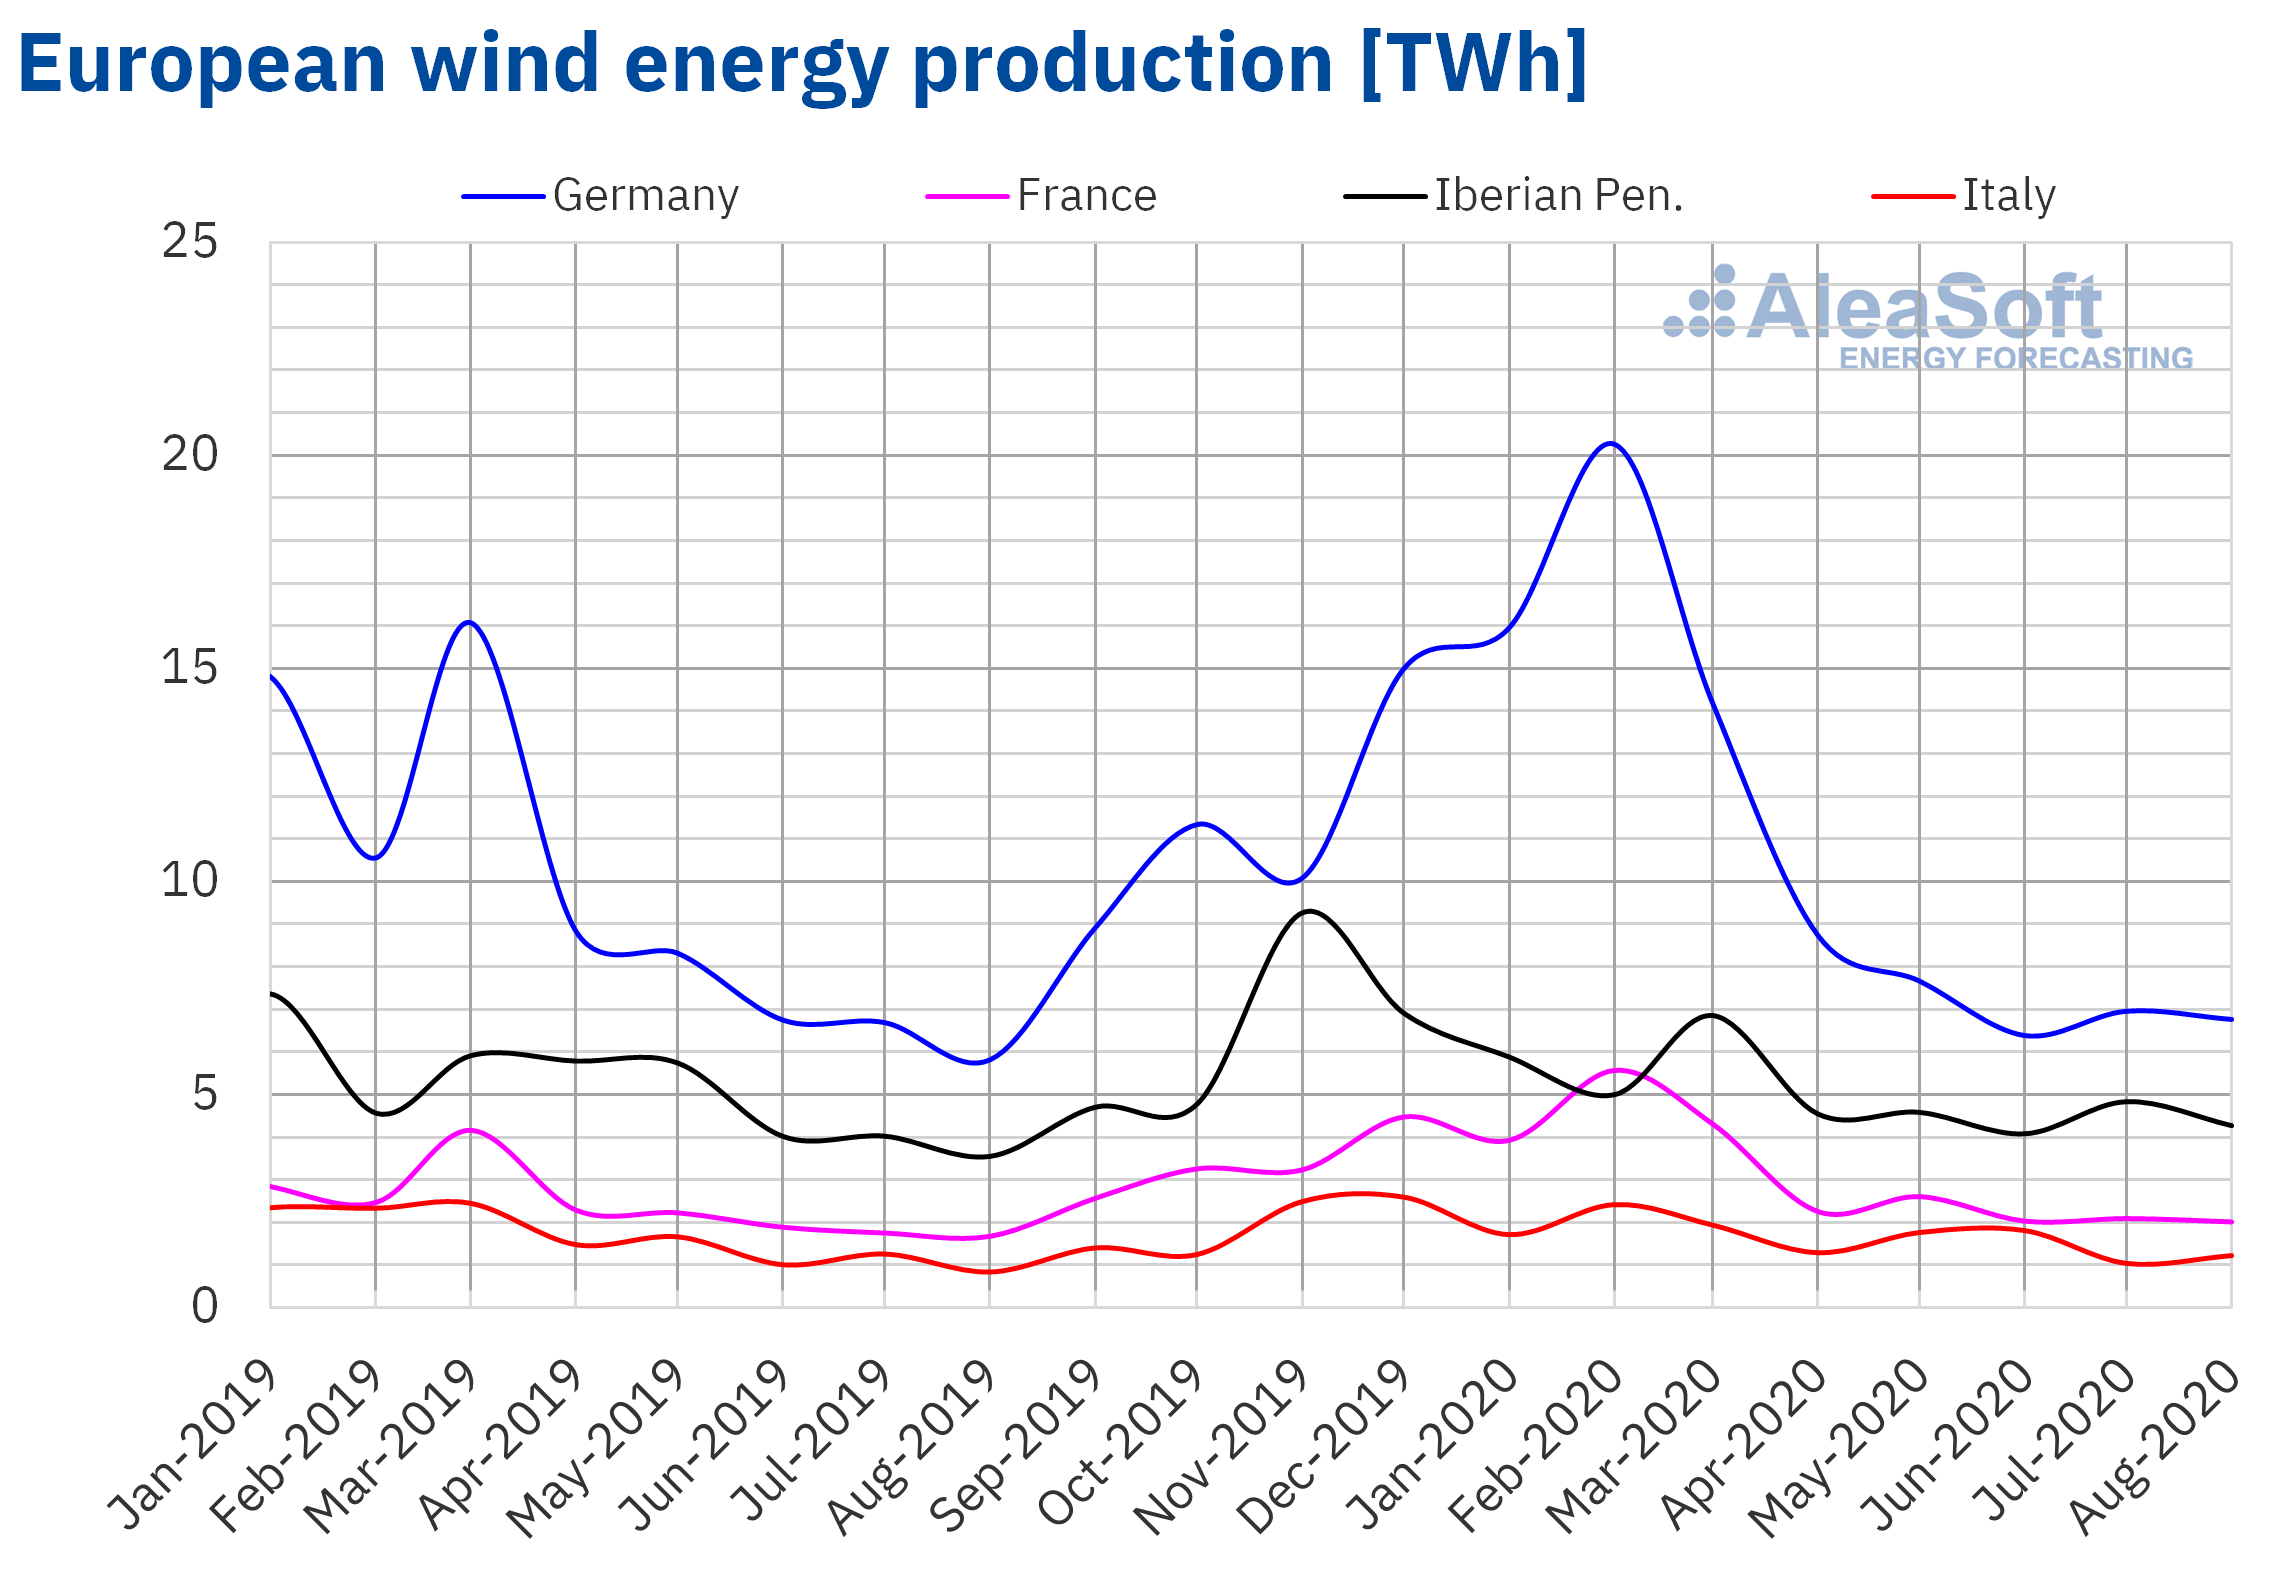
Similarly, the wind energy production during last August was higher in all the analysed markets compared to August 2019. In the case of this technology, the largest increase was registered in the Italian market and was 47%. In the Iberian Peninsula there was an increase of 20% and in Germany and France the growth was higher than 16%.
Comparing the production of August with that of July, the increases of 16% and 18% registered in Portugal and Italy respectively stand out. In the rest of the markets, the production fell between 2.7% of Germany and 17% of Spain compared to July.
 Source: Prepared by AleaSoft using data from ENTSO-E, RTE, REN, REE and TERNA.
Renewable energy auctions
On August 24 and 25, the second solar energy auction was held in Portugal, in which a new record price of €11.14/MWh was reached. A total of 670 MW were awarded, of which 483 MW were in the storage mode, 177 MW in the system compensation mode and 10 MW in the difference contract mode. According to the statement from the Portuguese Government, thanks to this auction its Electricity System will have a minimum storage capacity of almost 100 MW, which will provide it with greater flexibility. The South Korean company Hanwha Q‑Cells, which was awarded 315 MW distributed in six of the 12 lots that were auctioned, was the company that obtained the most MW in this auction.
Electricity demand
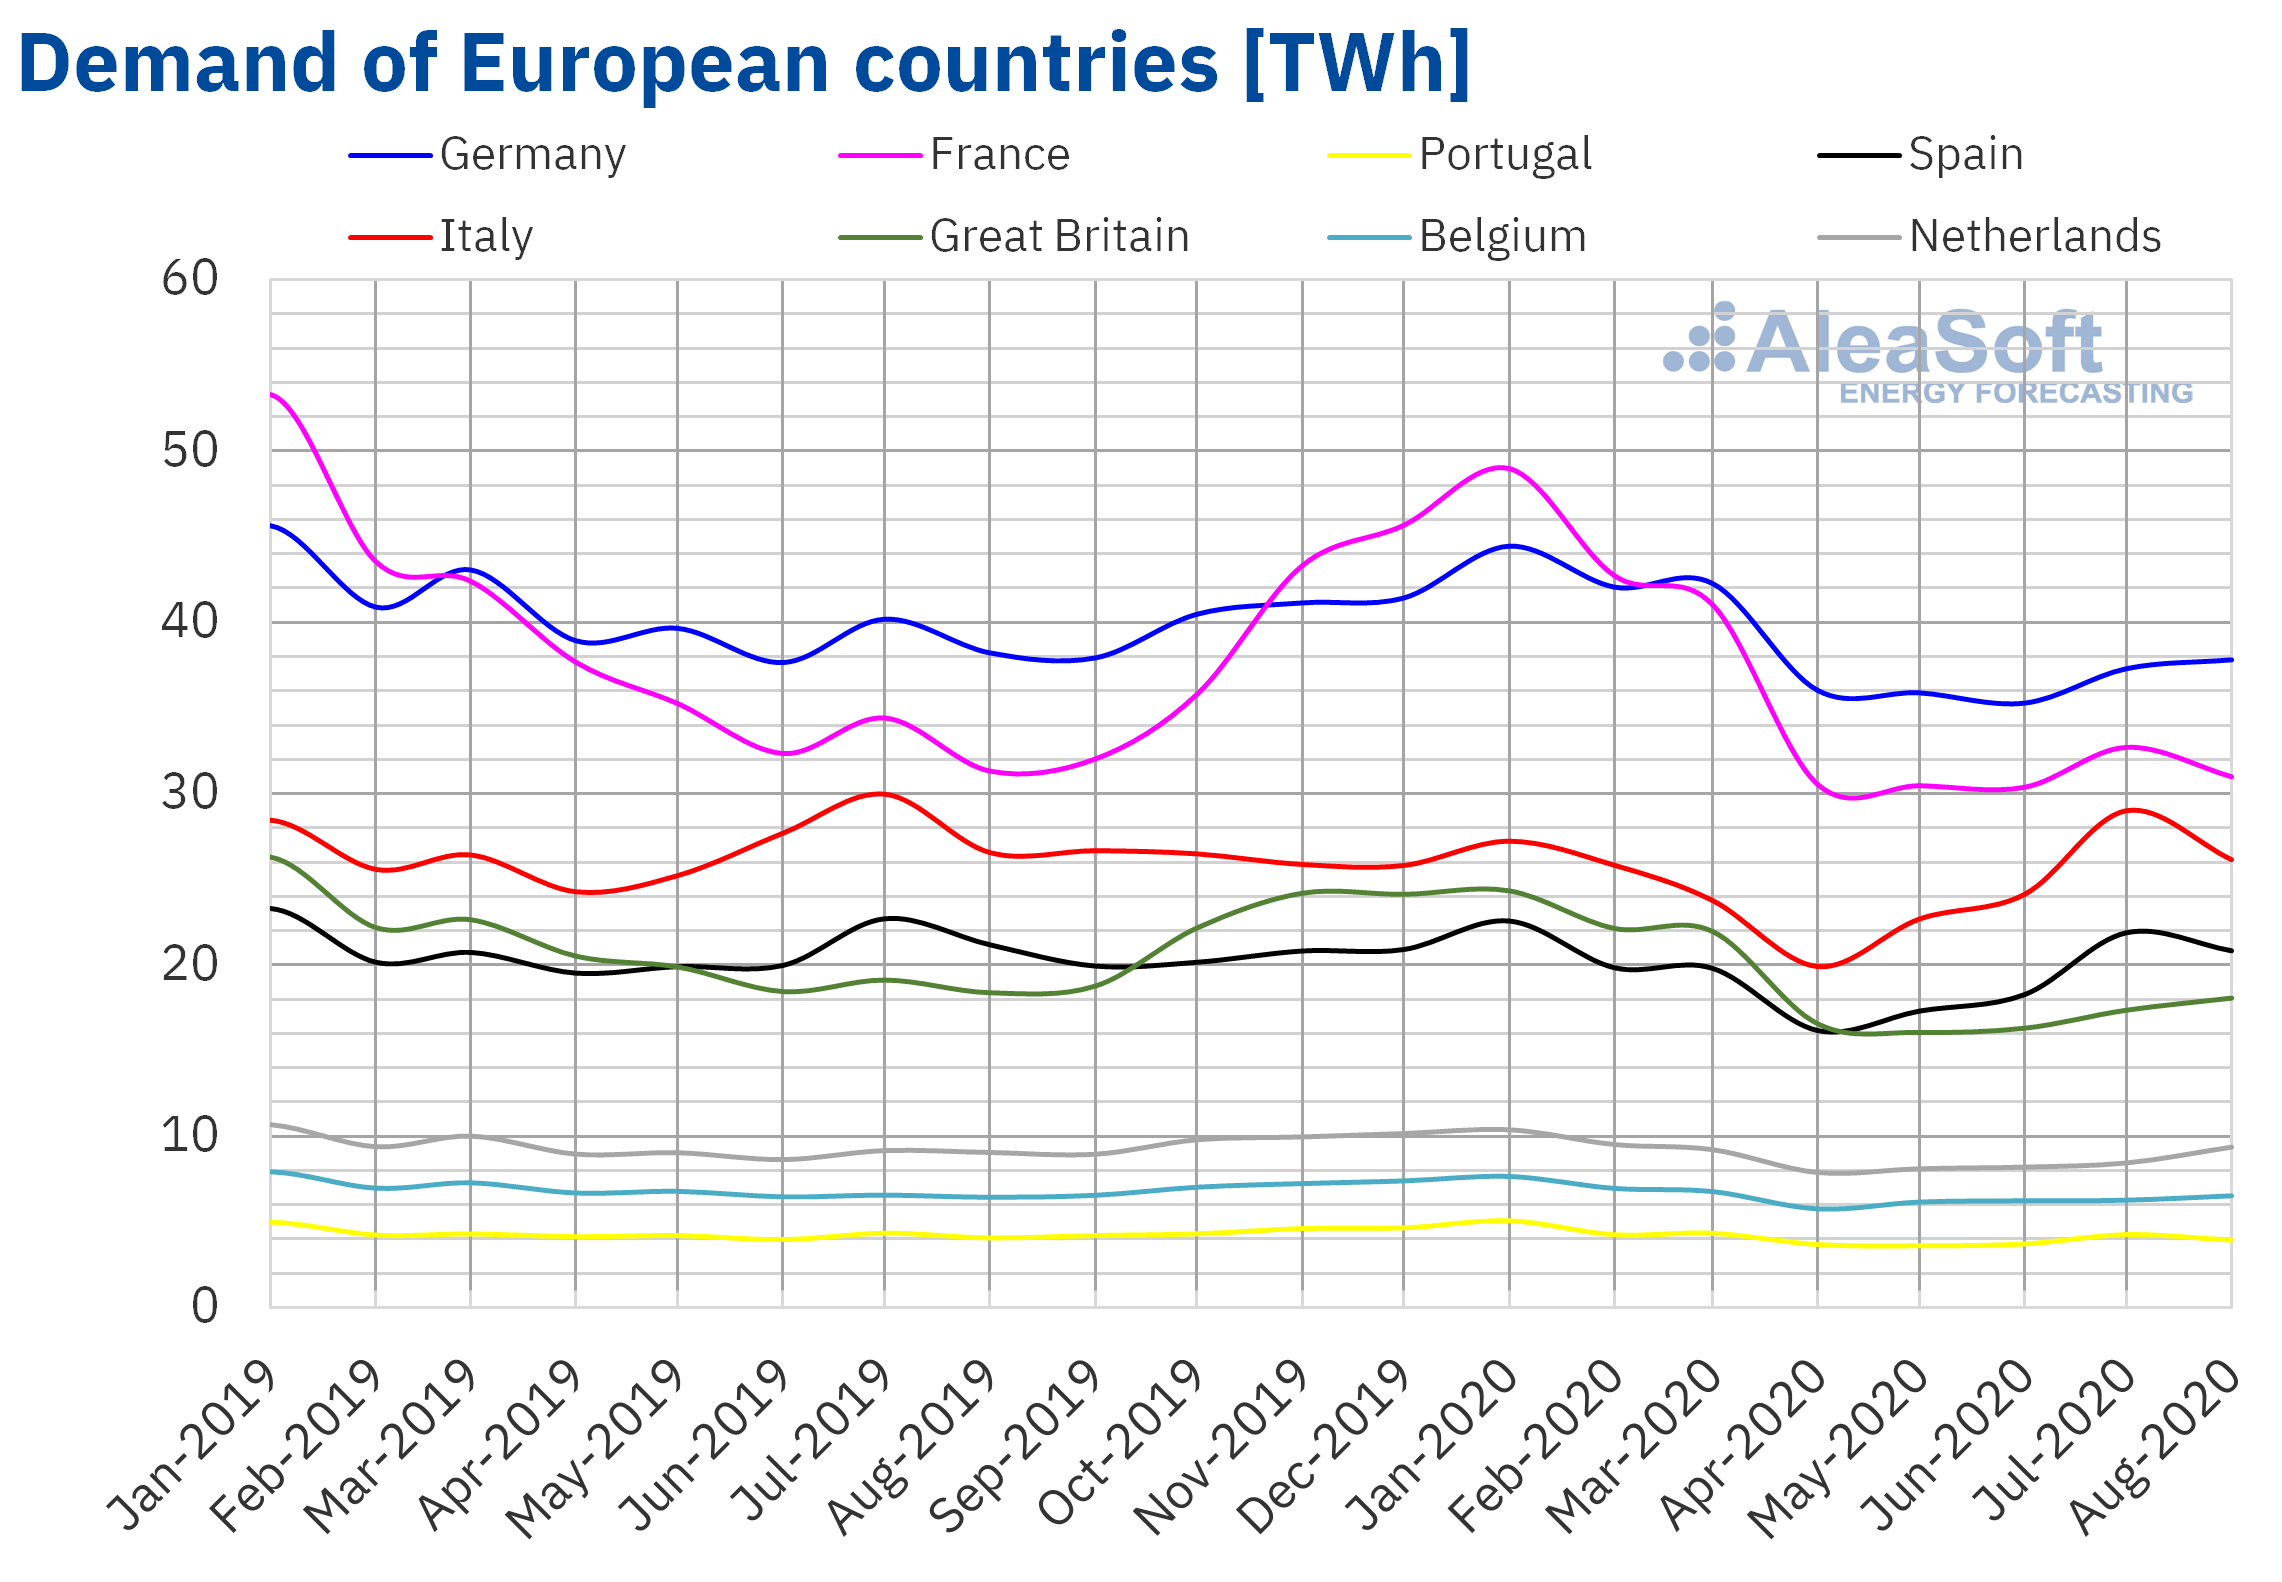
The electricity demand in most European markets fell in August in year‑on‑year terms, although the temperatures of this month in 2020 were generally warmer than those of the same month in 2019, due to the effects of the economic crisis caused by the pandemic of COVID‑19. The largest decreases occurred in Spain and the United Kingdom, in both cases 1.7%, followed by Italy with 1.6%. On the other hand, in Belgium and the Netherlands the demand increased by 1.3% and 3.5% respectively.
With respect to the month of July, there were more notable decreases, due to the decrease in labour activity, the largest drop being that of Italy, of 9.8%. Other markets where the demand fell were those of Portugal, France and Spain. In the rest of the analysed markets, the demand rose, in some cases such as Great Britain, Belgium and the Netherlands above 4%.
 Source: Prepared by AleaSoft using data from ENTSO-E, RTE, REN, REE, TERNA, National Grid and ELIA.
Mainland Spain, photovoltaic and solar thermal energy production and wind energy production
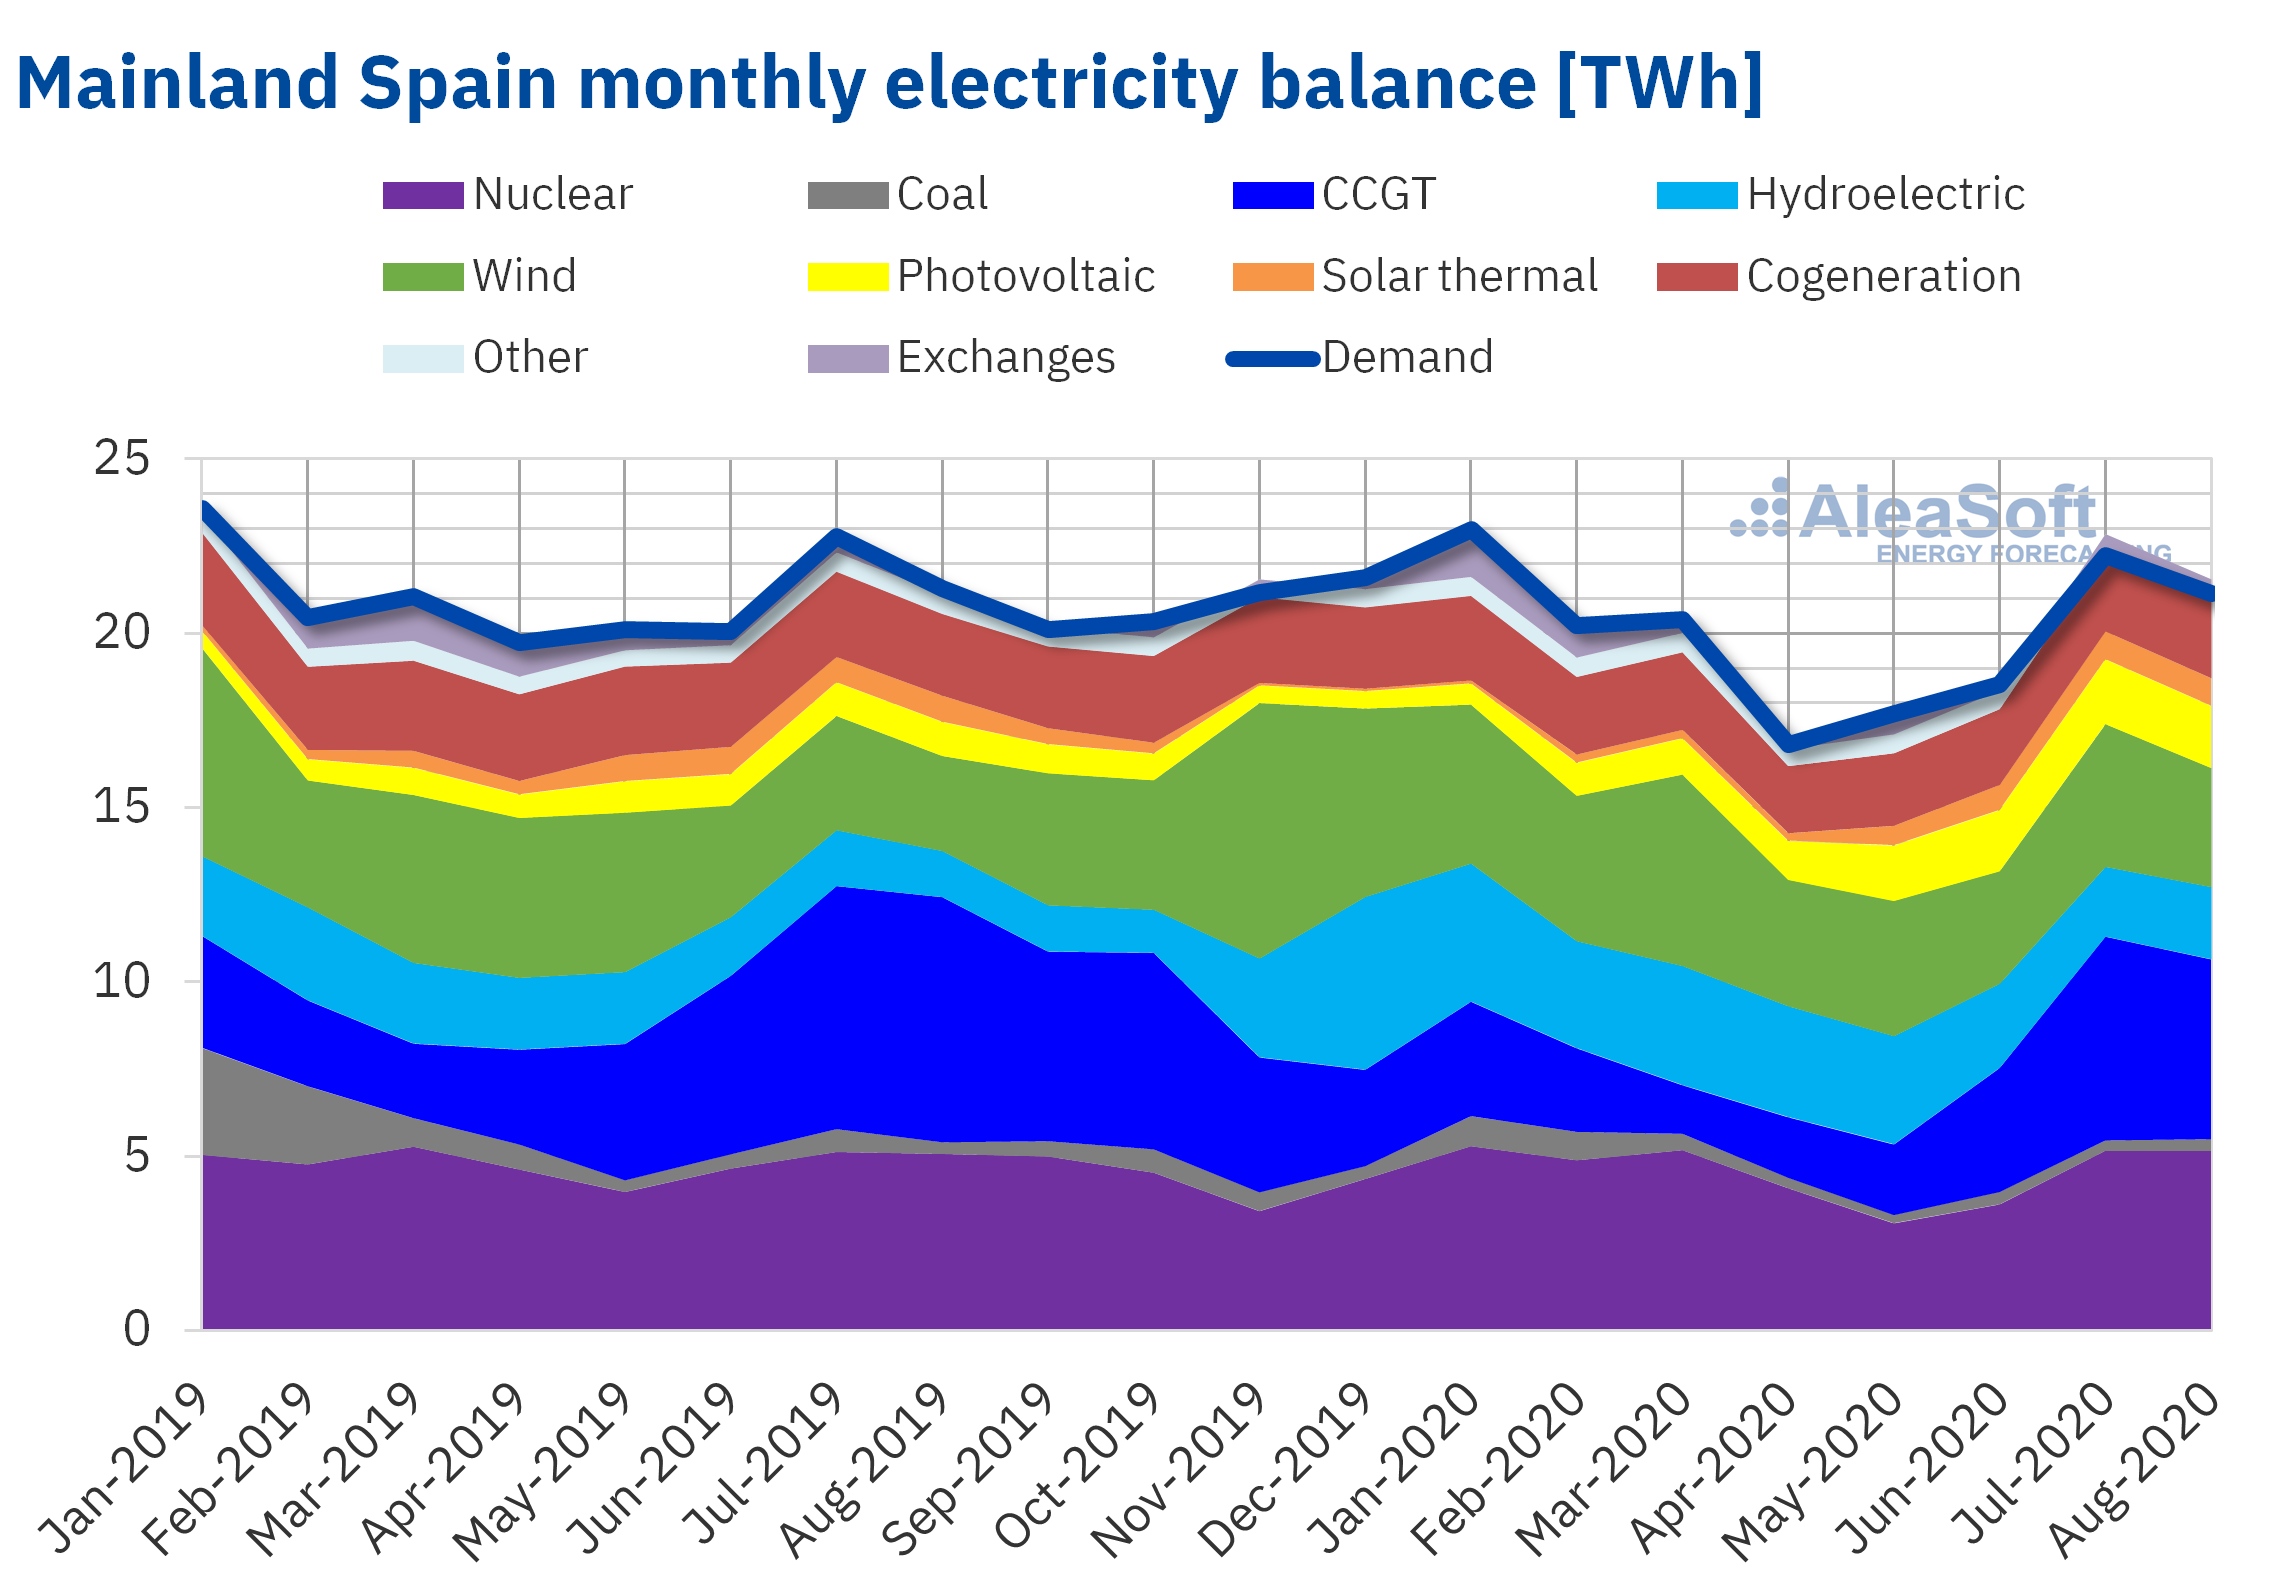
The electricity demand of Mainland Spain fell by 1.7% year‑on‑year in the month of August just ended. According to Red Eléctrica de España (REE), once the effects of temperature and labour were corrected, the drop in demand stands at 2.6%. With respect to July, the decline was greater, of 4.8%, justified by the decrease in the labour activity.
The photovoltaic energy production of Mainland Spain during the month of August increased by 83% in year‑on‑year terms. Regarding the solar thermal energy, there was an increase of 5.9%. As a whole, the solar energy production increased by 49% compared to August 2019. In relation to the month of July, the solar energy production in August was 3.3% lower, with decreases in both the photovoltaic energy production and the solar thermal energy production, of 4.2% and 1.3% respectively.
Regarding the wind energy production, there was an increase of 25% compared to the production of August 2019. On the other hand, compared to July of this year, the production with this technology decreased by 17%.
The hydroelectric energy production during the month of August increased by 54% in year‑on‑year terms, while, compared to July of this year, the increase was more moderate, of 4.9%.
The hydroelectric reserves increased by 24% compared to August 2019. However, they decreased by 7.9% compared to July of this year.
The production with combined cycle gas turbines in August was 5145 GWh. This value is 27% lower than that of the same month of 2019, and 12% lower than that of July of this year.
During the eighth month of the year all the nuclear power plants were in operation. The nuclear energy production varied by 1.7% compared to the same month of the previous year and ‑0.1% compared to July of this year.
 Sources: Prepared by AleaSoft using data from REE.
European electricity markets
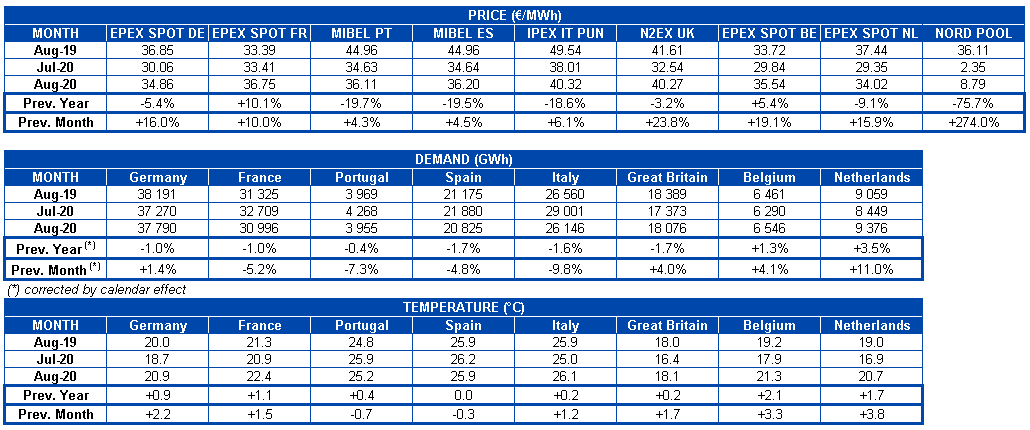
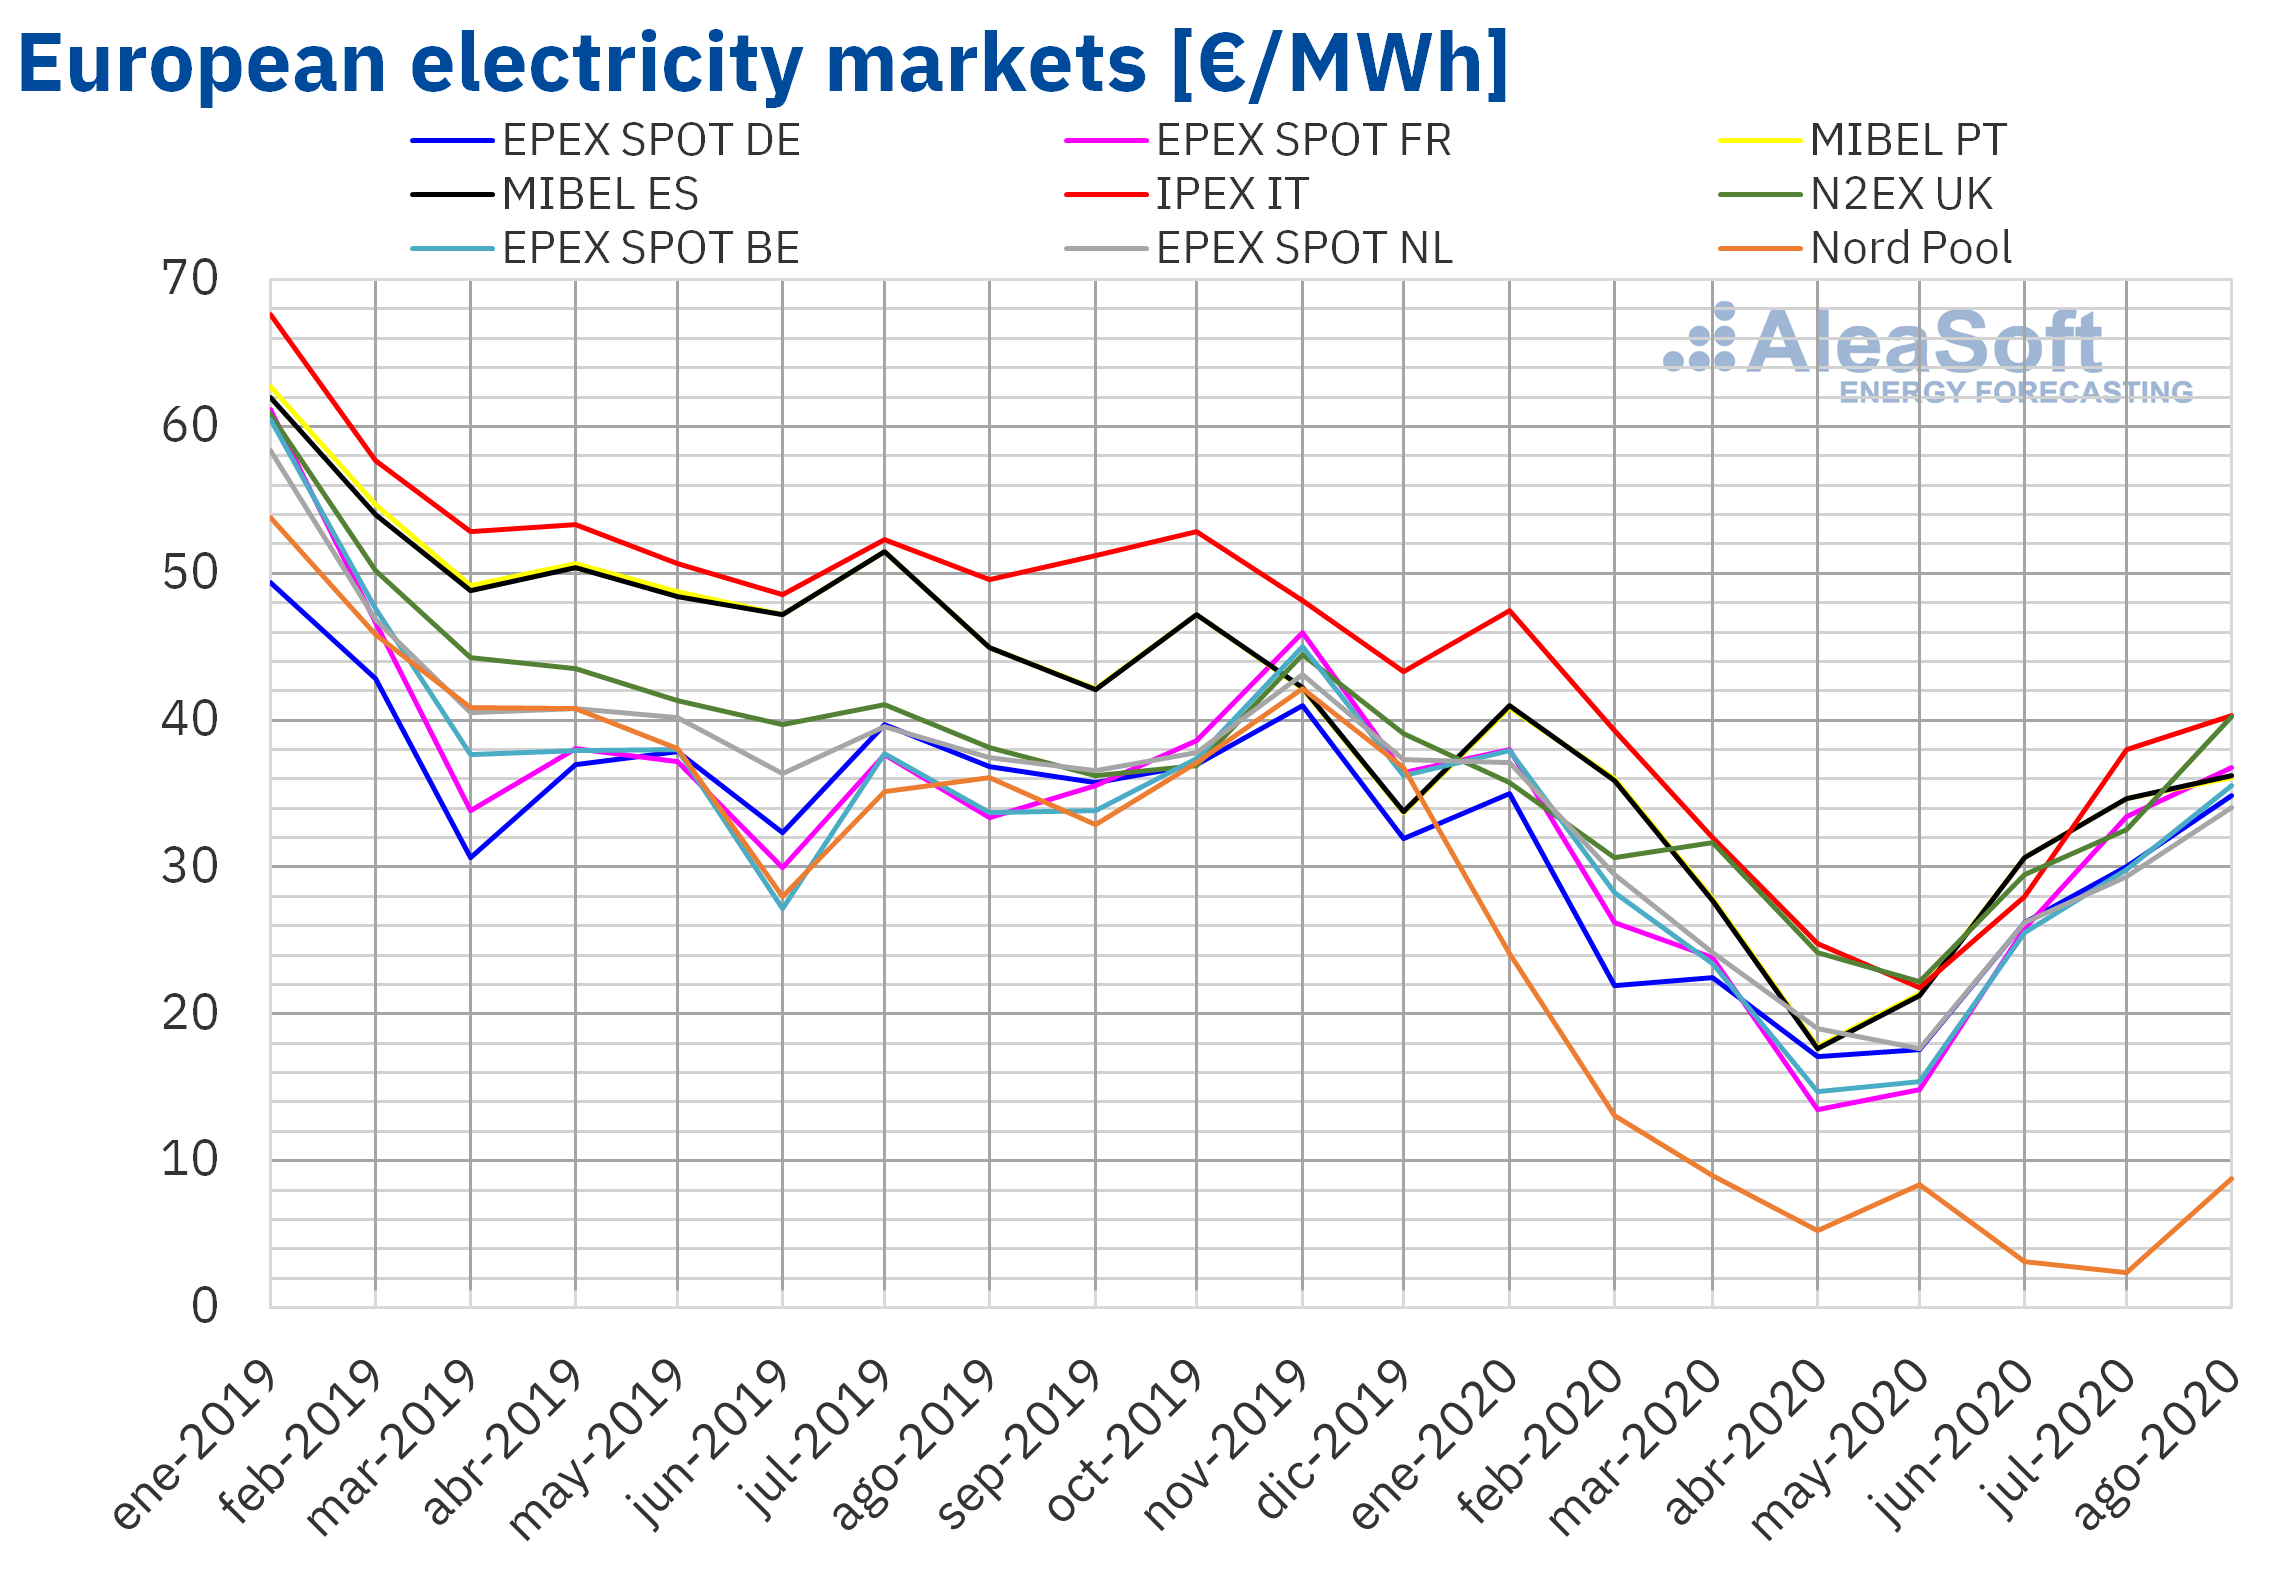
In the month of August 2020, the monthly average price was higher than €30/MWh in all the analysed European markets, except in the Nord Pool market of the Nordic countries, which registered the lowest average, of €8.79/MWh. In contrast, the IPEX market of Italy and the N2EX market of Great Britain reached the highest monthly average prices, of €40.32/MWh and €40.27/MWh, respectively. In the rest of the markets, the averages were between €34.02/MWh of the EPEX SPOT market of the Netherlands and €36.75/MWh of the French market.
Compared to the month of July, the average prices of the European electricity markets analysed at AleaSoft increased in August. The highest price rise, of 274%, was registered in the Nord Pool market. While the smallest increases were those of the Portuguese, Spanish and Italian markets, with rises of 4.3%, 4.5% and 6.1% respectively. In the rest of the markets, the increases were between 10% of the EPEX SPOT market of France and 24% of the N2EX market.
If the average prices of last August are compared to those registered in the same month of 2019, there were decreases in most of the markets. The exceptions were the Belgian and French markets, where there were increases of 5.4% and 10% respectively. On the other hand, the largest decrease, of 76%, occurred in the Nord Pool market and the smallest, of 3.2%, in the N2EX market. In the rest of the markets, the price drops were between 5.4% of Germany and 20% of Portugal.
As for the daily prices, on Monday, August 24, they exceeded €50/MWh in Great Britain and on Thursday, August 27, prices above that value were reached in Belgium, France, Great Britain and Italy. There were also daily prices greater than €50/MWh on Monday, August 31, in Germany, Belgium, France, Italy, Great Britain and the Netherlands. The highest daily price, of €61.84/MWh, was reached on Thursday, August 27, in the British market.
Instead, the lowest daily prices of August were reached in the Nord Pool market. The minimum daily price, of €1.60/MWh, was that of Sunday, August 2.
Regarding the hourly prices, during the month of August, negative hourly prices were registered in the German market on August 23 and 26. The lowest price, of ‑€16.18/MWh, was that of the hour 14 of August 23. On the other hand, on August 27 at the hour 19, an hourly price of €110.64/MWh was reached in Great Britain, the highest in this market since the beginning of March.
 Source: Prepared by AleaSoft using data from OMIE, , N2EX, IPEX and Nord Pool.
During the month of August, the European electricity markets prices increased compared to the previous month, influenced by the decrease in renewable energy production and the recovery in gas prices. However, compared to August 2019, the prices were, in general, lower, favoured by the year‑on‑year increase in wind and solar energy production in Europe, by the decrease in gas prices and by the fact that the electricity demand was lower than that of the same month of 2019 in most European markets.
Iberian market
In the month of August 2020, the average price in the MIBEL market increased compared to the average of the previous month. The increases were 4.3% in Portugal and 4.5% in Spain, with the price increase in Portugal being the lowest in Europe. On the other hand, compared to August 2019, the prices fell by 20% in Portugal and 19% in Spain. These were the second and third most important price drops in the European electricity markets after that of the Nord Pool market.
The monthly average price of August was €36.20/MWh in the Spanish market and €36.11/MWh in the Portuguese market. But the daily prices exceeded €40/MWh in the MIBEL market on August 13, 27 and 31. The highest daily price, of €46.25/MWh, was reached on Thursday, August 27, in Spain.
The decrease in solar energy production in the Iberian Peninsula and in wind energy production in Spain compared to July 2020, together with the recovery in gas prices, allowed the MIBEL market prices to increase in August.
On the other hand, when comparing to August 2019, the increase in renewable wind and solar energy production in the Iberian Peninsula, in addition to the decrease in electricity demand and in gas prices, favoured the price falls in the MIBEL market in August 2020 compared to the same month of 2019.
Electricity futures
When analysing the behaviour of the electricity futures prices for the last quarter of 2020 during the month of August, a marked upward trend can be seen. The comparison between the settlement prices of the first and last sessions of the markets in this month show increases that go from 9.9% of the ICE market of Belgium to 67% of the ICE market of the Nordic countries. Out of the countries whose futures are traded on the EEX market and which are analysed at AleaSoft, the German market was the one with the highest growth, with 32%.
If the same analysis is performed on the product of the calendar year 2021, the results are similar. The markets registered price increases, this time to a lesser extent, although 31% of the ICE market of the Nordic countries, which was the largest in relative terms, and the increase of almost €10/MWh in the EEX market of Germany between the beginning and the end of August are still considerable.
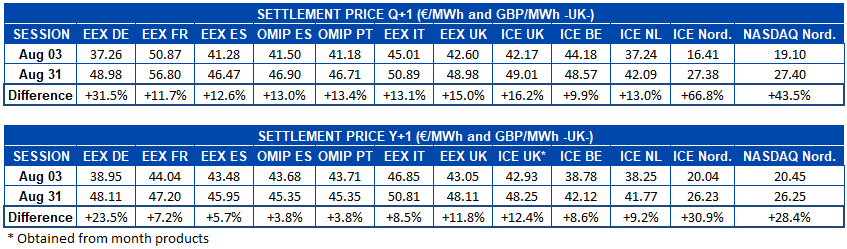
The Iberian OMIP market, in which the electricity futures of Spain and Portugal are traded, was the one with the lowest increase in the annual product prices, with only a 3.8% increase in both countries. It was followed in the list of markets with the lowest variation precisely by the EEX market of Spain, with 5.7%. In the case of the futures prices for Q4‑20, in the OMIP and EEX markets there were increases of 13% compared to the settlement prices of the session of August 3.
Brent, fuels and CO2
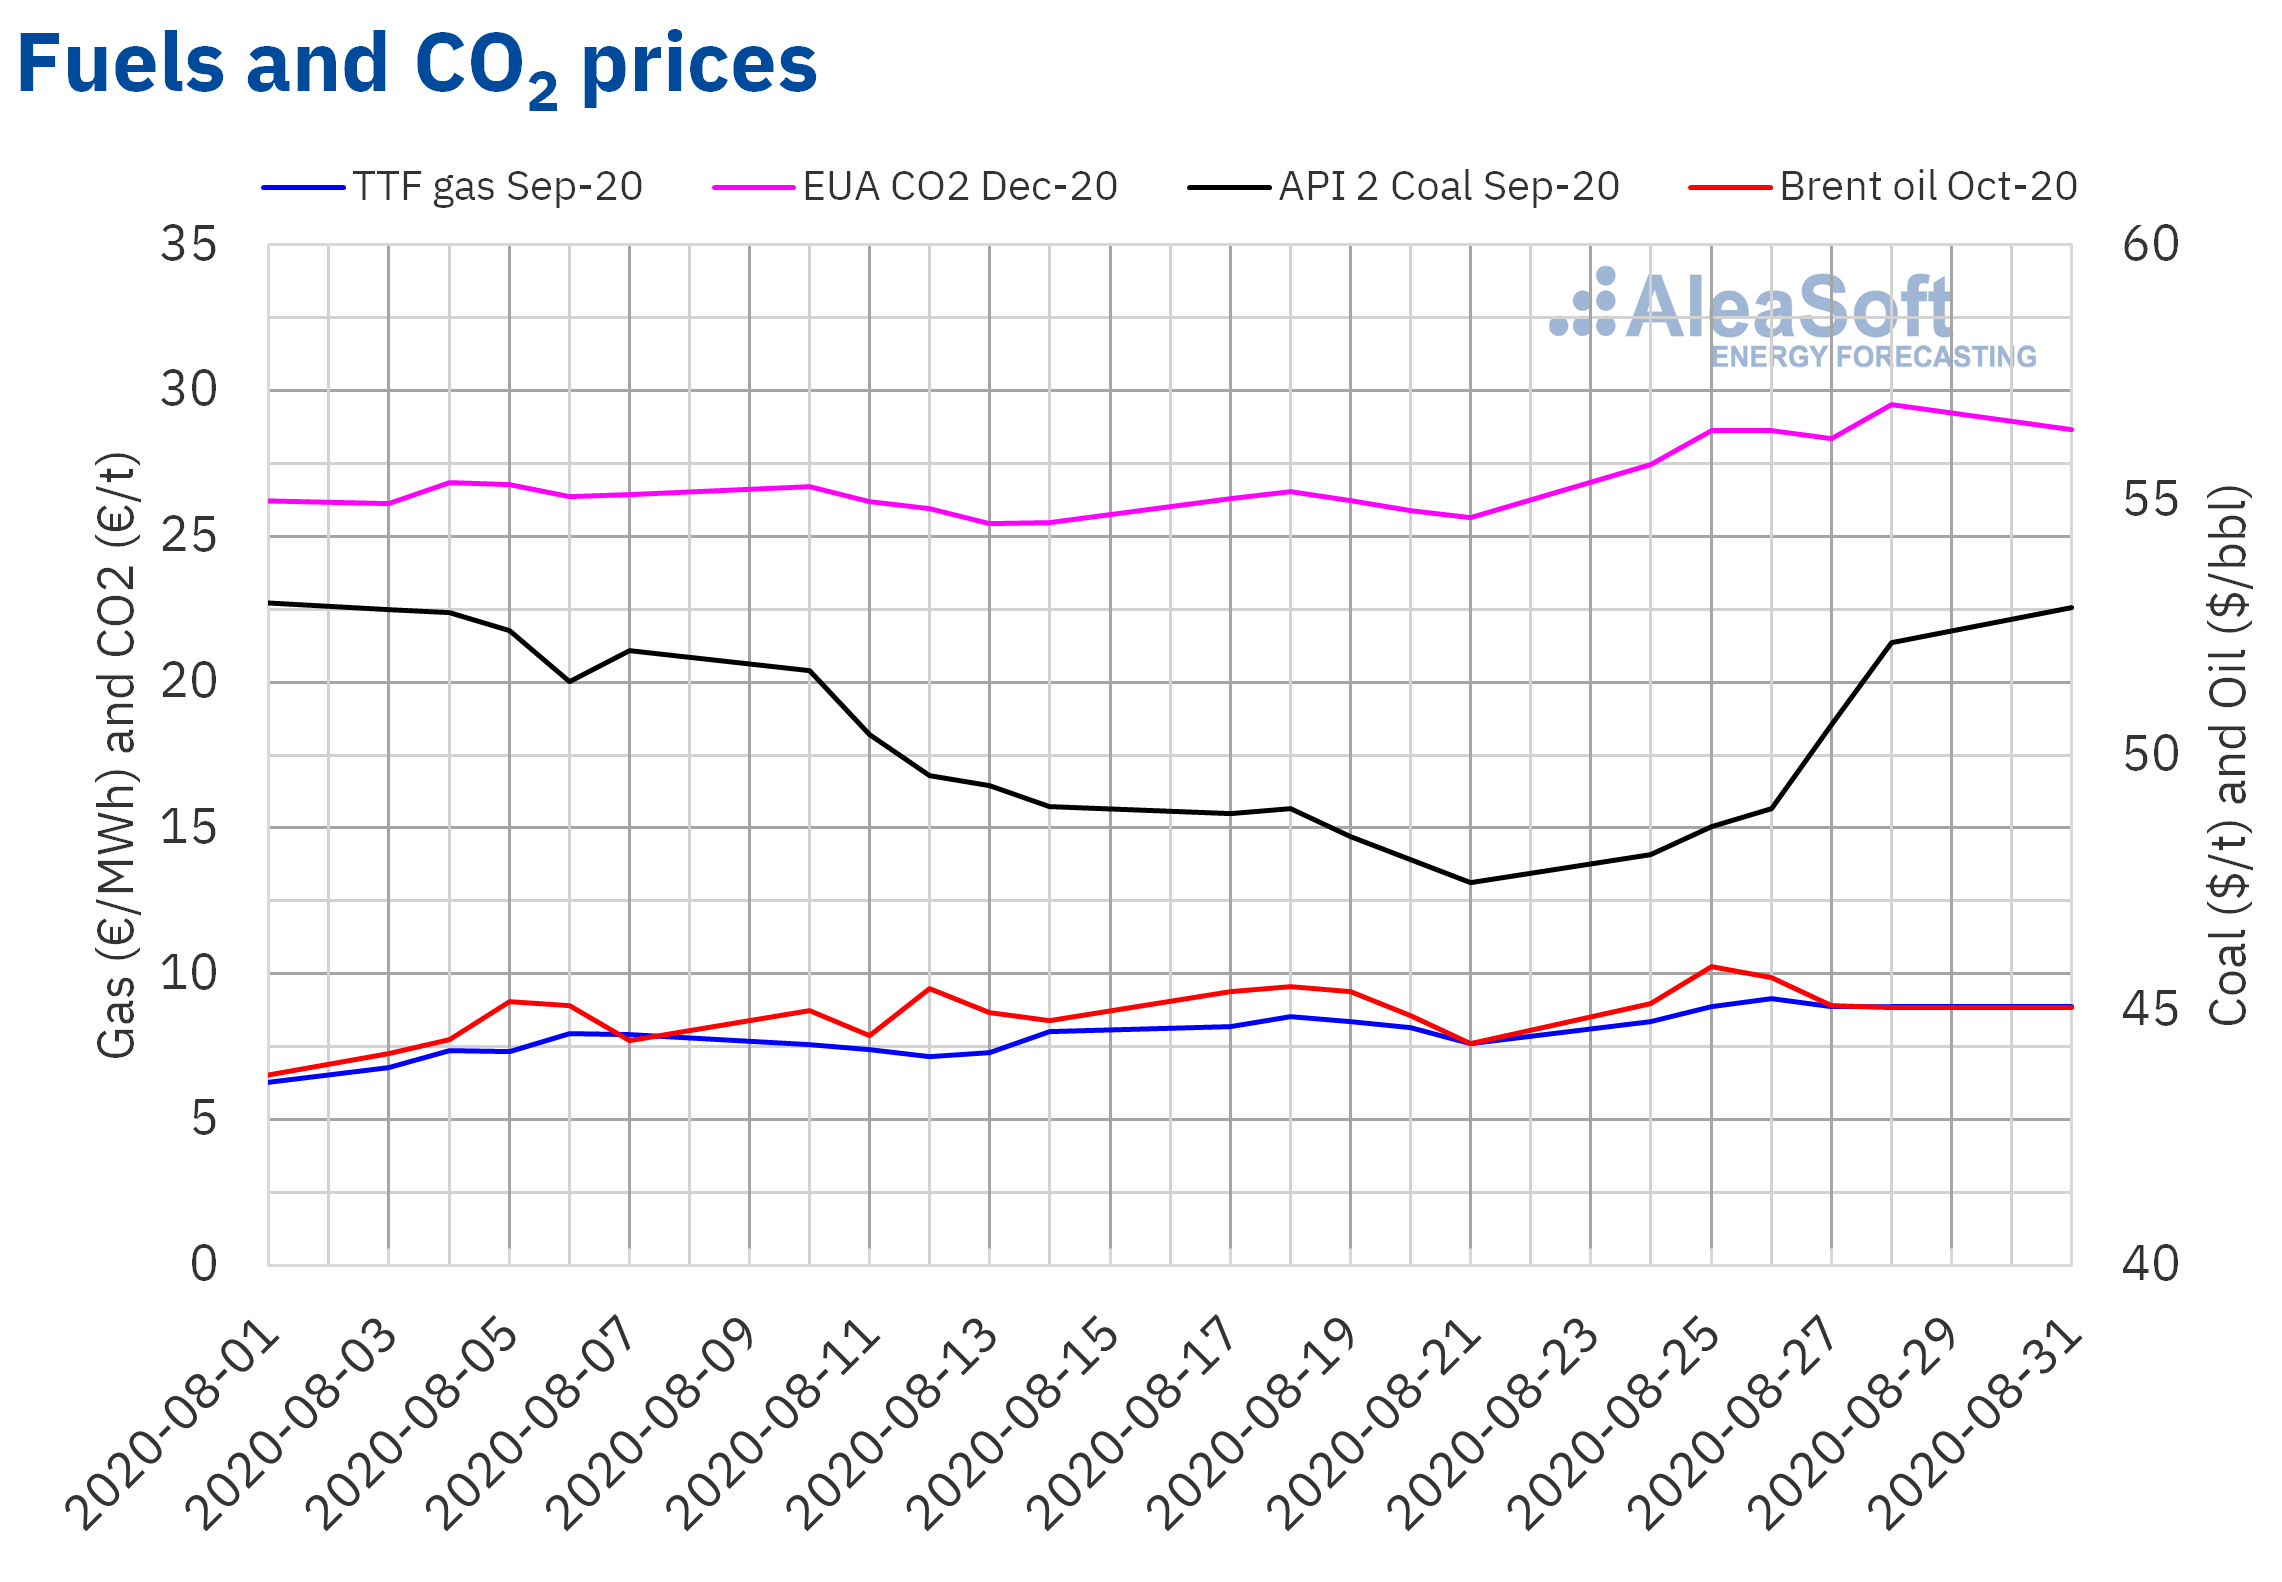
The Brent oil futures prices for October 2020 in the ICE market during the month of August fluctuated, but remained above $44/bbl. The monthly minimum settlement price of $44.15/bbl was reached on Monday, August 3, in the first session of the month. On the other hand, the monthly maximum settlement price, of $45.86/bbl, was reached on August 25. But in the last sessions of the month, the prices fell and on August 28 the settlement price was $45.05/bbl. On the other hand, the monthly average was $45.01/bbl. This value is 4.1% higher than that reached by the futures for the month M+2 in July 2020, of $43.22/bbl, but still 24% lower than that corresponding to the M+2 futures traded on August 2019, of $59.50/bbl.
At the beginning of August, the OPEC+ member countries began to increase their production with the forecasting that the recovery in demand would make it possible to offset the increase in supply. But, the news about the increase in the number of new cases of COVID‑19 worldwide exerted its downward influence on prices. However, in the second half of the month, the decline in production in America due to the hurricanes Marco and Laura allowed the Brent oil futures prices to remain above $45/bbl.
As for the TTF gas futures prices in the ICE market for the month of September 2020, despite the setbacks registered in the second and third week of August, they ended the month with values higher than those of the first days. On Monday, August 3, the monthly minimum settlement price of €6.80/MWh was registered. While the maximum settlement price of the month, of €9.15/MWh, was reached on Wednesday, August 26. This price is the highest since the second half of March. On the other hand, the average value registered during the month was €7.95/MWh. Compared to that of the futures for the month M+1 traded in July 2020, of €5.33/MWh, the average increased by 49%. If compared to the M+1 futures traded in August 2019, when the average price was €11.28/MWh, there was a 30% decrease.
In the case of the spot market, in the month of August, the TTF gas prices had a generally upward trend. This made it possible to go from the monthly minimum index price of €5.13/MWh registered on August 1 and 2 to the monthly maximum index price of €9.63/MWh, reached on the last three days of the month. This maximum price is the highest since the second half of February. On the other hand, the average price for this month of August was €7.27/MWh, which is 48% higher than that of July 2020, of €4.92/MWh. However, it is 28% lower than that of August 2019, of €10.14/MWh.
Regarding the API 2 coal futures in the ICE market for the month of September 2020, they started August with a settlement price of $52.85/t in the first session of the month, on Monday, August 3. Subsequently, there were price declines and the monthly minimum settlement price, of $47.50/t, was reached on Friday, August 21. But on the last days of the month, the prices recovered and on Monday, August 31, the monthly maximum settlement price, of $52.90/t, was reached, which is $0.05/t higher than the settlement price registered at the start of the month. This upward trend was influenced by the strikes called in the Colombian mines at the end of the month and their possible effects on the supply of coal to Europe. The monthly average in August was $50.22/t, 0.5% lower than the average of the settlement prices of the API 2 coal futures for the month M+1 of July 2020, of $50.46/t, and 10% lower than that of August 2019, of $55.94/t.
As for the CO2 emission rights futures prices in the EEX market for the reference contract of December 2020, most of the month of August were below €27/t. The monthly minimum settlement price, of €25.43/t, was registered on August 13. But the fourth week of the month the prices increased and on Friday, August 28, the maximum settlement price, of €29.52/t, was reached. On that day, the news about the extension of the maintenance shutdowns at French nuclear power plants had an upward influence on the CO2 emission rights and gas prices. On the other hand, the average price in August was €26.87/t, 2.6% lower than that of July, of €27.59/t. If compared to the average for the month of August 2019 for the same product, of €27.24/t, the average for August 2020 is 1.4% lower.
 Source: Prepared by AleaSoft using data from ICE and EEX.
AleaSoft analysis of the recovery of the energy markets at the end of the economic crisis
The just ended month of August was marked by the outbreaks of COVID‑19 throughout the continent, something that added more uncertainty about the exit from the economic crisis generated by the pandemic. The arrival of September and with it the return to the schools, as well as the approach of autumn, are new elements that add uncertainty about what will happen in the coming months. In order to analyse the evolution of the energy markets and the financing of the renewable energy projects in this context and to provide information to all agents in the sector, at AleaSoft the series of webinars “Energy markets in the recovery of the economic crisis” is being organised. Another topic that will be discussed will be the importance of the forecasting in the audits and in the portfolio valuation. This series of webinars will consist of two parts, the first of which will be held on the next 17th and the second will be at the end of October, on the 29th, and will feature speakers from Deloitte, Engie, Banco Sabadell and AleaSoft.
In these uncertain times it is of great value to have scientifically based coherent forecasting. At AleaSoft we regularly update our price curves in the medium and long term taking into account the most recent economic recovery scenarios.
Another tool that allows analysing the evolution of the energy markets are the AleaSoft’s observatories, which allow visualising the main variables of the European electricity, fuels and CO2 emission rights markets with daily updated data.
Source: AleaSoft Energy Forecasting.