AleaSoft, June 29, 2020. The prices of most European electricity markets rose during the week of June 22. The increase in demand, due to the fact that the measures to curb COVID‑19 are being eased and the rise in temperatures, was the fundamental cause. However, for the arrival of July the temperatures are expected to be less warm in most of the continent, driving down the demand. The increase in wind energy production will be added to this, which will favour the decrease in prices.
Photovoltaic and solar thermal energy production and wind energy production
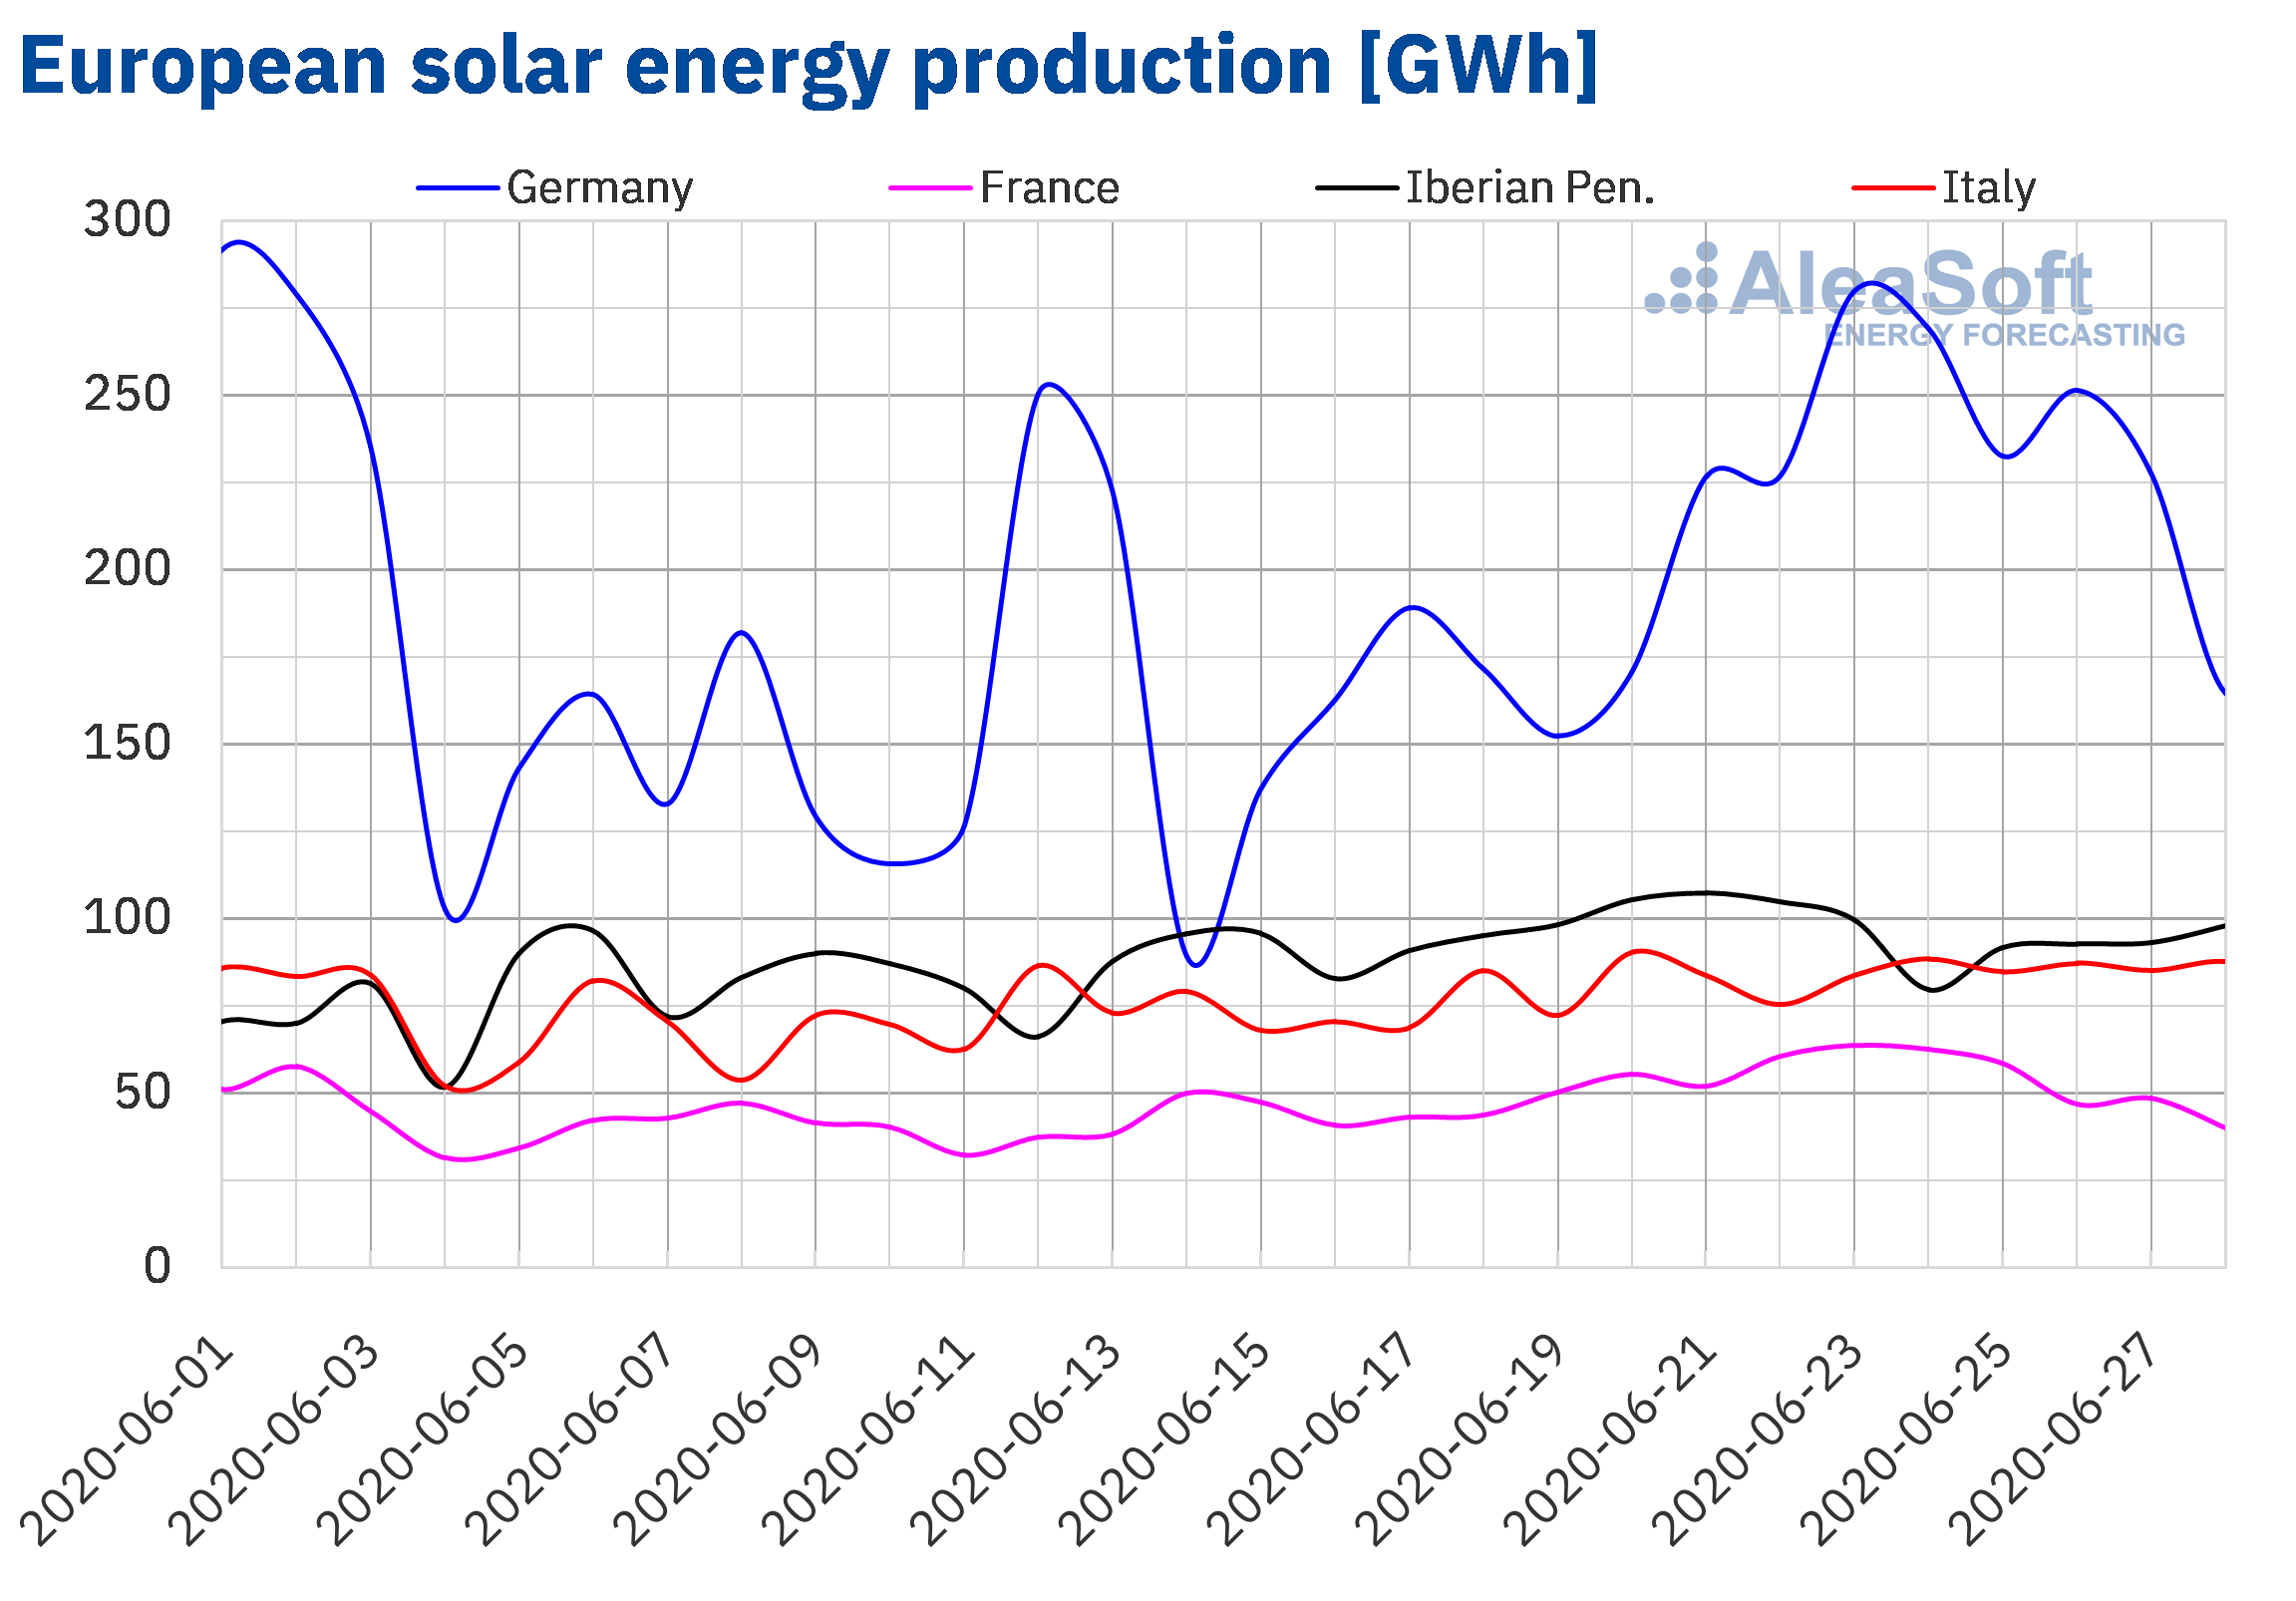
The solar energy production during the week from Monday, June 22, to Sunday, June 28, increased by 37% in the German market compared to the previous week. In the French market it increased by 14% while in the Italian it increased by 9.9%. Out of the markets analysed at AleaSoft, the only markets that registered a decrease in their production during that week compared to the week of June 15 were those of Portugal and Spain, which ended with 4.7% and 2.2% less solar energy production respectively.
However, during the month of June until Sunday, June 28, the solar energy production of the Iberian Peninsula was 47% higher compared to the same days of 2019. In the Italian and the French markets, the increase in production was 5.3% and 3.1% respectively. In contrast, in the German market the solar energy production during the elapsed days of the month was 10% lower.
For this week the AleaSoft‘s solar energy production forecasting indicates a decrease in most of the analysed markets.
 Source: Prepared by AleaSoft using data from ENTSO-E, RTE, REN, REE and TERNA.
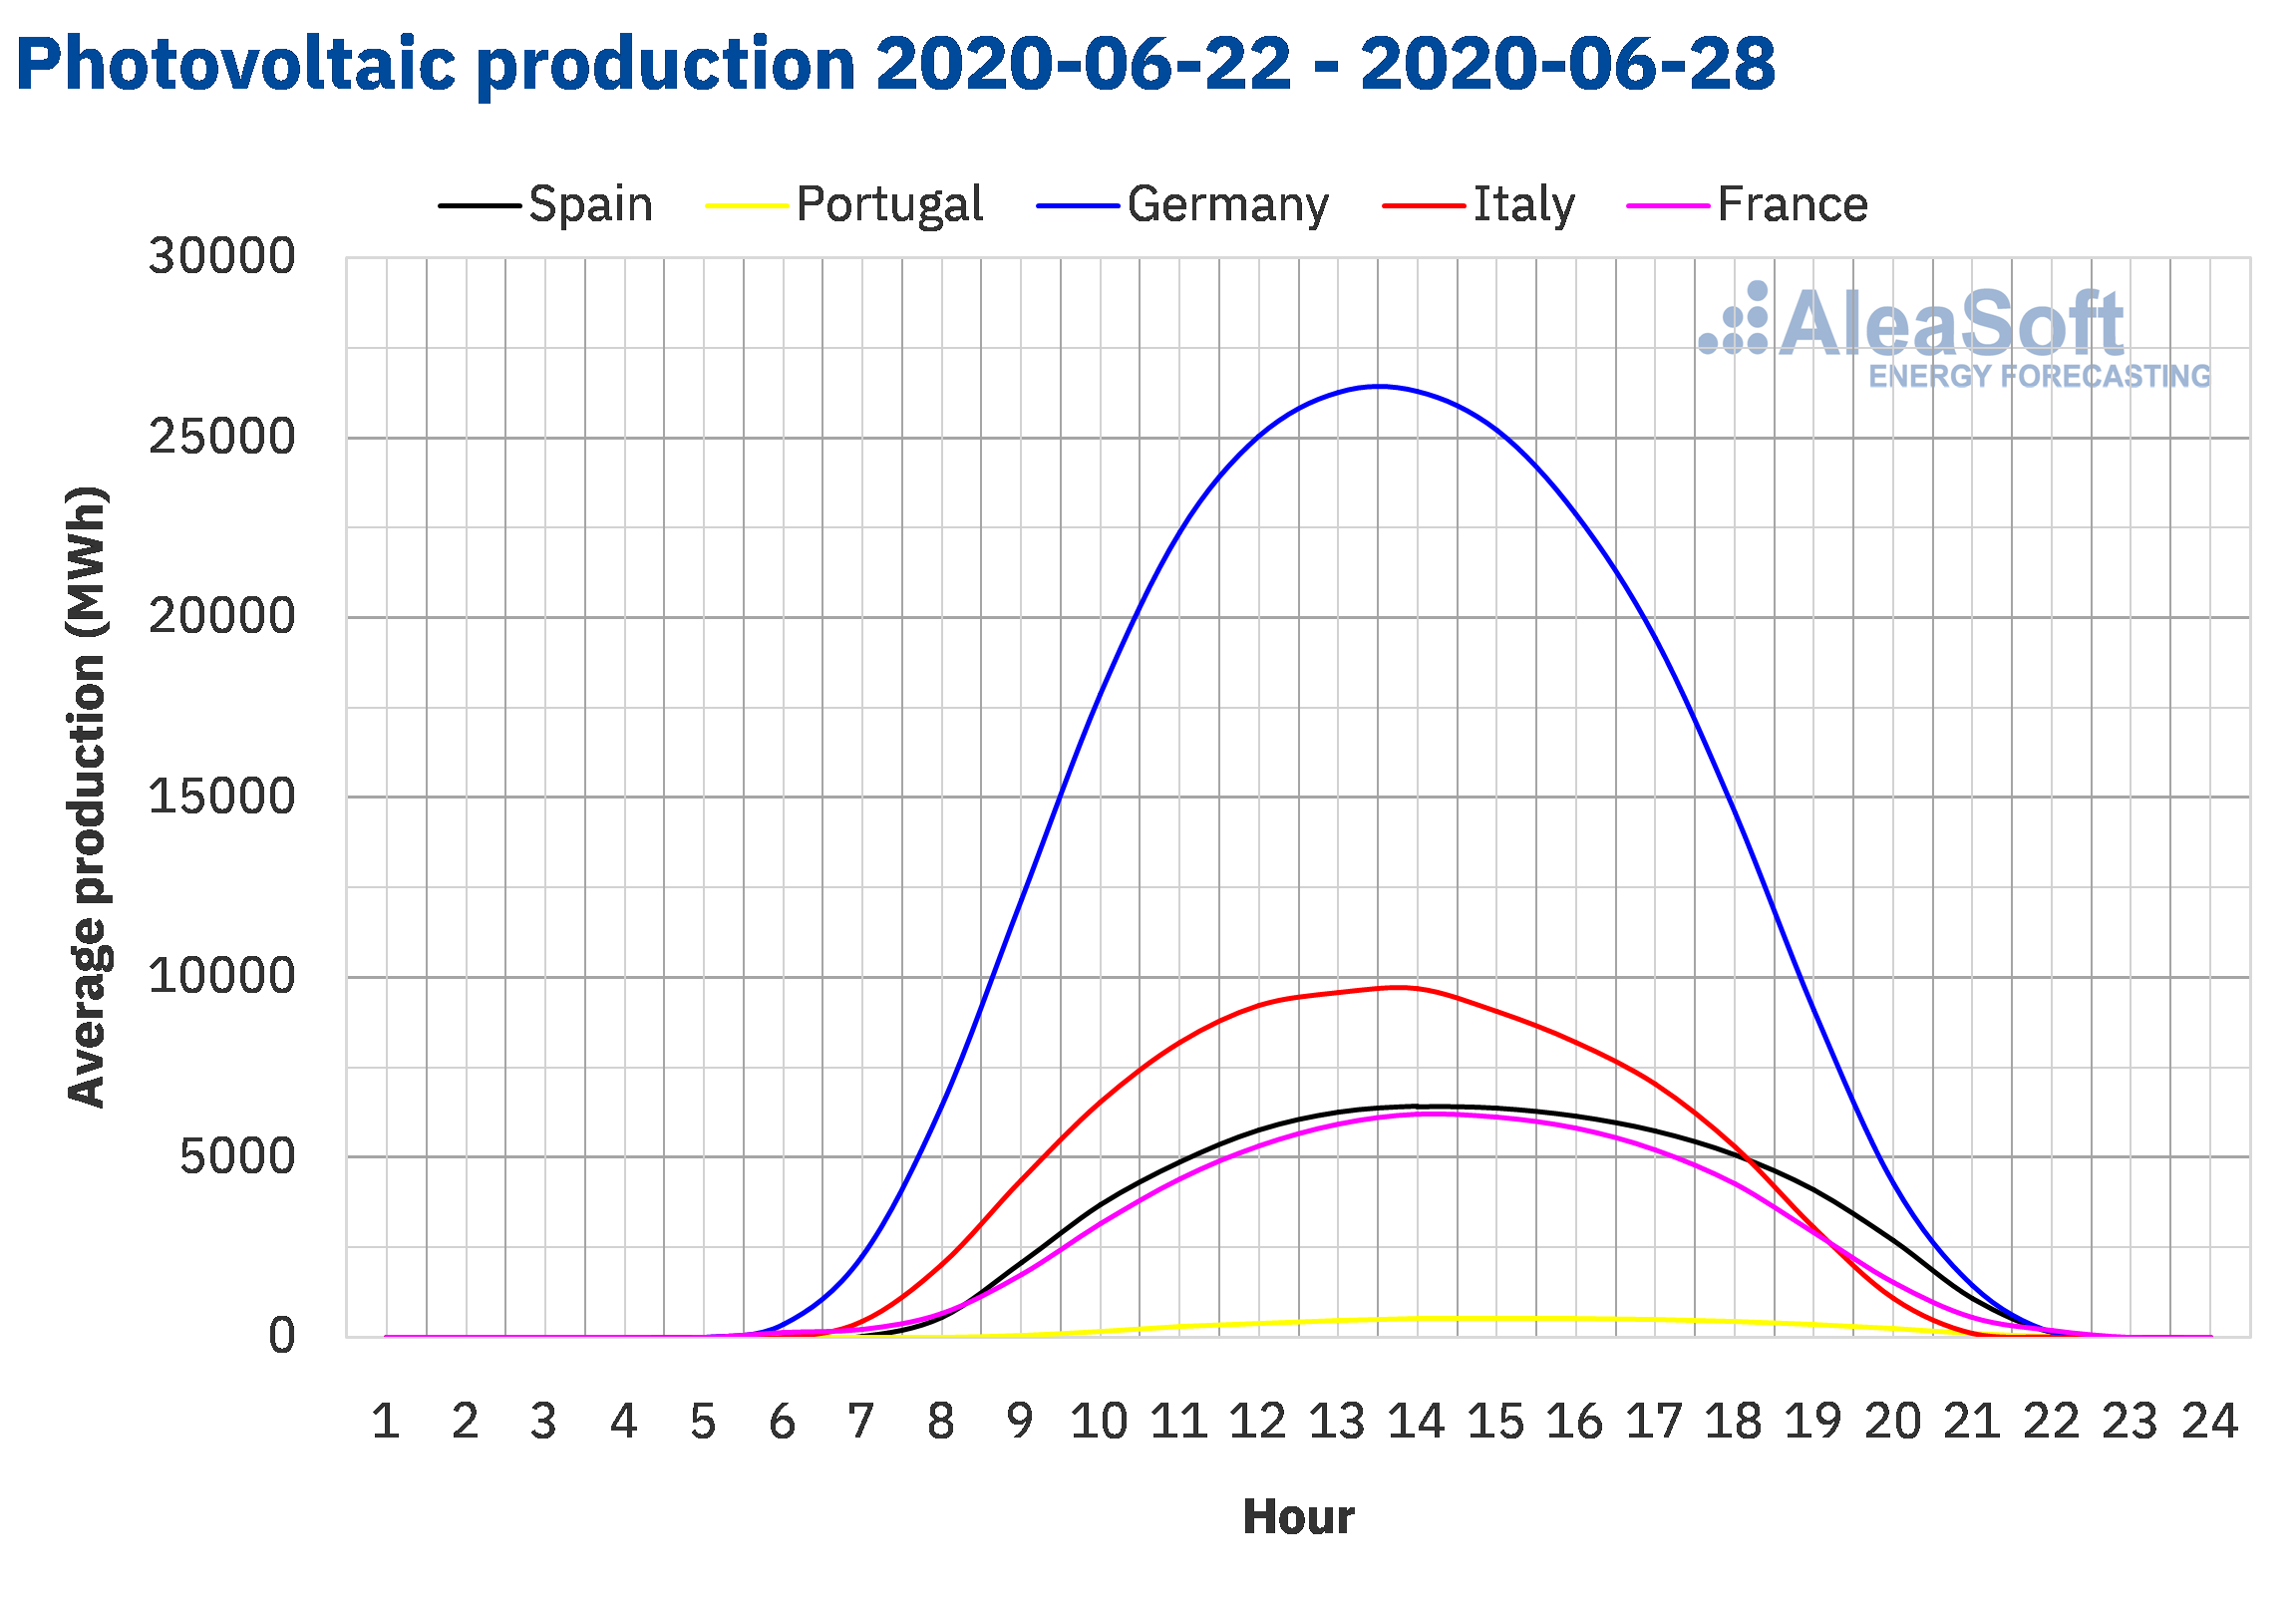 Source: Prepared by AleaSoft using data from ENTSO-E, RTE, REN, REE and TERNA.
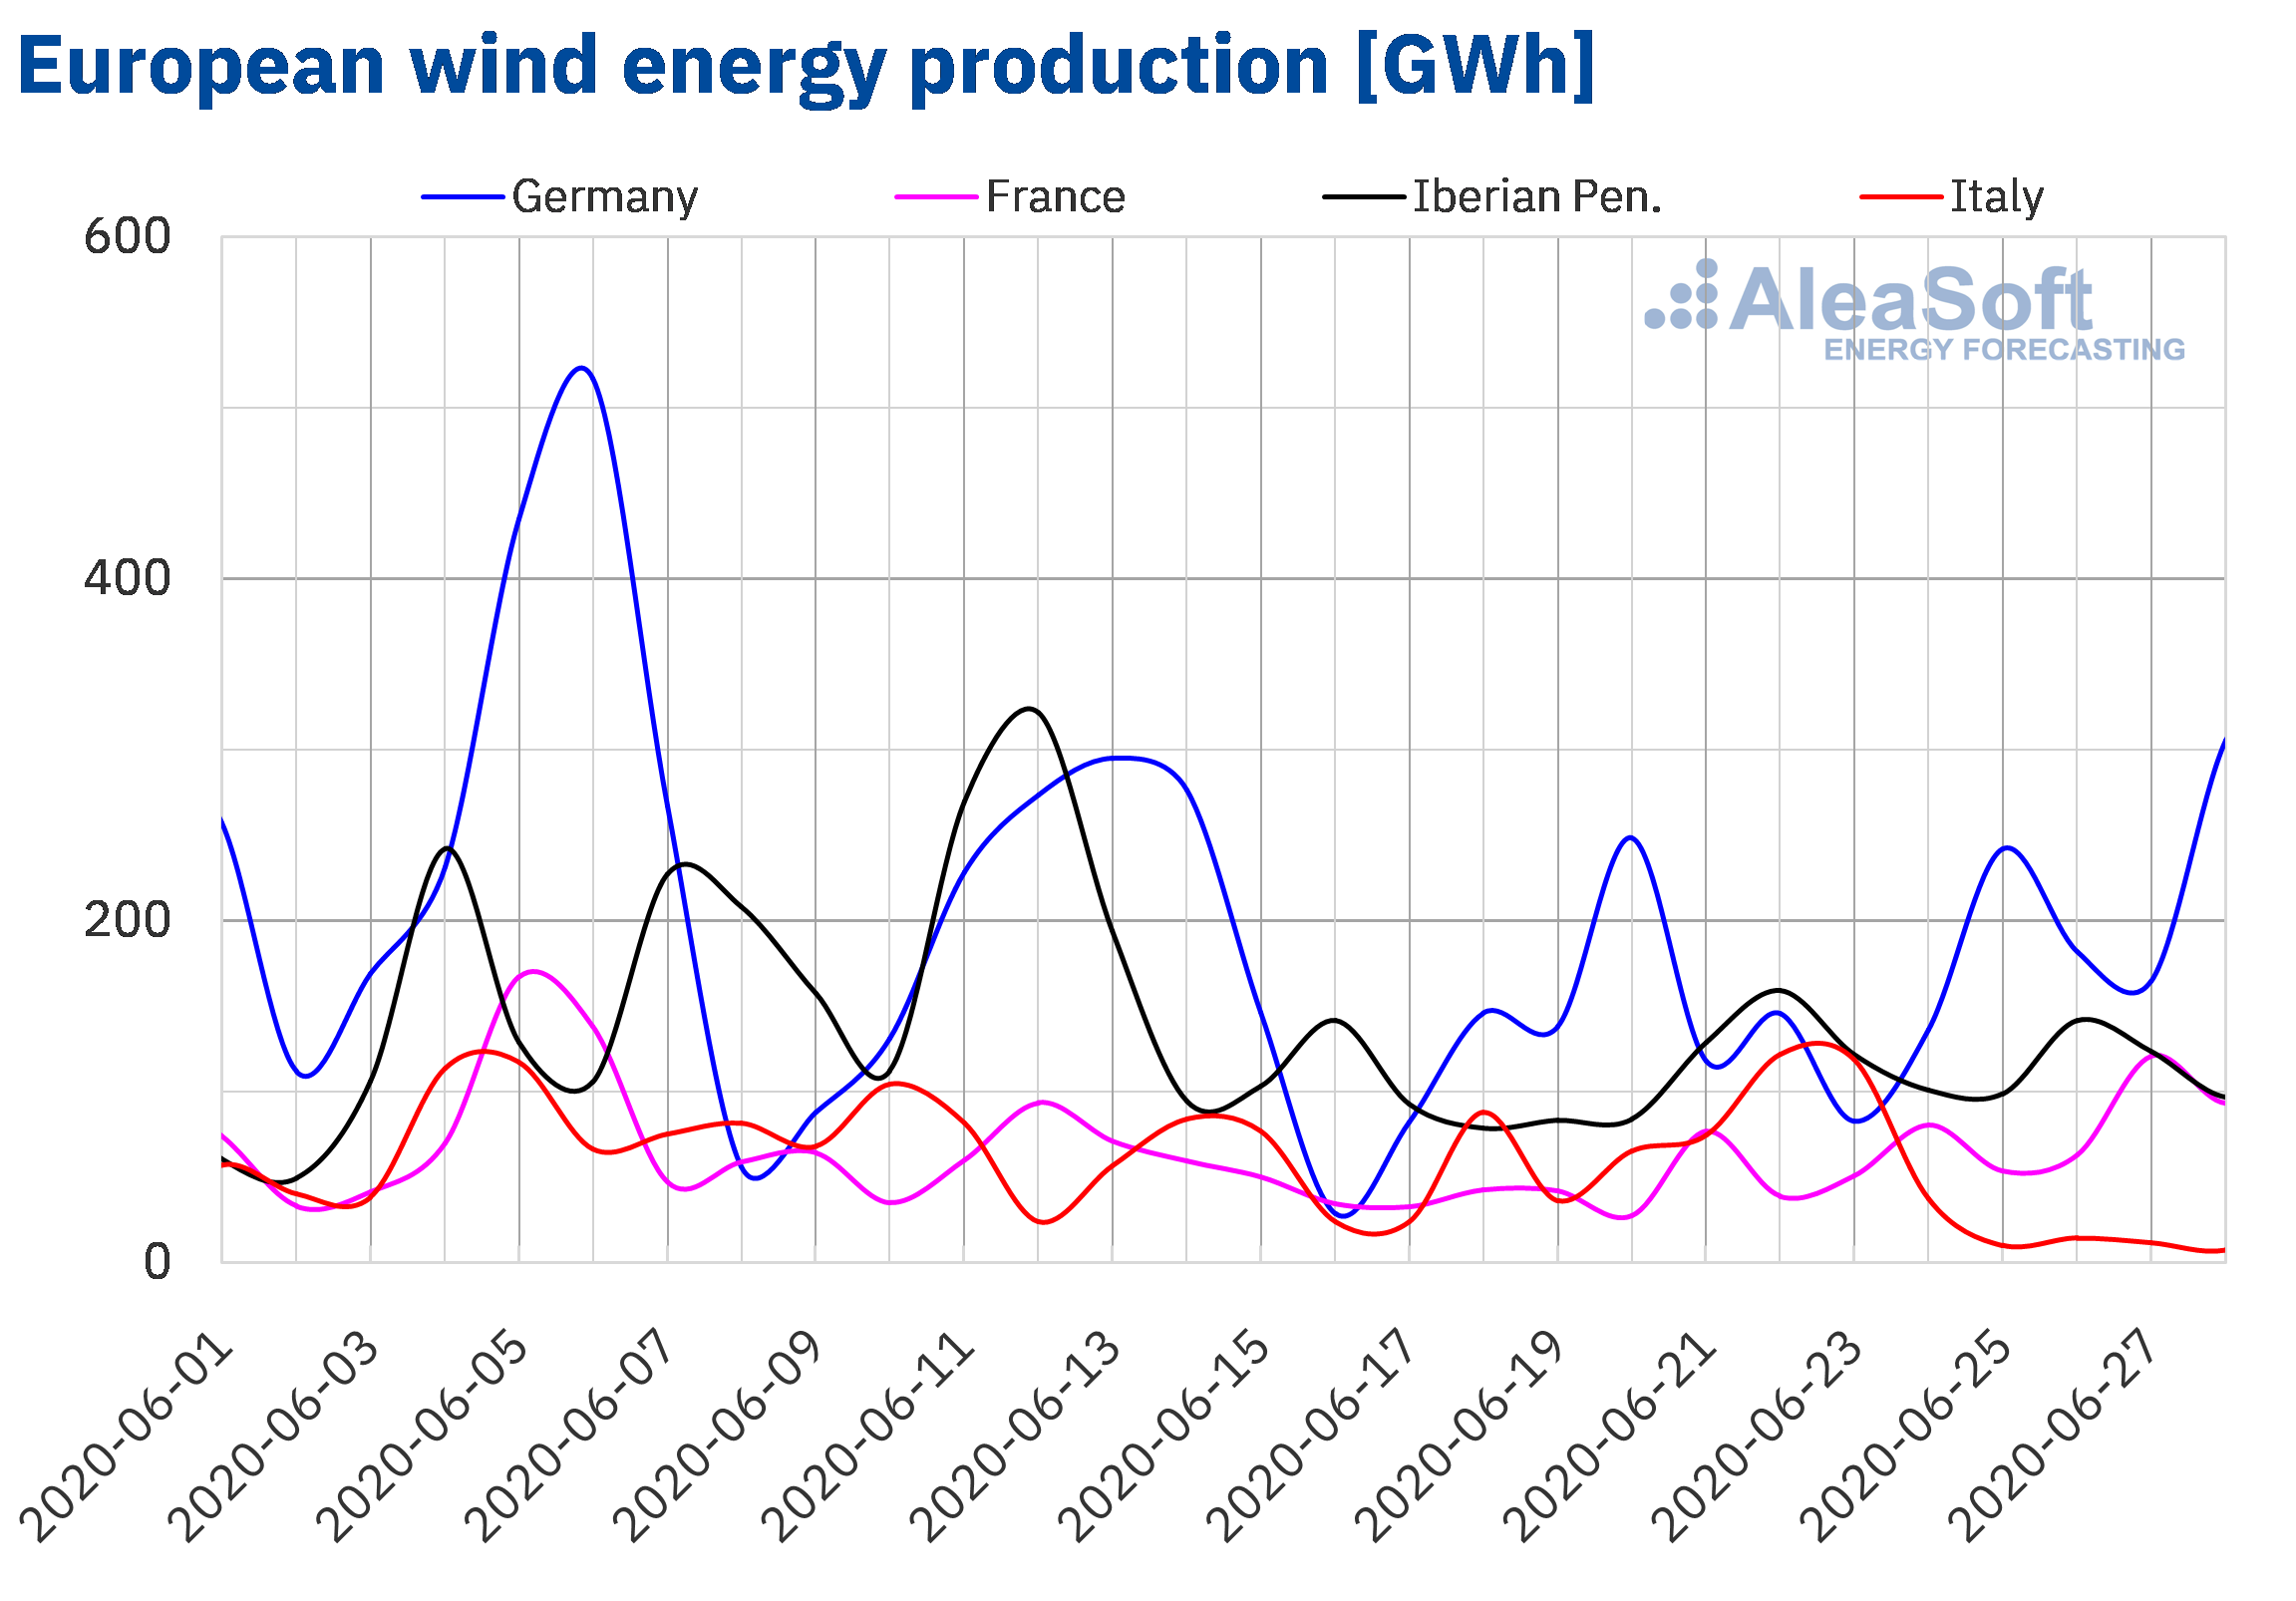
During the 26th week of the year, the wind energy production was 63% higher compared to the previous week in the French market. The production also increased in the German and Spanish markets, in these cases by 39% and 30% respectively. On the contrary, in the Italian market it decreased by 17% and in the Portuguese by 12%.
In the year‑on‑year analysis of the first 28 days of June, the wind energy production was 90% higher in the Italian market, while in the Iberian Peninsula and France it was 1.9% and 3.1% higher. Out of all the markets analysed at AleaSoft, the only one that registered a decrease in production during these days was the German one with a decrease of 13% compared to the same period of 2019.
For this week the AleaSoft‘s wind energy production forecasting indicates an increase in all the markets analysed at AleaSoft except in Italy and Portugal.
 Source: Prepared by AleaSoft using data from ENTSO-E, RTE, REN, REE and TERNA.
Electricity demand
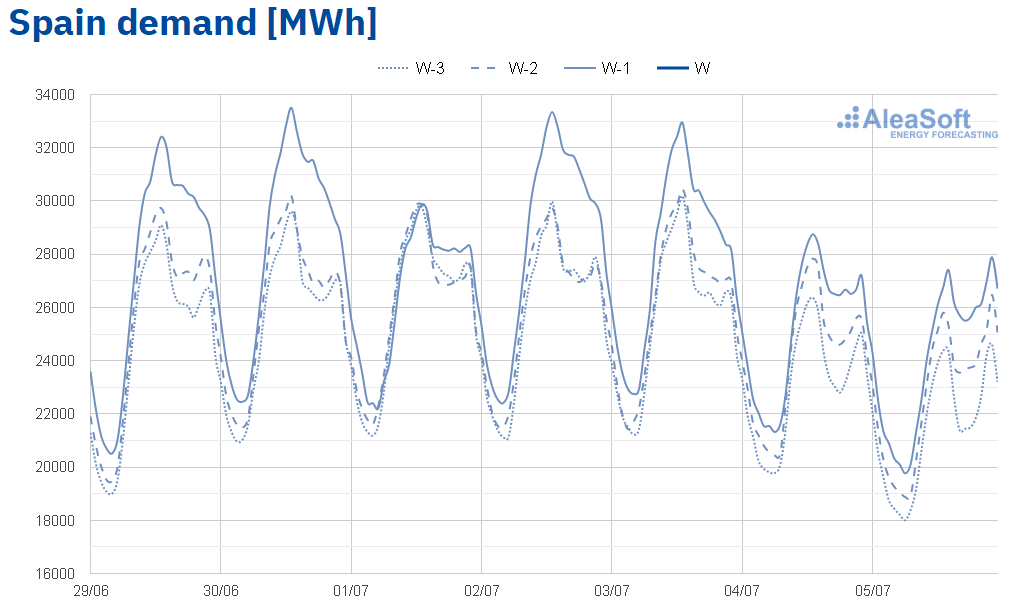
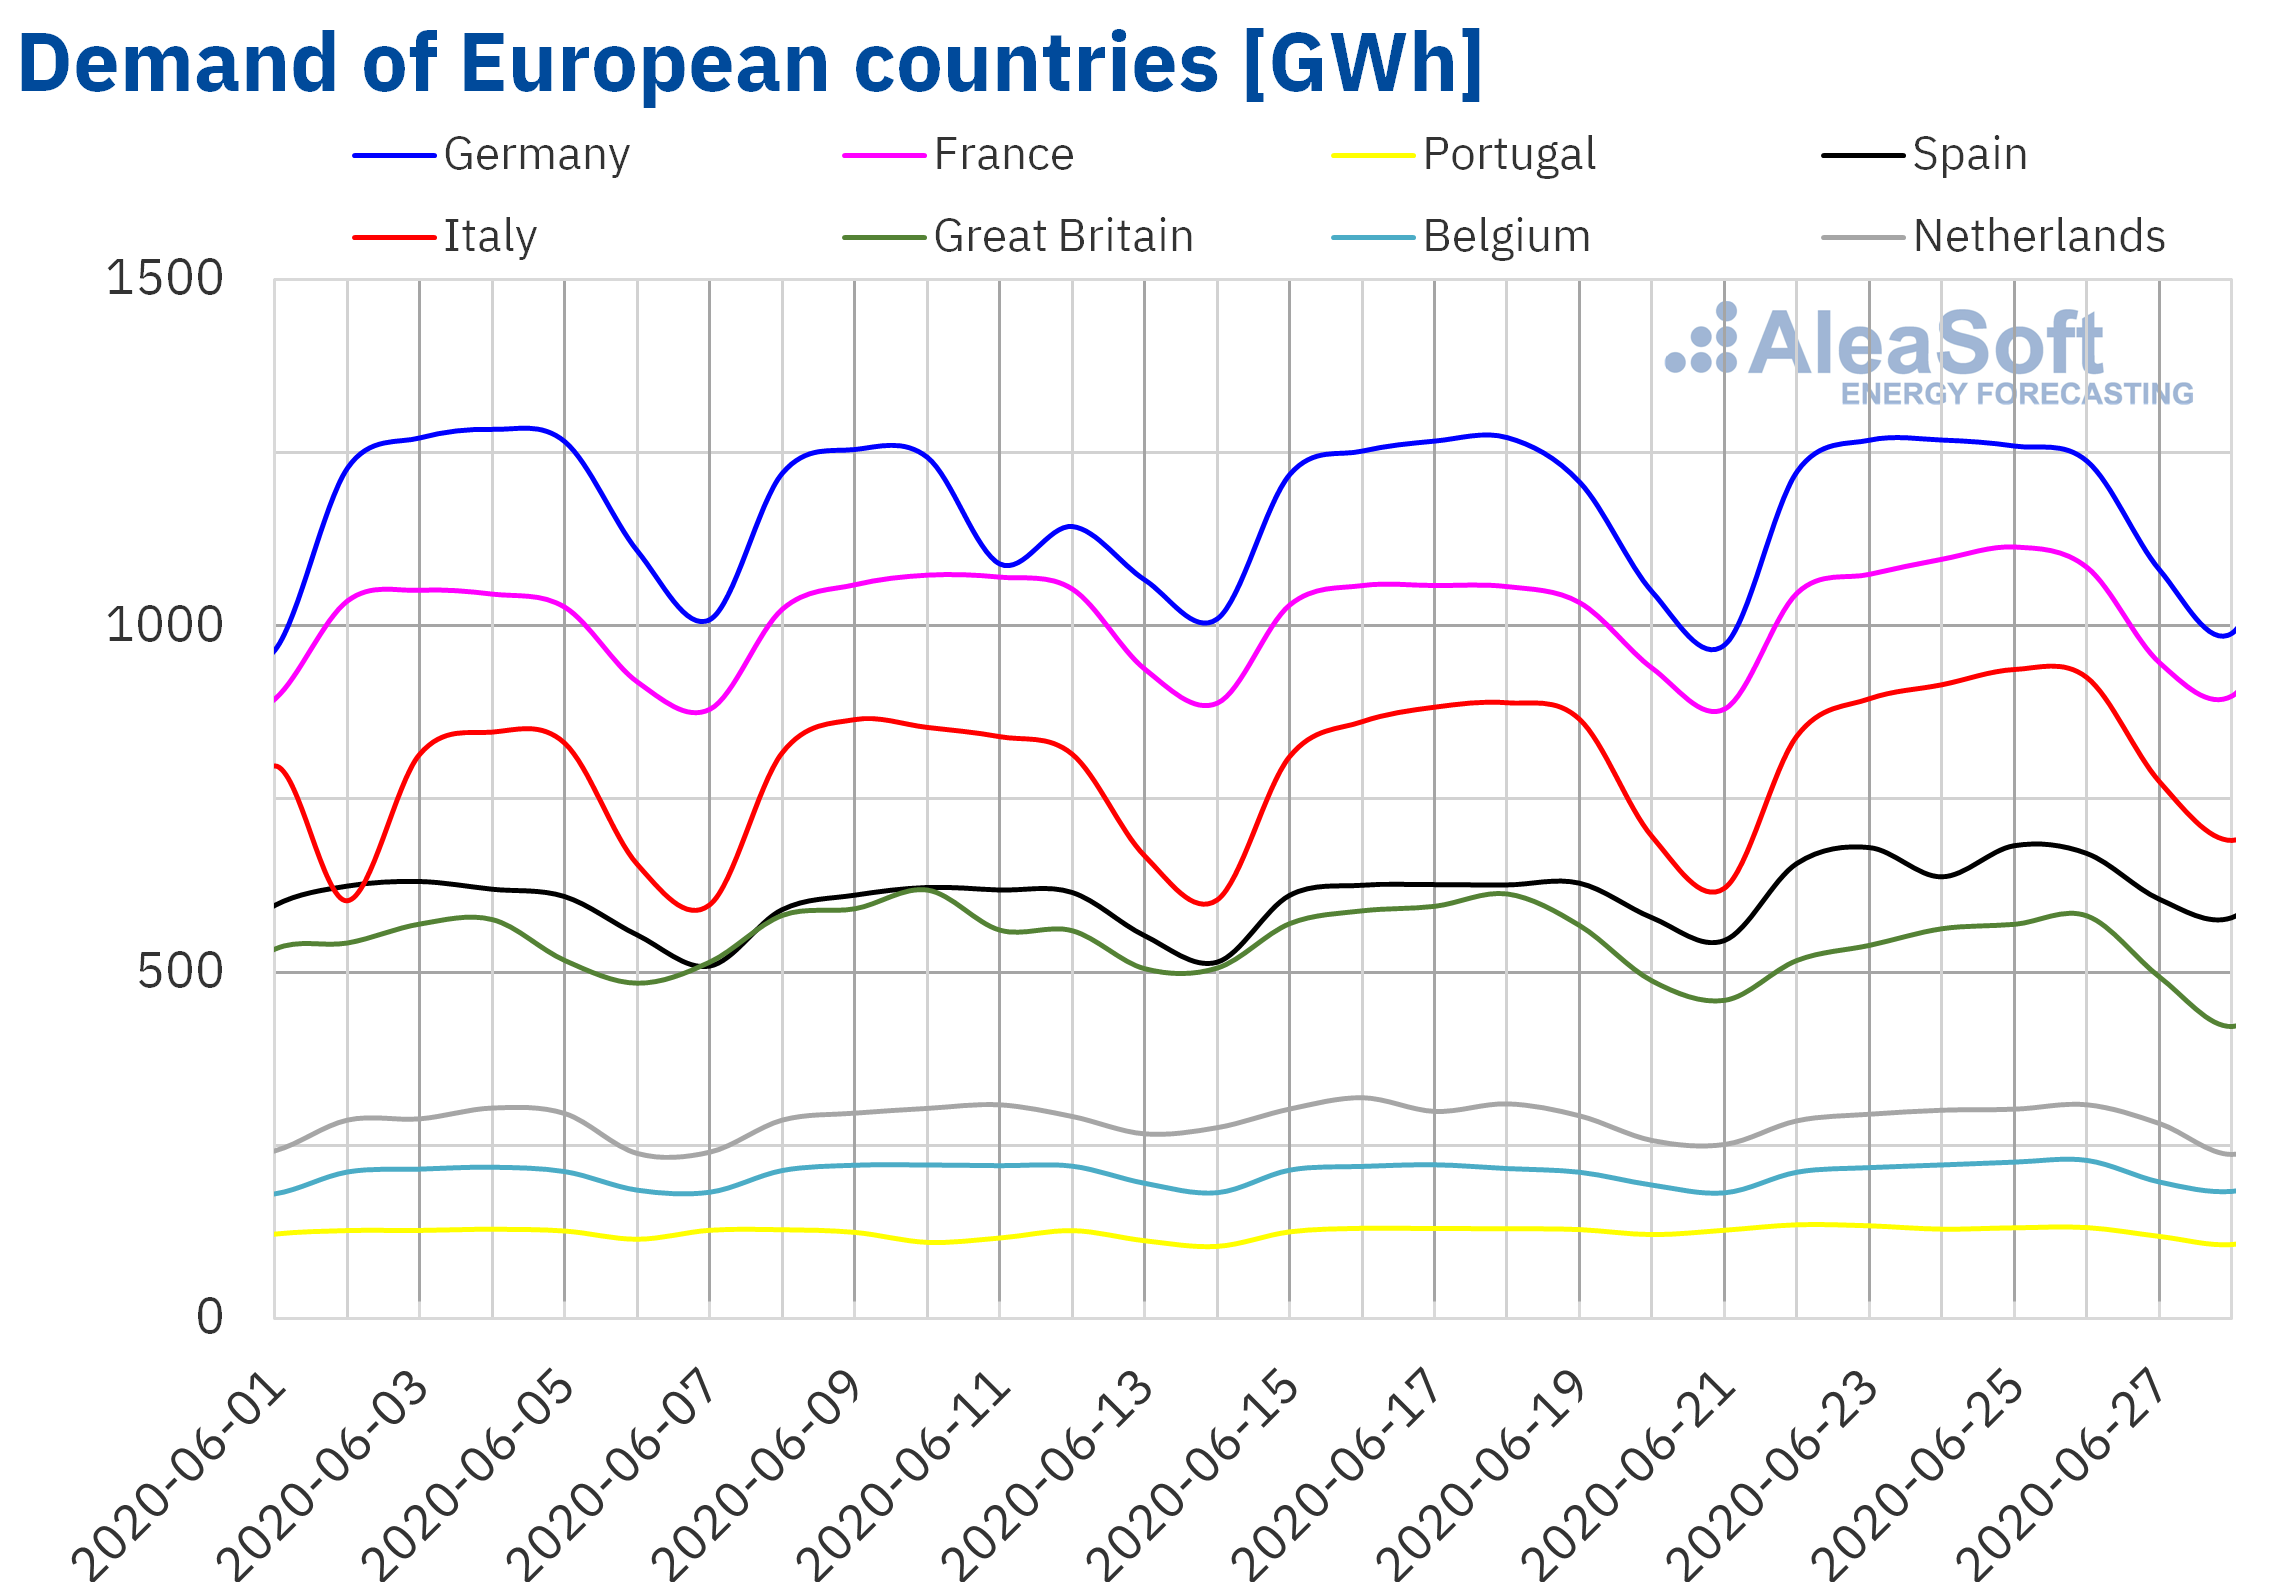
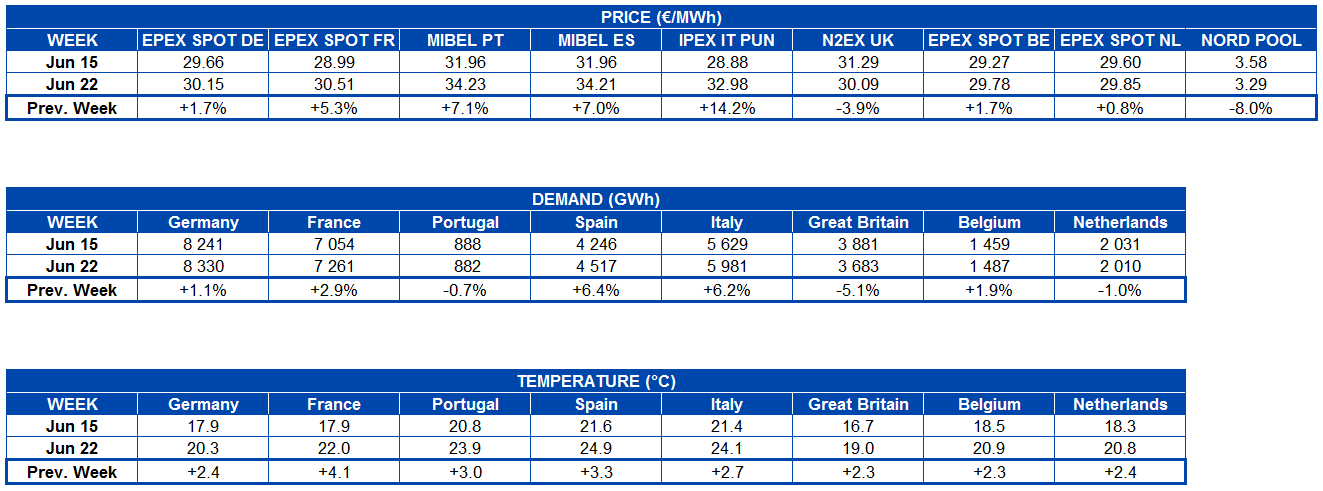
During the week of June 22, the arrival of summer was perceived in the electricity demand of the European markets. In Spain, the rise in average temperatures by 3.3 °C was combined with the end of the State of Alarm on Sunday 21, which favoured the increase in demand of 6.4%. The rise in the Italian market was 6.2%, mainly due to the increase in average temperatures by 2.7 °C. On the other hand, increases in demand were registered in Germany, France and Belgium, which were 1.1%, 2.9% and 1.9% respectively. On the other hand, in Great Britain, the electricity demand decreased by 5.1%. In the markets of Portugal and the Netherlands, the variations were ‑0.7% and ‑1.0% respectively.
The end of the State of Alarm was reflected in the Spanish market, where the demand of the week 26 of the year increased significantly compared to the previous weeks, including that of Wednesday the 24th, which was a regional holiday. The rise in industrial and commercial activity allowed the time profile to recover the expected form for this summer stage. It should be noted that the valley between 4 pm and 8 pm disappeared during the weekdays, due to the reopening of the sectors that have activity in that period.
 Source: Prepared by AleaSoft using data from REE.
At the AleaSoft’s electricity markets observatories the behaviour of the demand of Spain before and after the State of Alarm can be analysed, in addition to the evolution of the main variables of the markets of the European countries.
The AleaSoft’s electricity demand forecasting indicates that in the week of June 29 this will be lower than that of the previous week in most of the analysed European markets, as less warm average temperatures than those registered during the week of 22 June are expected.
 Source: Prepared by AleaSoft using data from ENTSO-E, RTE, REN, REE, TERNA, National Grid and ELIA.
European electricity markets
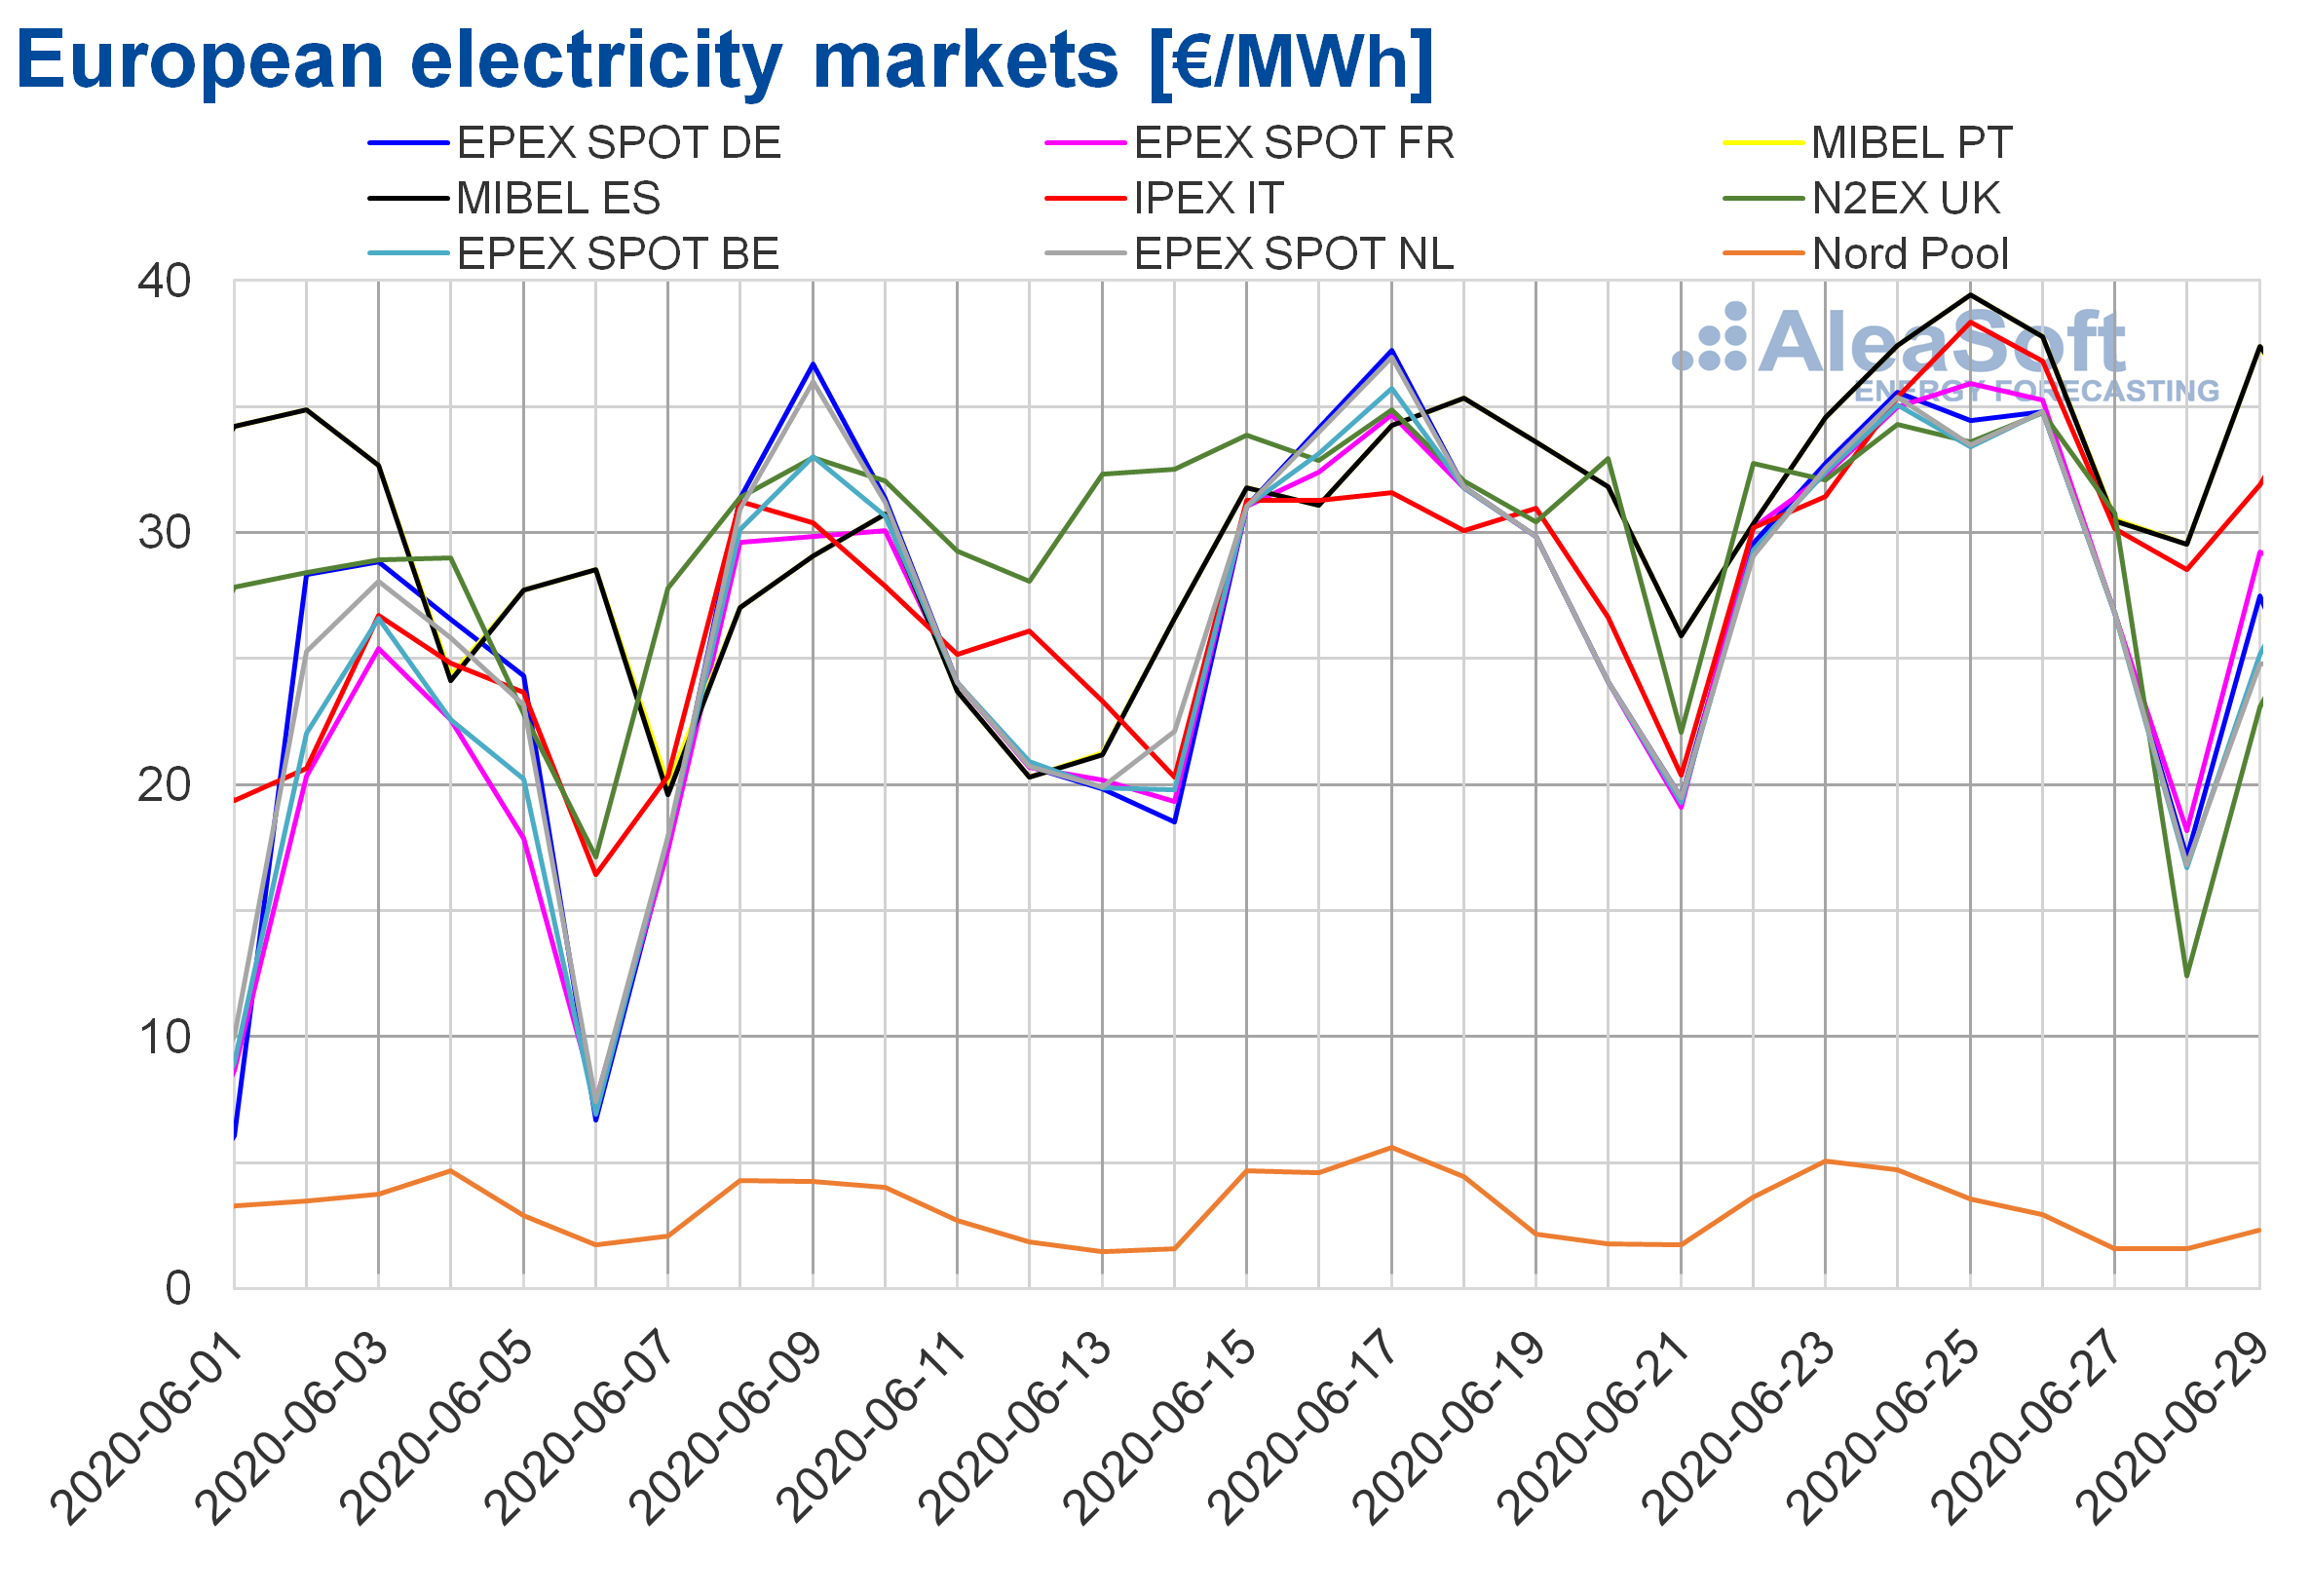
In the week of June 22, the prices increased in most of the analysed European electricity markets compared to those of the week of June 15. The exceptions were the Nord Pool market of the Nordic countries and the N2EX market of Great Britain, with decreases of 8.0% and 3.9% respectively. On the other hand, the market with the highest price increase, of 14%, was the IPEX market of Italy, followed by the MIBEL market of Portugal with an increase of 7.1%. While the market where the price rose the least, by 0.8%, was the EPEX SPOT market of the Netherlands. In the rest of the markets, the increases were between 1.7% of the EPEX SPOT market of Germany and Belgium and 7.0% of the MIBEL market of Spain.
The week of June 22, the market with the lowest average price, of €3.29/MWh, was the Nord Pool market. While the market with the highest average price, of €34.23/MWh, was the MIBEL market of Portugal, followed by the MIBEL market of Spain, with €34.21/MWh. In the rest of the markets, average prices between €29.78/MWh of the EPEX SPOT market of Belgium and €32.98/MWh of the IPEX market were reached.
The price increases during the week of June 22 were favoured by the increase in demand in most European markets, mainly, and by the recovery of the gas and CO2 emission rights prices.
On the other hand, on Sunday, June 28, negative hourly prices were reached in the Belgian and British markets. In the latter, there were also negative hourly prices at dawn of Monday, June 29, where the lowest hourly price was ‑€19.53/MWh, corresponding to hour 6. This price is the lowest in this market since the end of May.
 Source: Prepared by AleaSoft using data from OMIE, , N2EX, IPEX and Nord Pool.
The AleaSoft’s price forecasting indicates that this week of June 29 the prices will fall in most of the analysed markets. The exceptions will be the Belgian market and the French market. The price drops will be favoured by the decrease in demand in most of the European markets and the increase in wind energy production, mainly in Germany and Spain.

Electricity futures
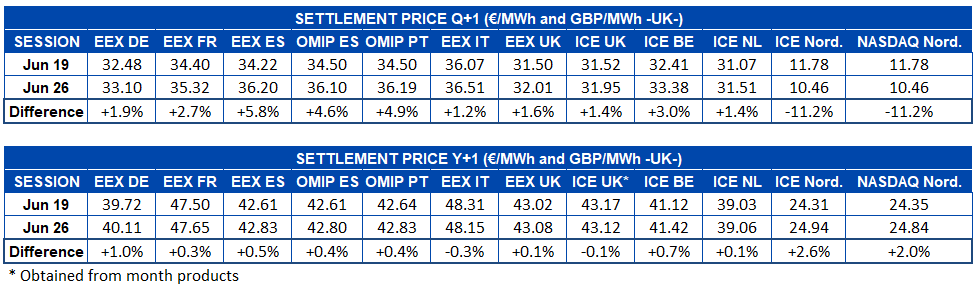
The electricity futures prices for the third quarter of the current year settled in the session of Friday, June 26, with increases in most of the markets analysed at AleaSoft compared to Friday, June 19. This growing behaviour for the second consecutive week, on this occasion, left increases of up to 5.8% registered in the EEX market of Spain. The Nordic countries, both in the NASDAQ market and in the ICE market, continued with opposite behaviour to that of the other markets, ending the week with a drop of 11% in both cases.
As for the futures for the next year 2021, the behaviour was somewhat different. In the EEX market of Italy and the ICE market of Great Britain, decreases of 0.3% and 0.1% respectively were registered. In general, in the rest of the markets there were increases from 0.1% of the ICE market of the Netherlands to 2.6% of the ICE market of the Nordic countries.
Brent, fuels and CO2
The Brent oil futures for the month of August 2020 in the ICE market, on Monday, June 22, reached a settlement price of $43.08/bbl, 8.5% higher than that of Monday, June 15, and the highest since early March. Instead, on Wednesday, June 24, the lowest settlement price of the week, of $40.31/bbl, was registered. On Thursday and Friday the prices were above $41/bbl again. Specifically, on Friday, June 26, the settlement price was $41.02/bbl, 2.8% lower than that of the previous Friday.
The rise in production of the United States and the increases in the oil reserves of this country exerted their downward influence on the prices during the week. On the other hand, the relaxation of the mobility restrictions, imposed to stop the spread of COVID‑19 in many countries, is favouring the recovery in demand. However, the increase in the number of infections in recent days threatens this recovery. In the coming days, the evolution of the infections and the measures adopted to prevent them from increasing will influence the evolution of the prices.
The TTF gas futures prices in the ICE market for the month of July 2020, during the fourth week of June, continued above €5/MWh. On Tuesday, June 23, a settlement price of €5.83/MWh was reached, 11% higher than that of the previous Tuesday and the highest since the first half of May. However, on the following days of the week of June 22, the prices fell. Thus, on Friday the 26th, the settlement price was €5.11/MWh, 9.1% lower than that of Friday, June 19.
Regarding the TTF gas prices in the spot market, most of the days of last week also remained above €5/MWh. On Thursday, June 25, the maximum index price of the week, of €5.65/MWh, was reached, which was the highest since the first half of May. However, the prices fell to €4.78/MWh last weekend. On Monday, June 29, the index price was also below €5/MWh, although it increased until €4.89/MWh.
On the other hand, the API 2 coal futures prices in the ICE market for the month of July 2020, the fourth week of June, continued the upward trend of the previous week. On Friday, June 26, a settlement price of $49.45/t was reached. This price was 7.6% higher than that of Friday the 19th and the highest since the beginning of April.
As for the CO2 emission rights futures prices in the EEX market for the reference contract of December 2020, they started the week of June 22 increasing, until reaching a settlement price of €25.41/t on Tuesday, June 23, which was 12% higher than that of Tuesday of the third week of June and the highest since February. The rest of the week the prices fell slightly and on Friday the settlement price was €24.73/t.
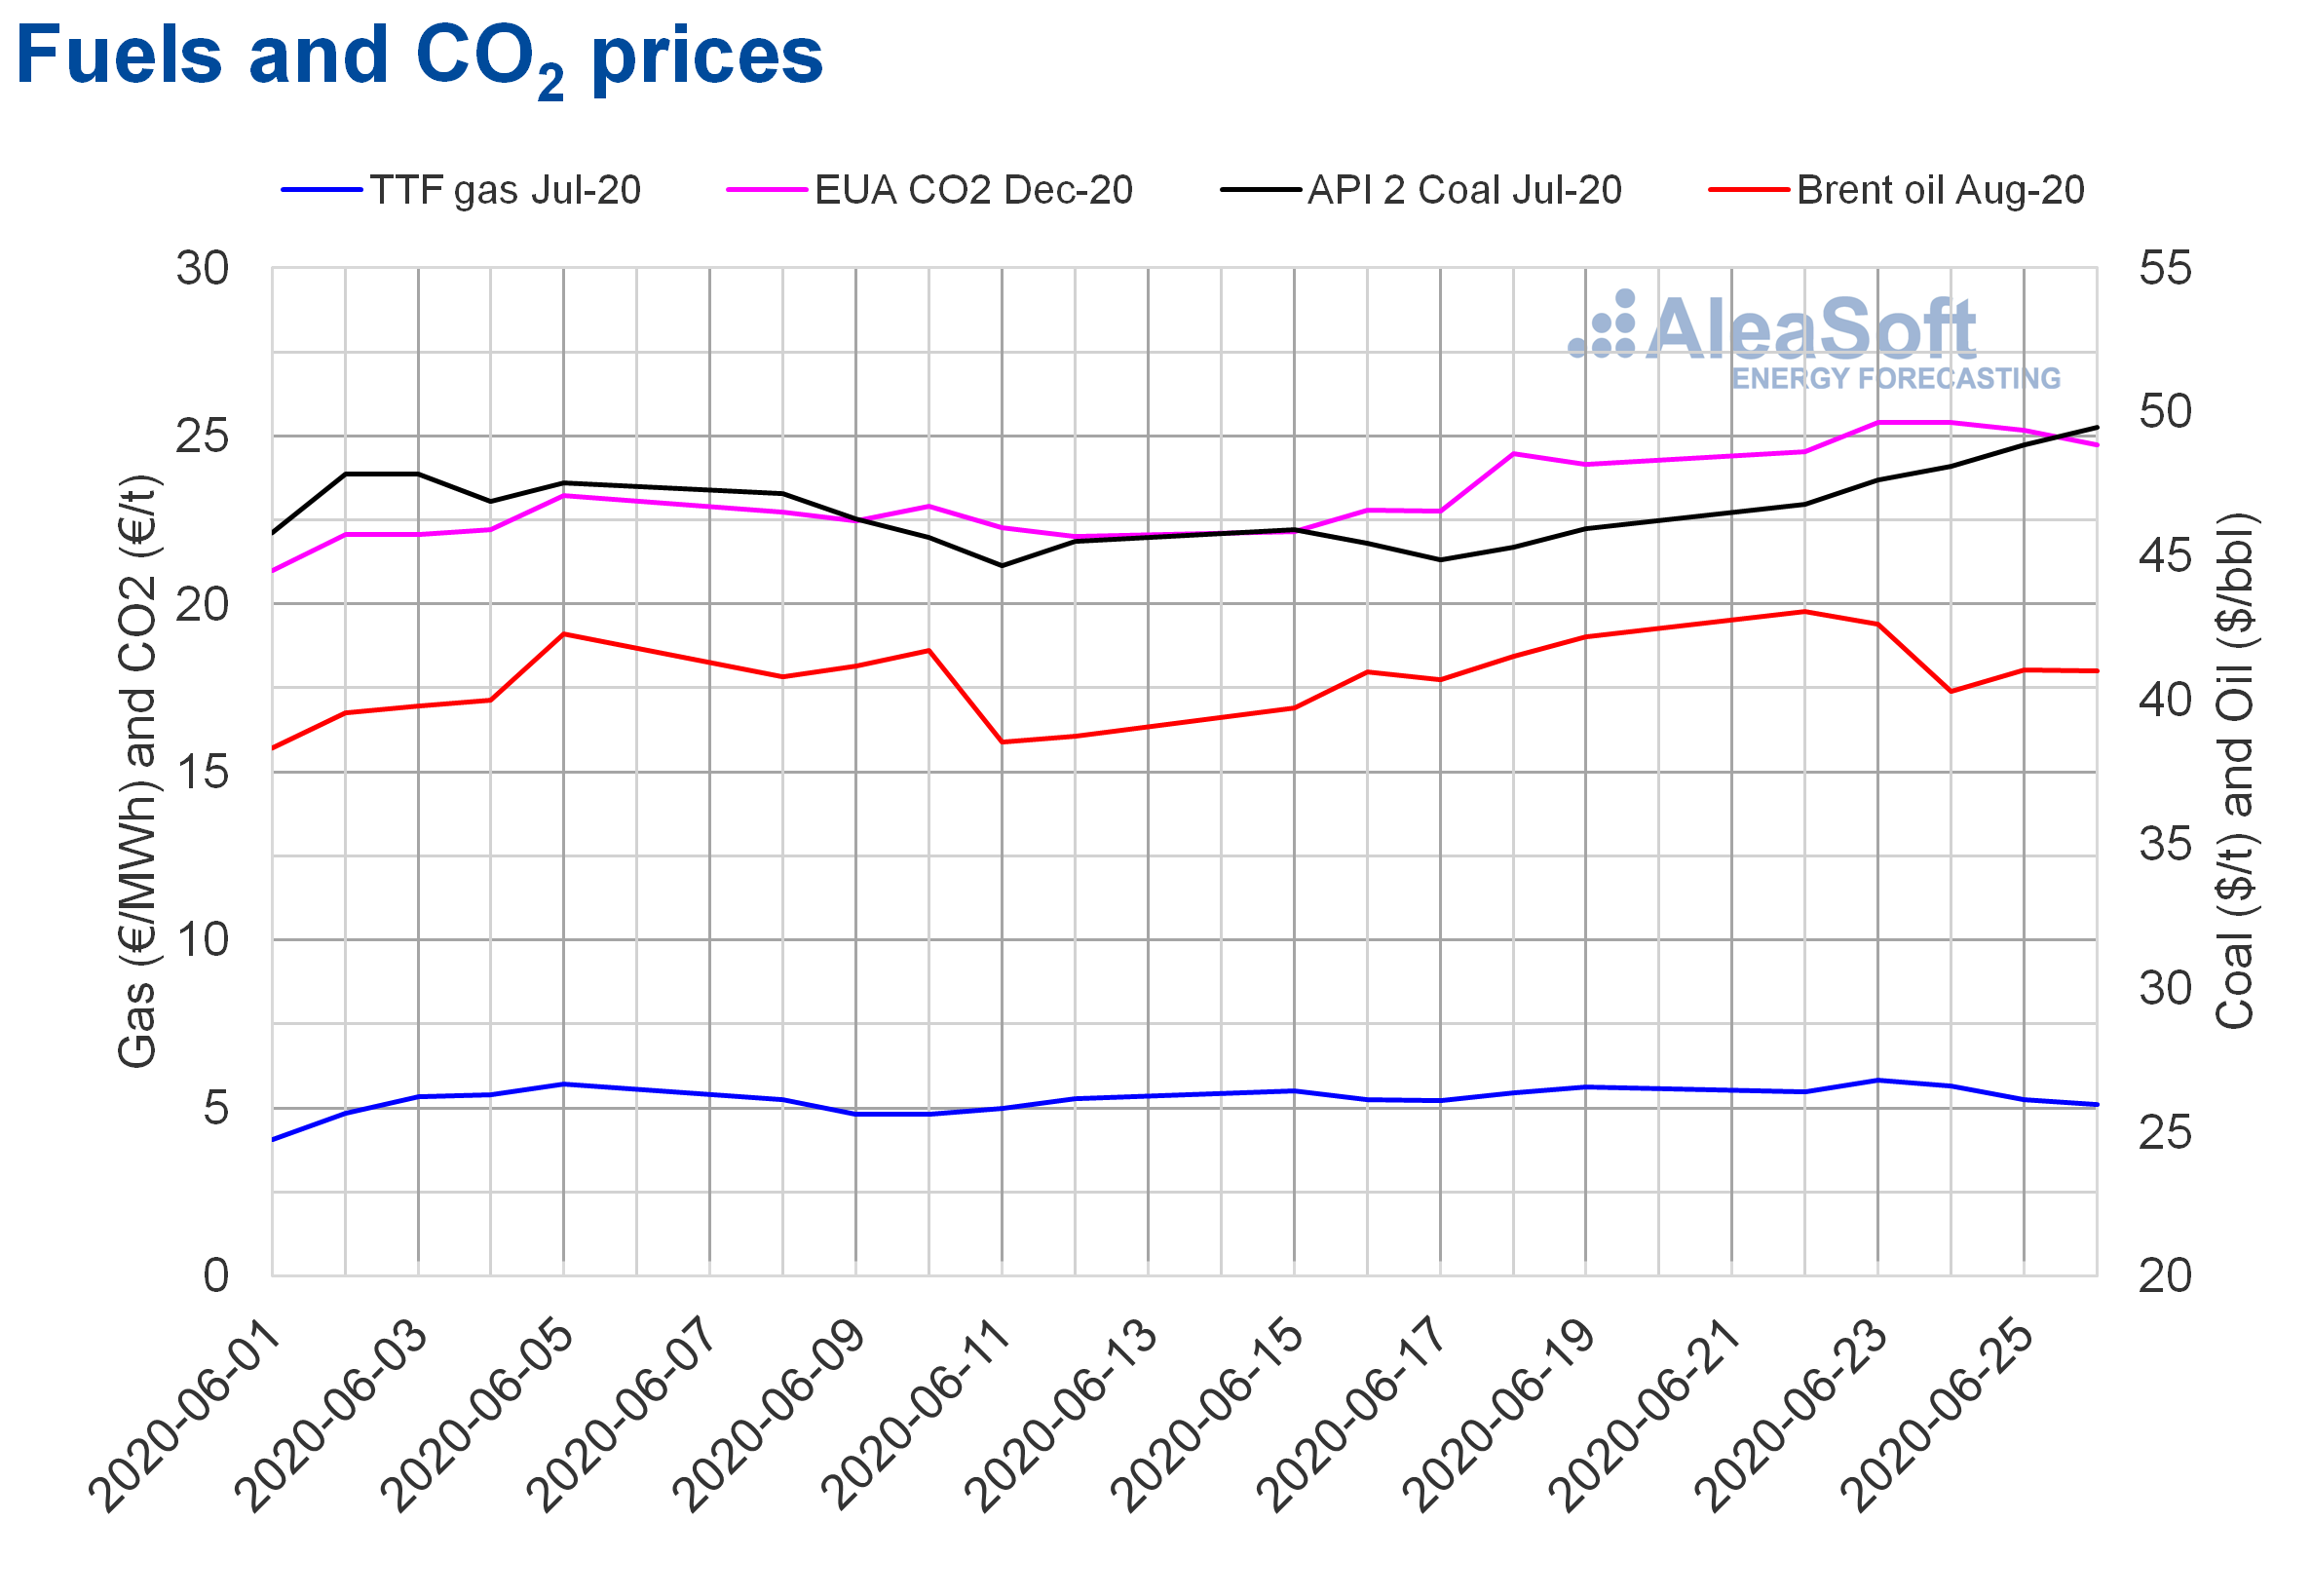 Source: Prepared by AleaSoft using data from ICE and EEX.
AleaSoft analysis on the effects on the electricity markets due to the coronavirus crisis
On June 25, the webinar “Influence of coronavirus on electricity demand and the European electricity markets (III)” organised by AleaSoft was held with great success of participation. The main topics addressed were the evolution of the energy markets and the financing of the renewable energy projects during the coronacrisis, and the future prospects taking into account the pessimistic scenario of expected economic growth and the possible new outbreaks of the epidemic. Another topic discussed at the analysis table of the Spanish version of the webinar was the Royal Decree‑Law 23/2020, which was approved by the Spanish Government on June 23, and which includes measures for the reactivation of the energy sector as a result of the COVID‑19 crisis. The speakers agreed that this is great news for the Spanish renewable energy sector.
To continue analysing these topics, the following webinar “Energy markets in the recovery of the economic crisis” is already being organised at AleaSoft. It will take place after the summer, on September 17.
Another way to monitor the main electricity, fuels and CO2 emission rights markets are the AleaSoft’s observatories. This tool includes charts with the information of the last weeks of the main variables of the markets.
Source: AleaSoft Energy Forecasting.