AleaSoft, August 26, 2021. N2EX market prices were the highest in Europe in the first half of 2021, reaching monthly, daily and hourly records in January. The production with gas covered almost half of the generation, which made it sensitive to the high gas prices. In May the UK ETS British CO2 market was launched and its prices were also high. The wind energy positioned in second place in terms of contribution to the generation mix, a mix in which the presence of storage should be highlighted.
Electricity prices
The N2EX market of the United Kingdom was during all months of the first half of 2021 the European market with the highest prices. Its prices in this period were on average approximately €10/MWh above those of the rest of the markets analysed at AleaSoft.
A peculiarity of the UK market in this period was that as of January the market was no longer integrated with the rest of the European markets, as a result of Brexit, and they stopped using the European Euphemia matching algorithm. Also as of January 1 of this year, the United Kingdom stopped participating in the European Union Emissions Trading Scheme (EU ETS), which was replaced by the UK ETS (UK Emissions Trading Scheme) which began trading on May 19.
The average price for the first six months of 2021 in the N2EX market was £68.64/MWh. This value represents an increase of 64% compared to the previous six months and 141% compared to the same period of 2020.
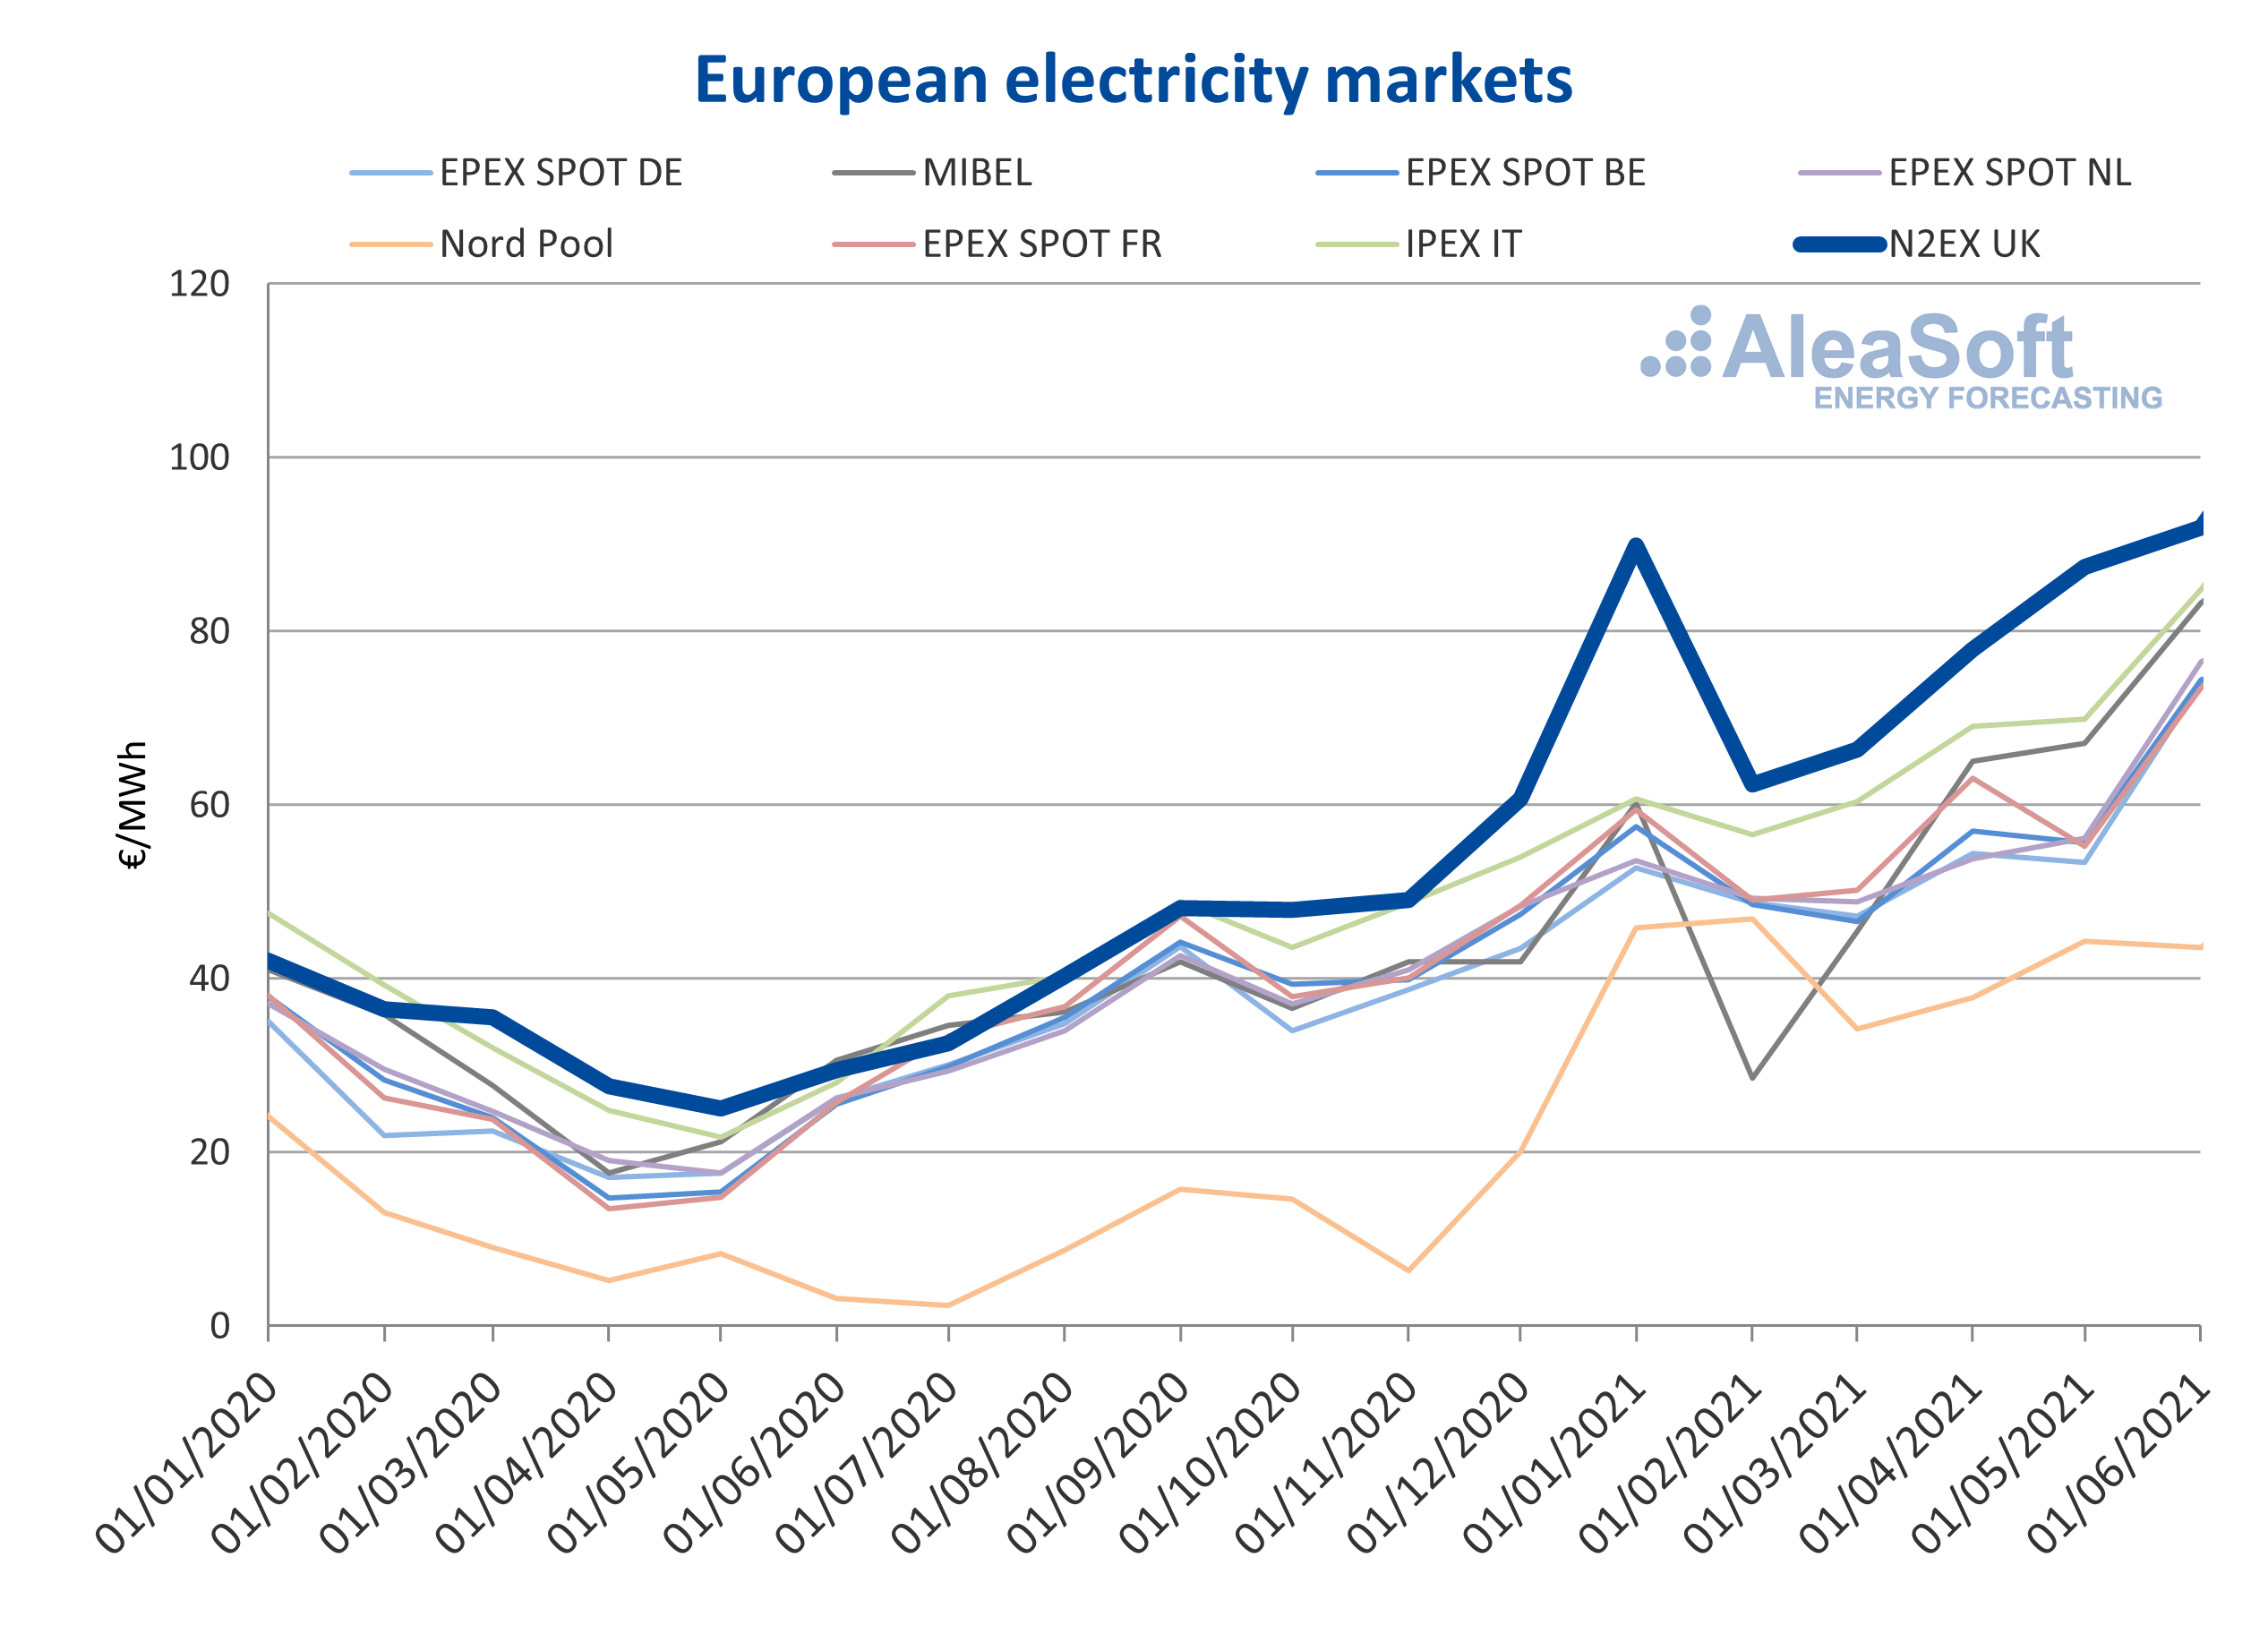 Source: Prepared by AleaSoft using data from EPEX SPOT, MIBEL, IPEX and Nord Pool.
On a monthly basis, the month of January 2021 marked a record for at least the last 11 years. With an average price of £80.26/MWh it far exceeded the previous record of £66.47/MWh set in September 2018. This high price in January was due to a general increase in demand not only in Great Britain but throughout Europe, as a result of a drop in temperatures. In the following months, prices fell after the passage of the cold snap of January, but at the end of the period they rose again, this time mainly driven by the rise in gas prices. In addition, the CO2 emission rights futures prices in the UK ETS were high since the market began to operate, with values above £43.90/t until the end of the period, to which the Carbon Support Price to be paid by fossil fuel power generators in the UK has to be added, which currently tops out at £18/t.
Looking at the daily average prices, in January the UK market broke its record for the highest price in at least the last decade twice, finally being set on January 13 at £198.79/MWh.
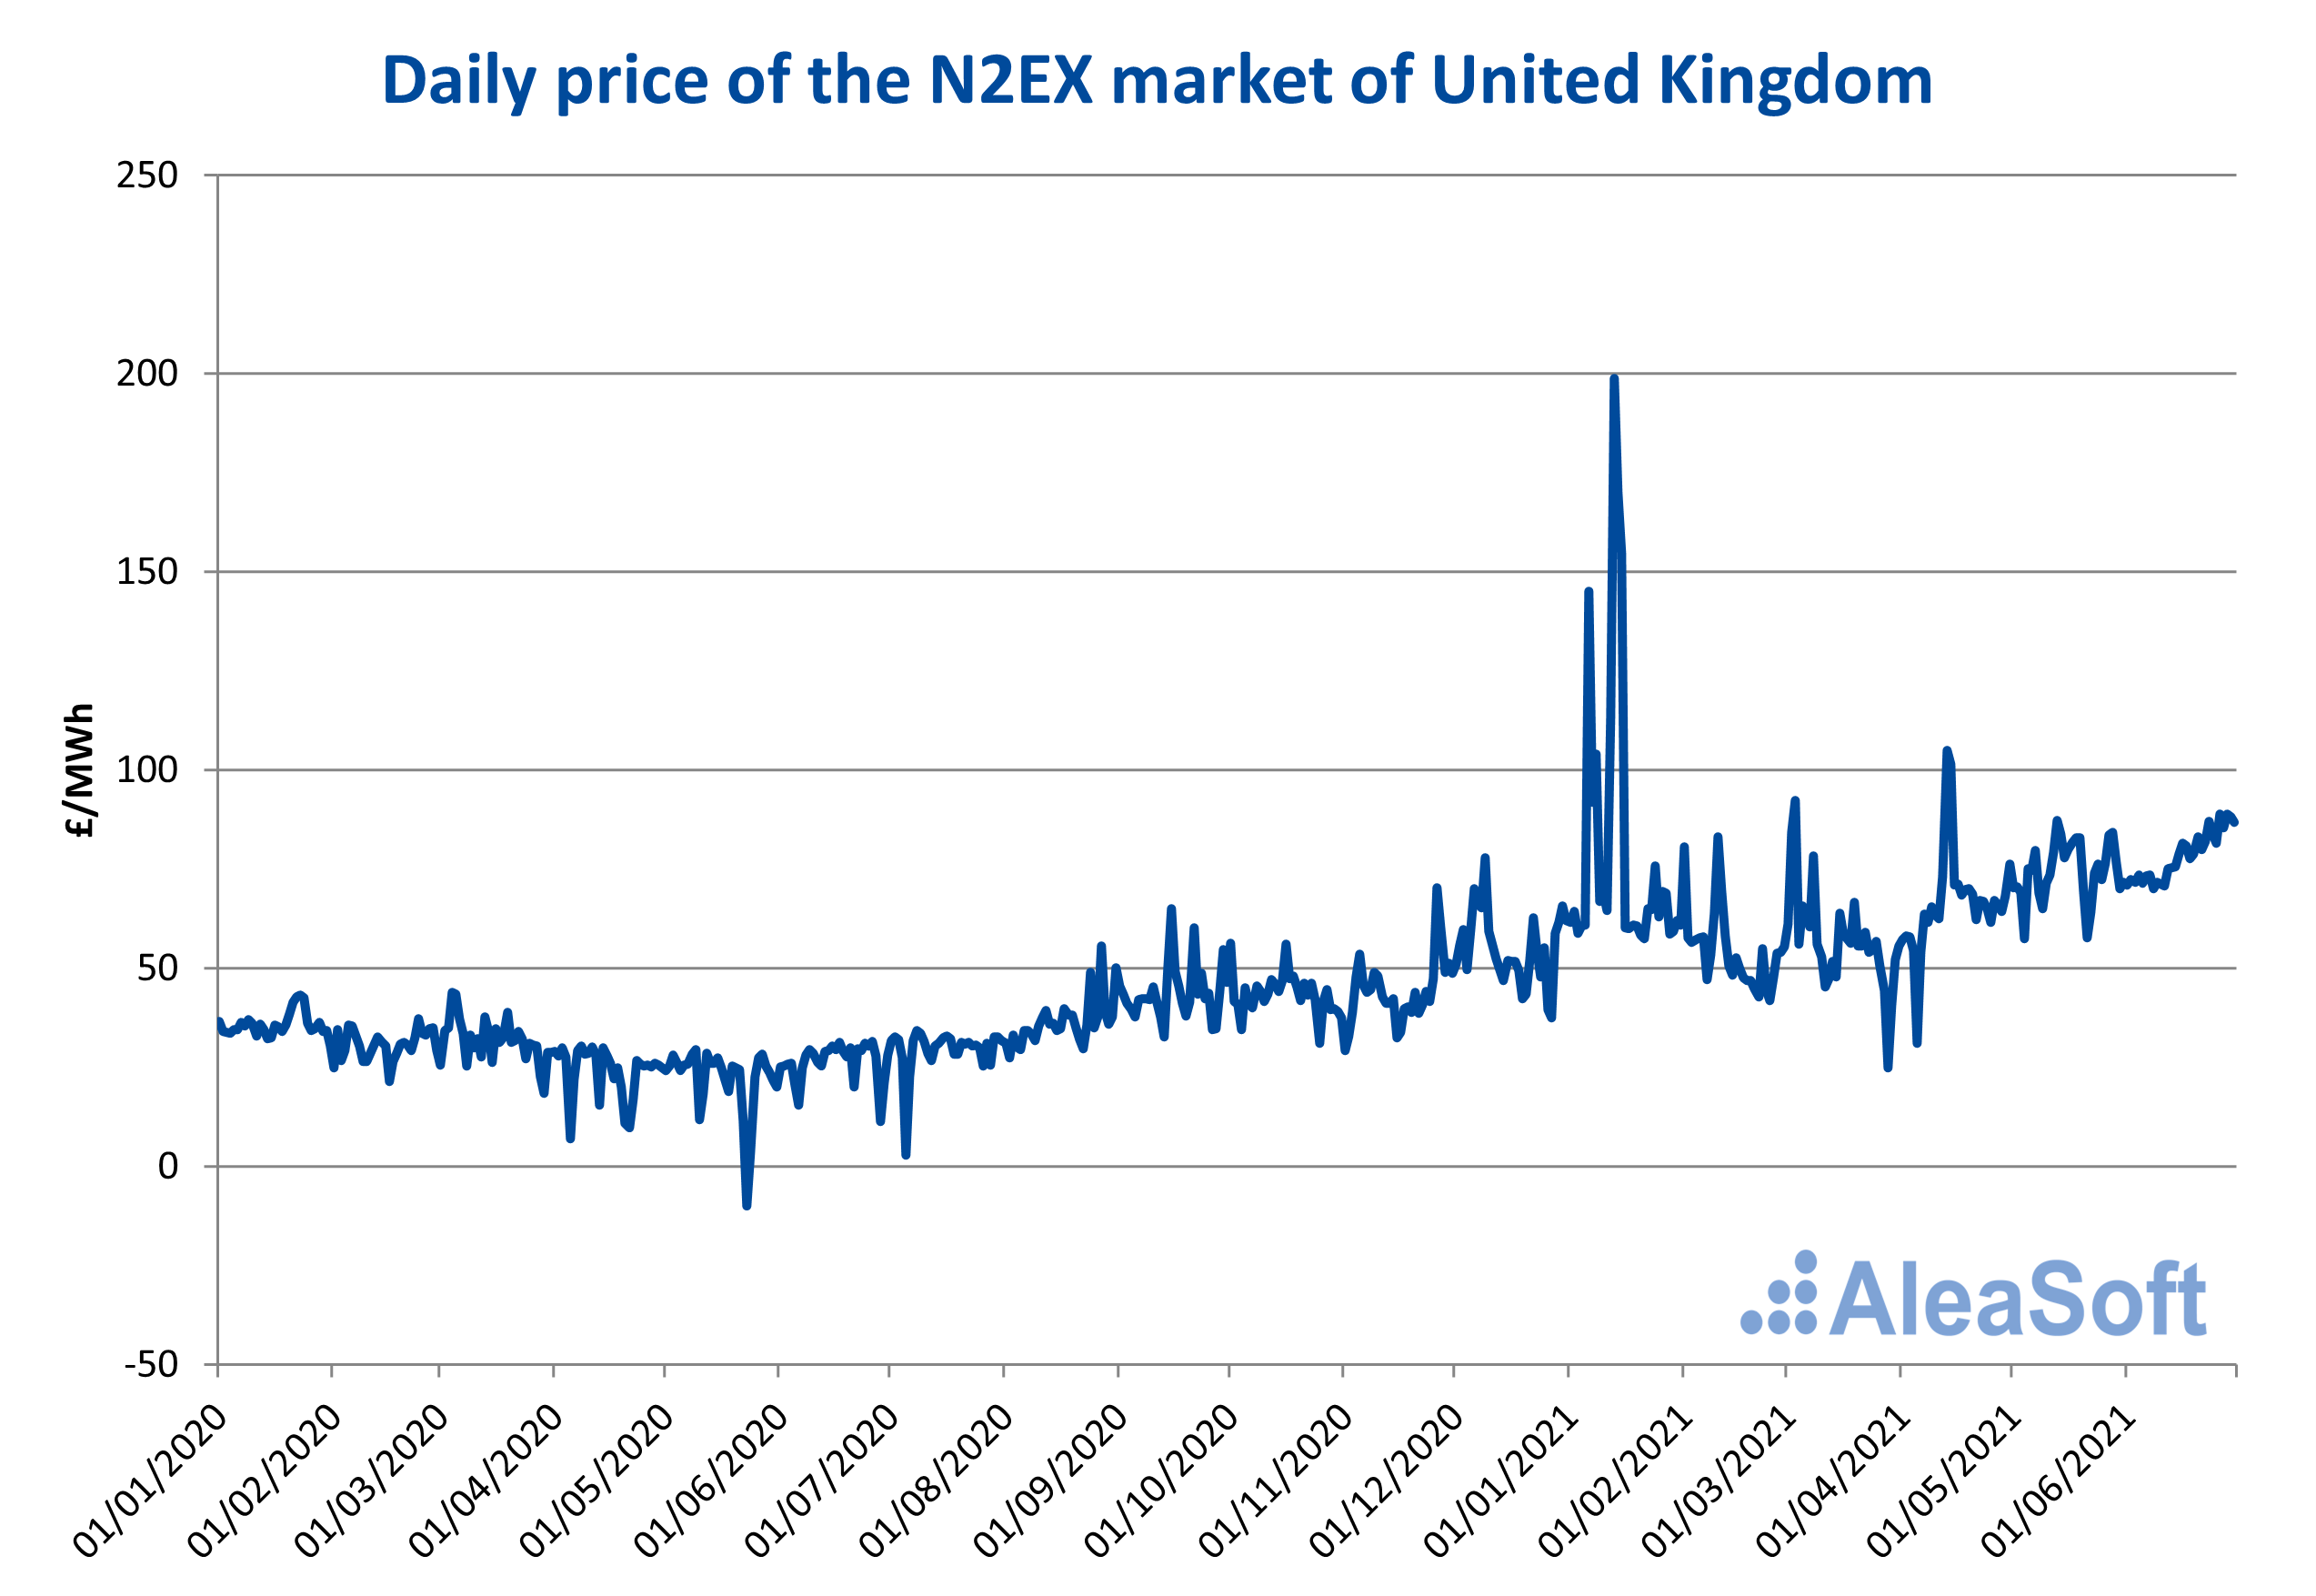 Source: Prepared by AleaSoft using data from Nord Pool.
On the other hand, analysing the hourly prices is where the most extreme cases are observed. On Wednesday, January 13 at 7 p.m. a price of nothing but £1499.62/MWh was reached. This figure represents the record of maximum hourly price of at least the last eleven years.
Electricity demand
The demand of Great Britain increased by 7.1% year‑on‑year during the first half of 2021. Total demand during this period was 126 TWh. The period began with a year‑on‑year monthly increase of 3.0% in January, as it was the coldest January in the last ten years. In February and March there were falls compared to the same months of 2020, which were lower than 4.0%. From April to June 2021, considerable year‑on‑year increases above 10.0% were registered, which reached up to 22% in May. Specifically, in these months the recovery of the labour and industrial activity was manifested compared to the same period of 2020, which was affected by the confinement measures established at the end of March 2020.
The variation from January to June 2021 was 4.1% compared to the previous half year. In these first six months of 2021, the highest daily value was 898 GWh on January 7, 2021, which represented the highest daily demand since January 31, 2019. As is usual, these high values of January made this month was the one with the highest demand in the first semester with 25 TWh, while June was the one with the lowest register with 18 TWh.
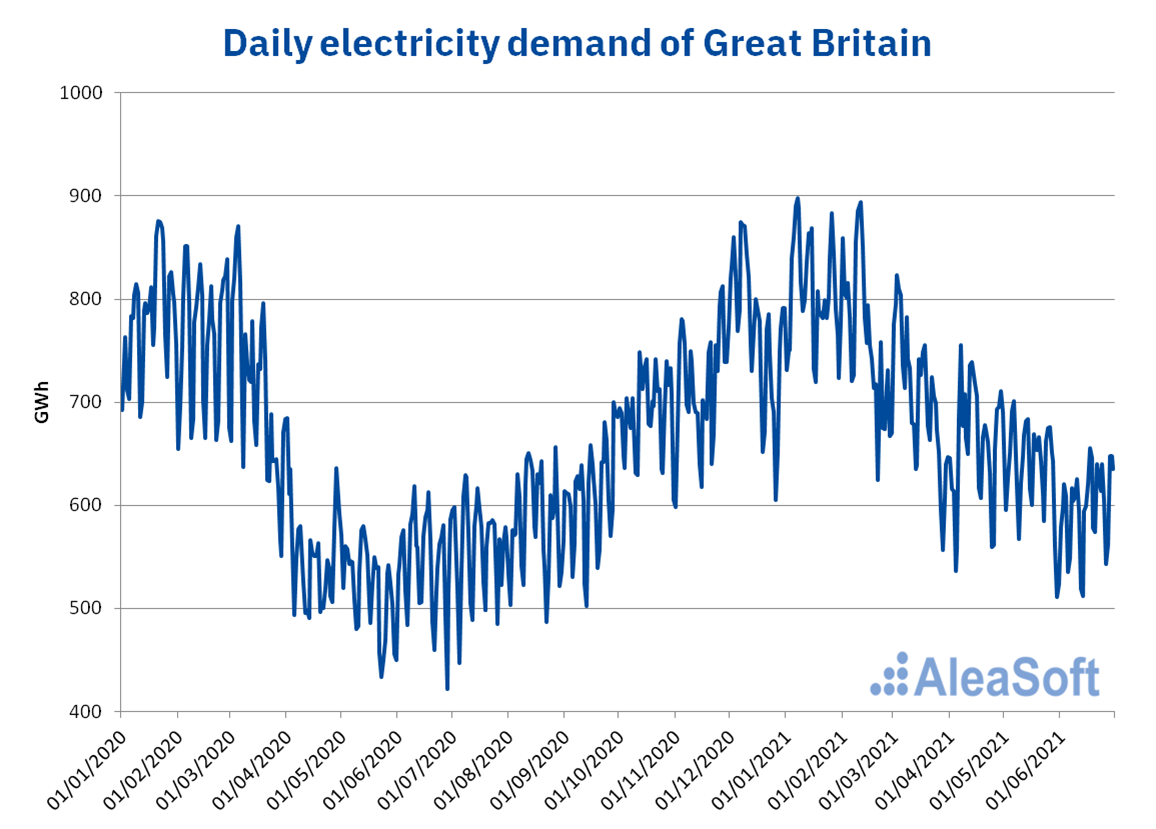 Source: Prepared by AleaSoft using data from National Grid.
Production by technologies
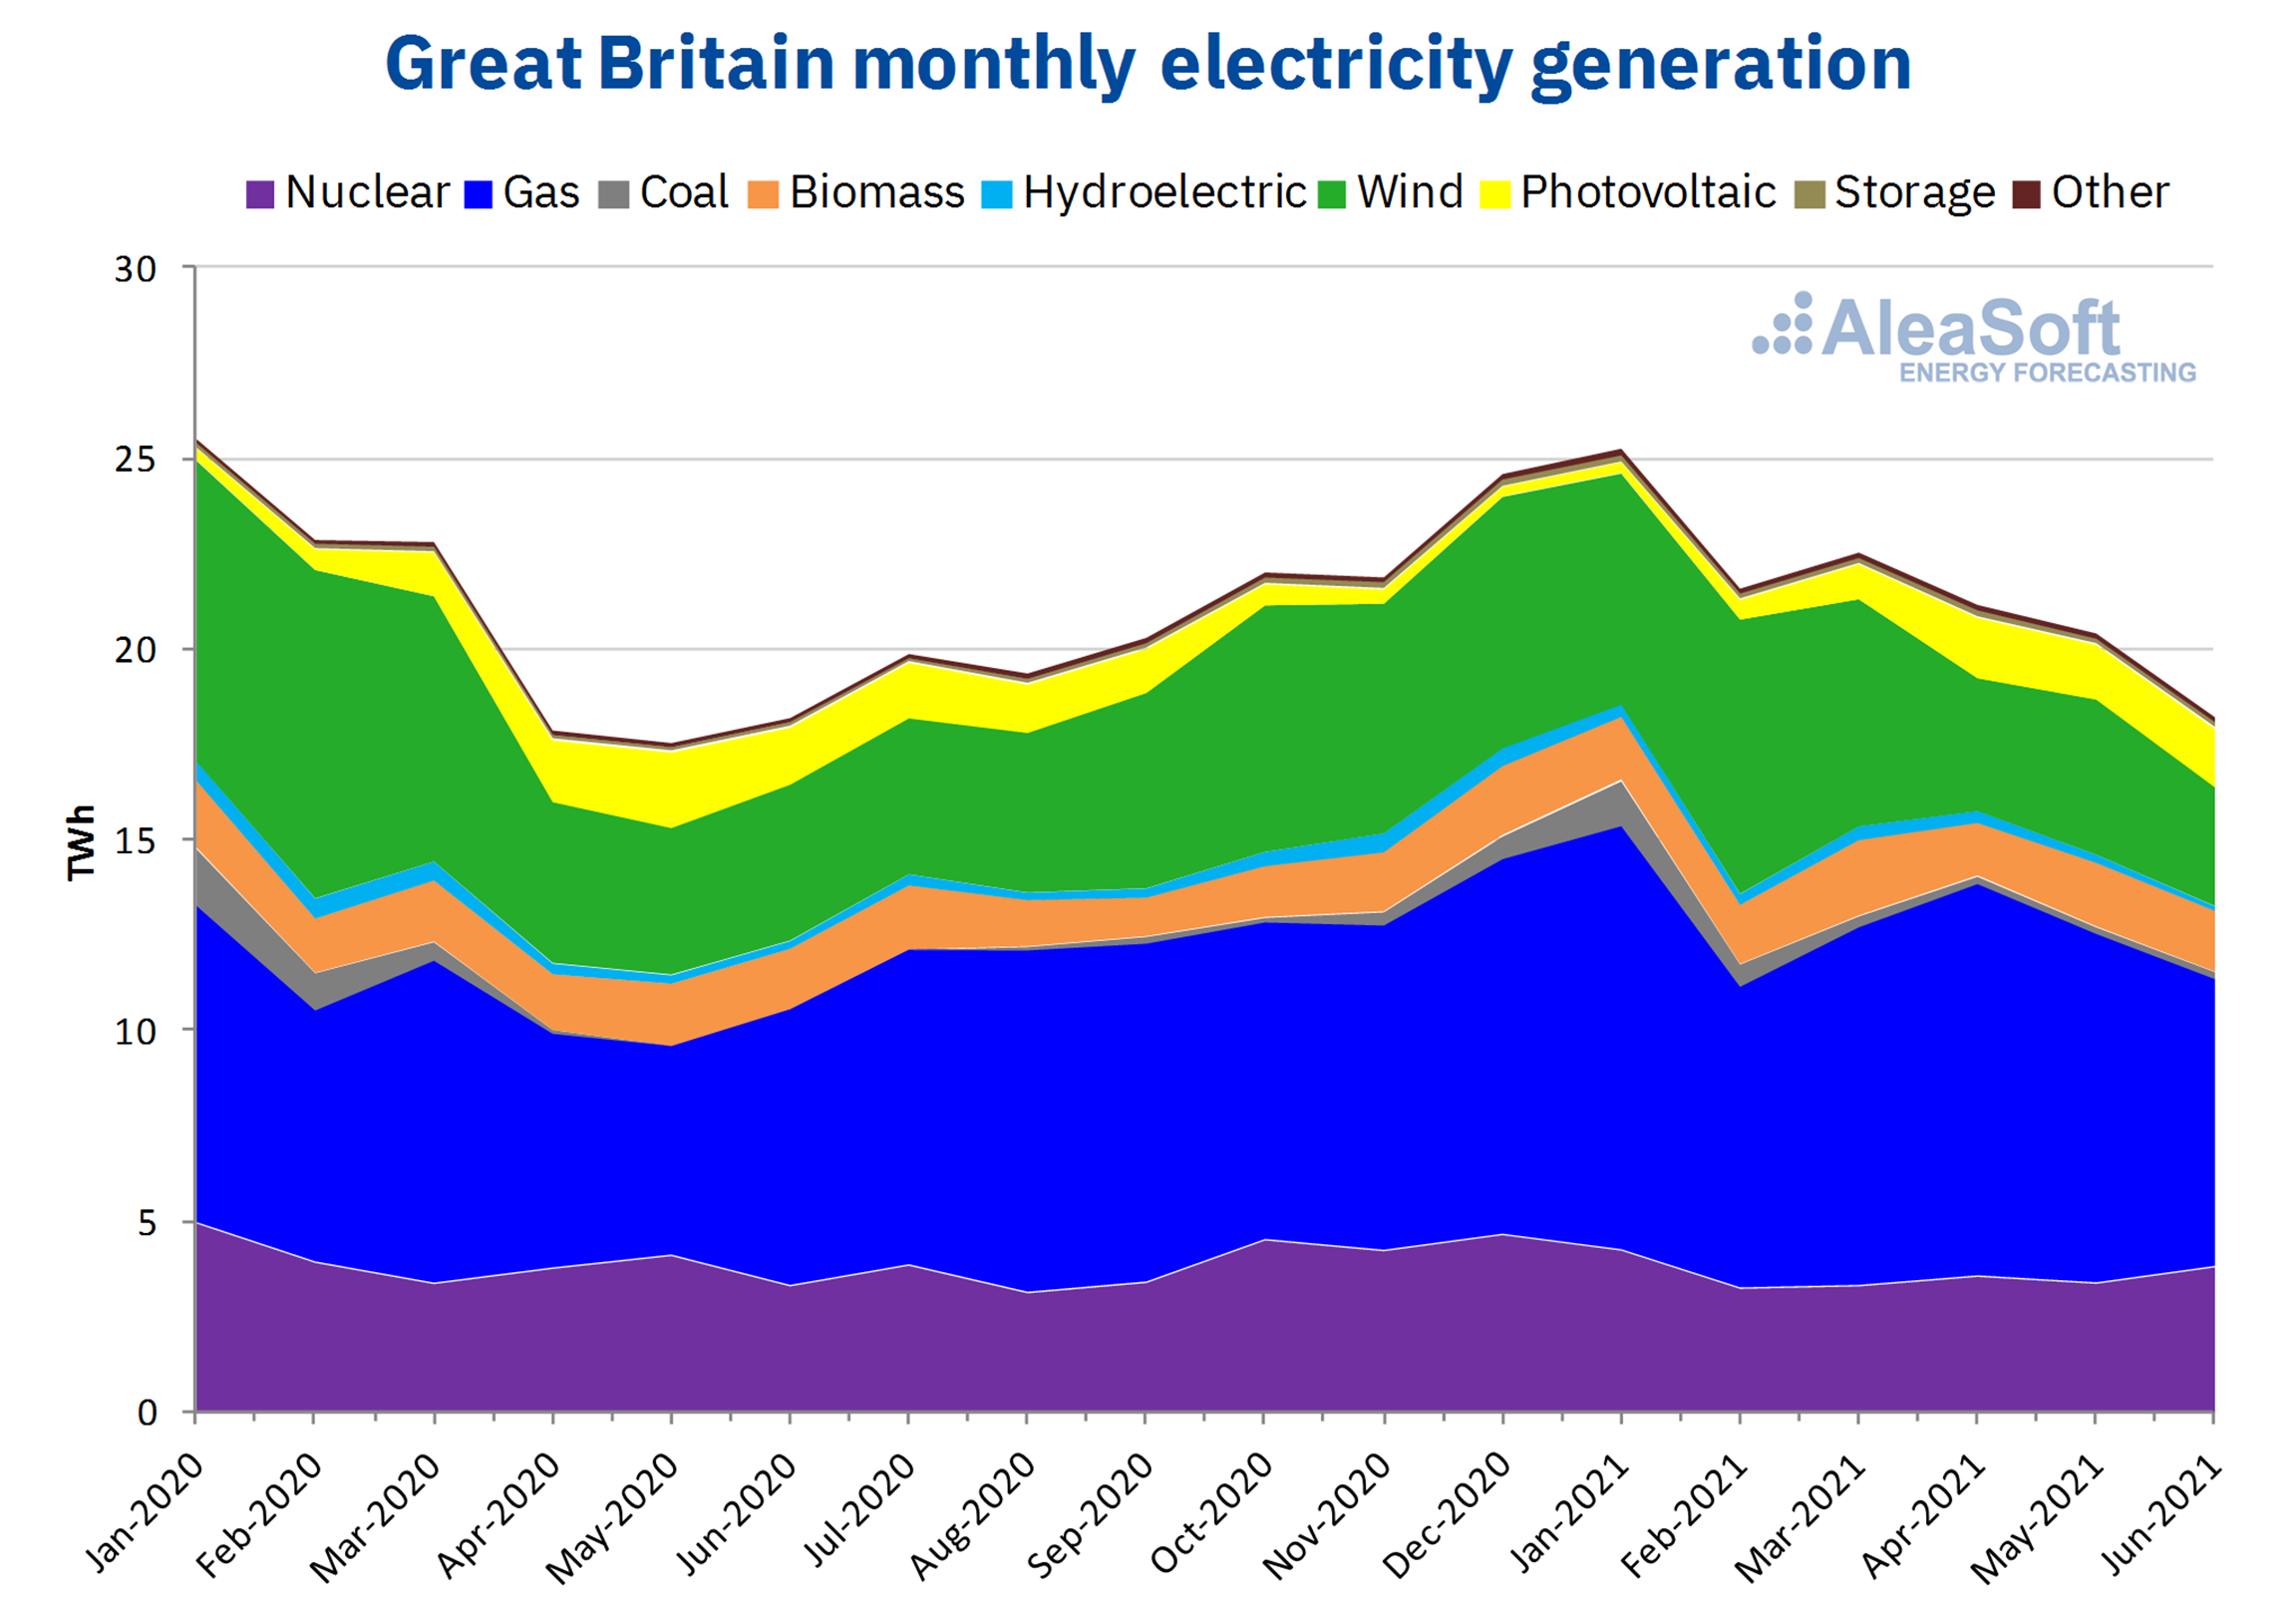
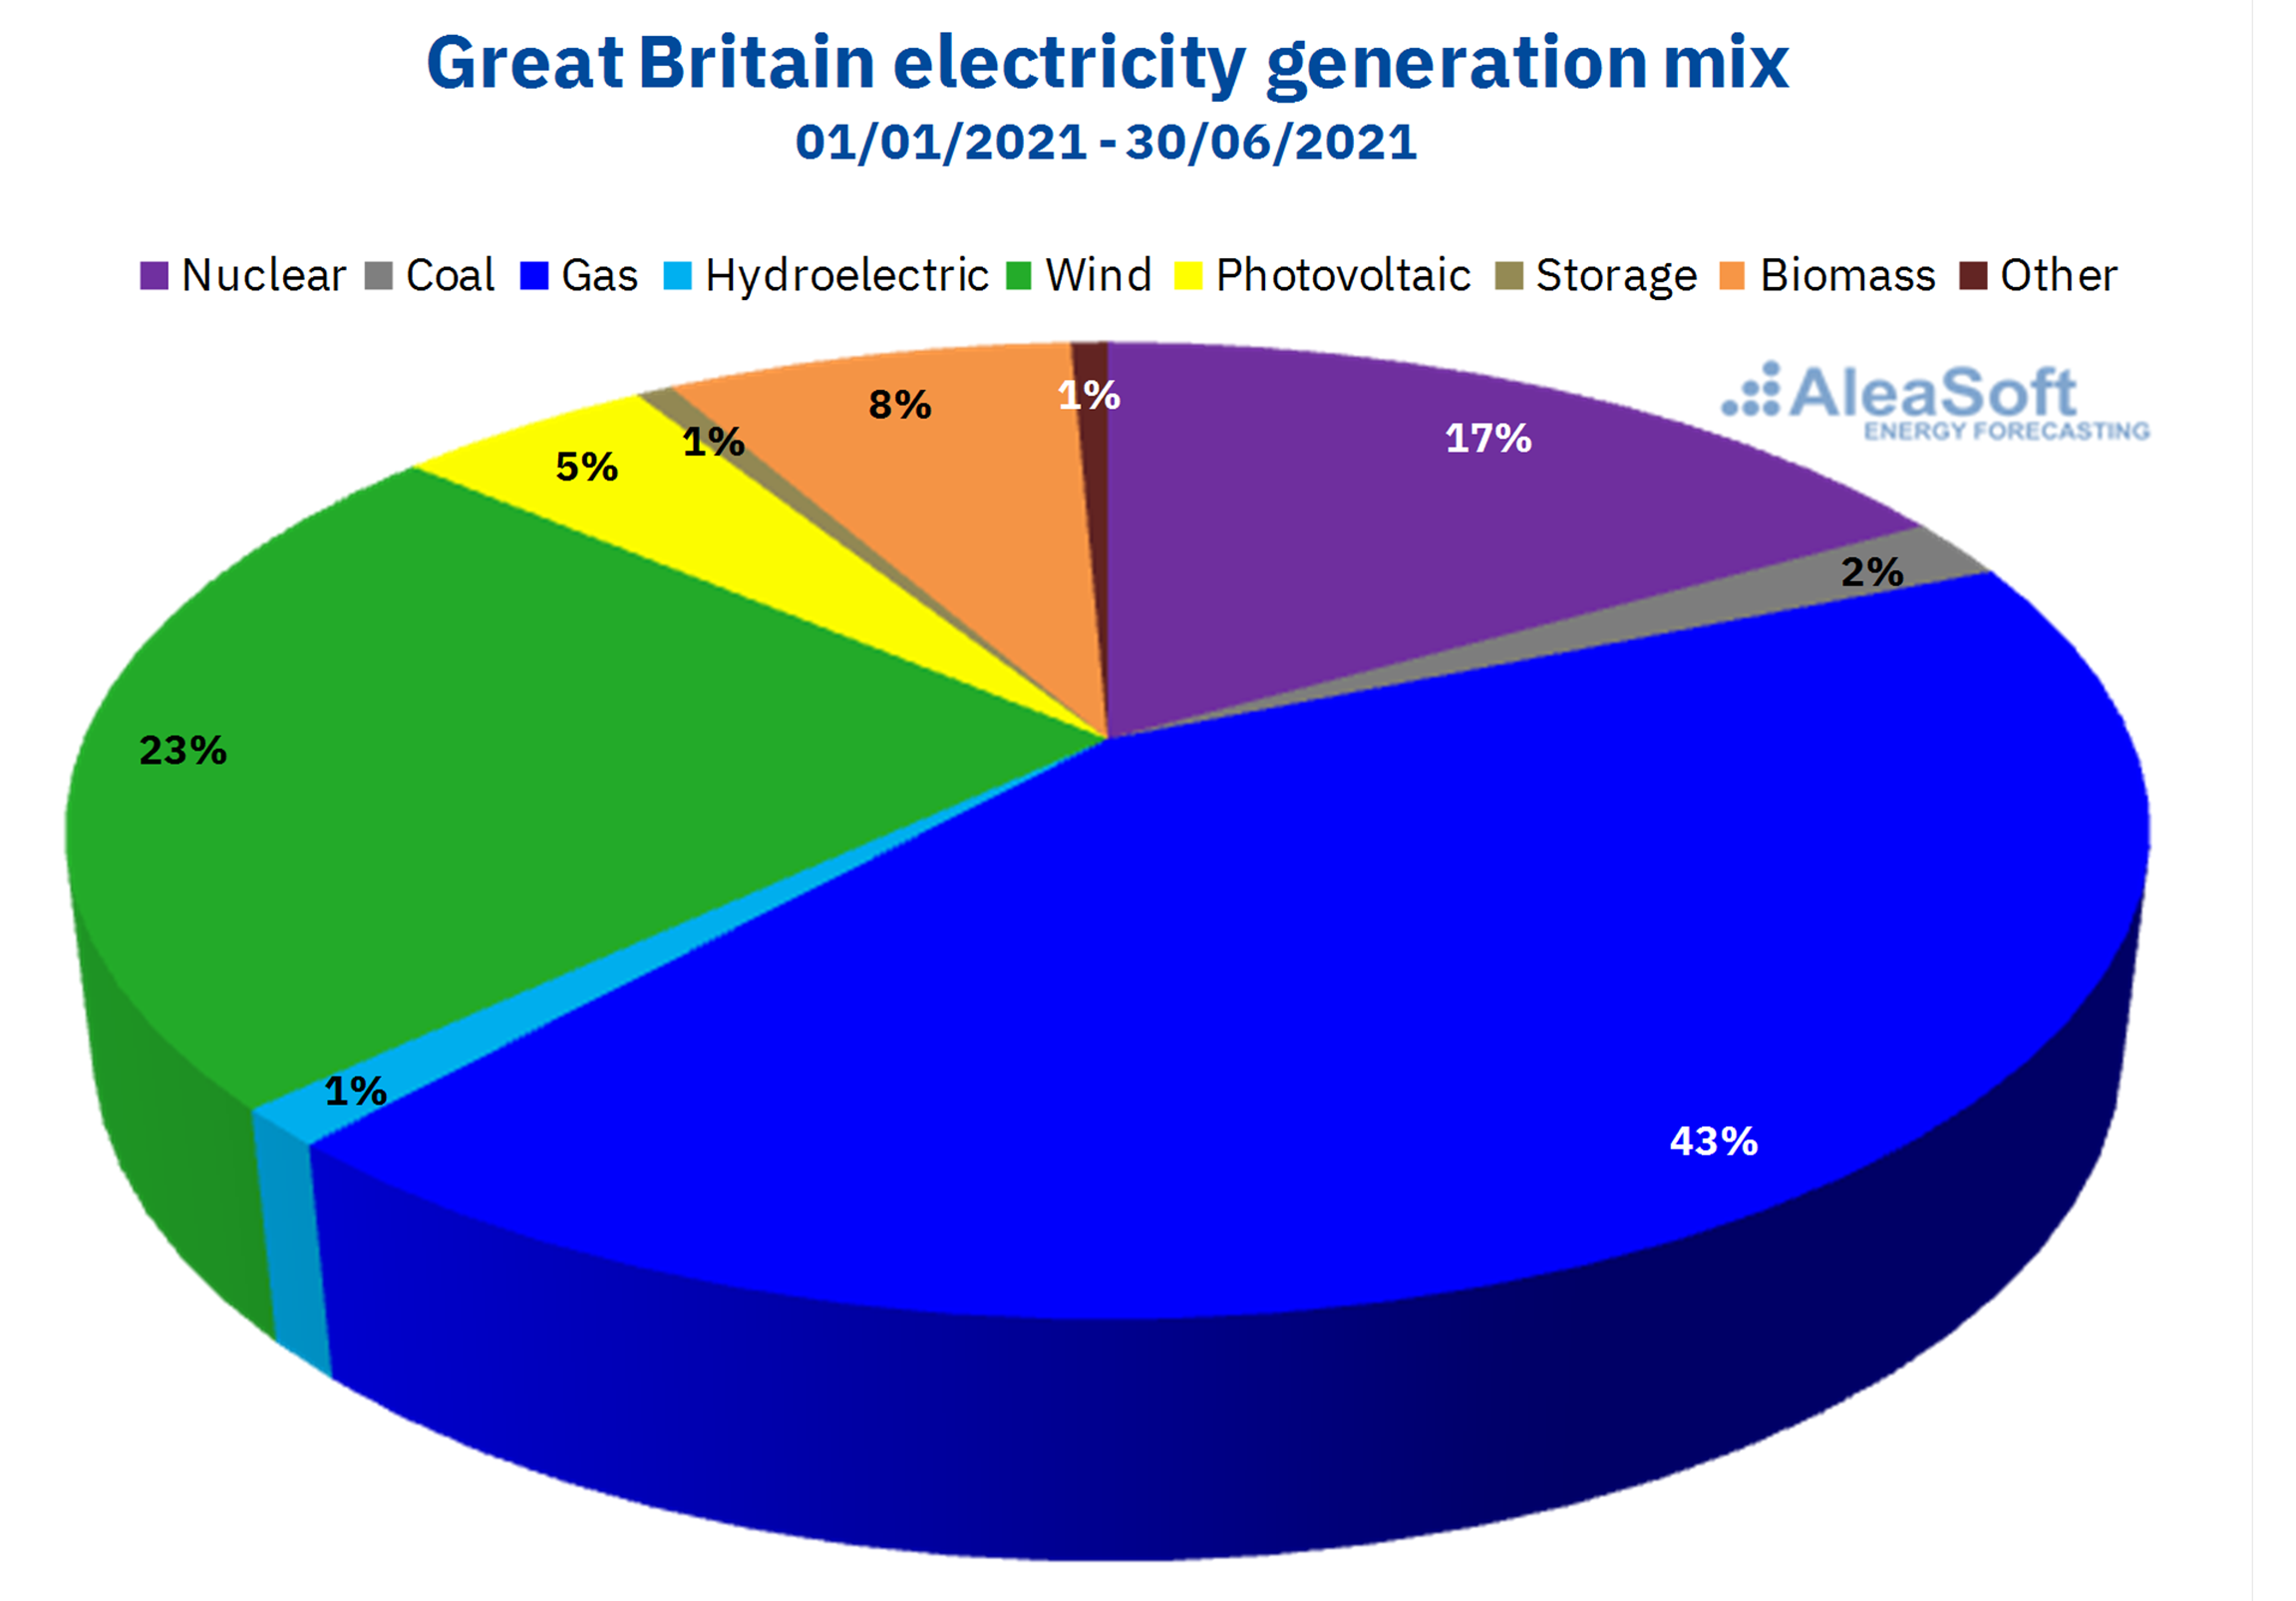
The production with gas is by far the largest contributor to Great Britain’s electricity generation mix. In the first half of 2021, the generation with this fossil fuel increased by 31% in year‑on‑year terms and by 4.9% compared to the second half of 2020, contributing 43% of the total generation in the first six months of the year as a whole. In the coming years, gas will continue to be present in Great Britain as a backup source for renewable energy technologies.
The wind energy production ranked second in Great Britain’s generation mix with a 23% share, although this percentage is slightly lower than 29% and 25% achieved in the first and second half of 2020, when it also ranked second. In fact, the production with this technology decreased by 16% compared to the first half of 2020 and by 8.0% compared to the second. It is expected that the installed capacity of this technology will continue to increase in the coming years and that by 2030 it will be able to supply more than half of the country’s electricity demand.
The third technology in terms of contribution to the generation mix in the first six months of 2021 was the nuclear energy, with 17%, a position that it also occupied in the two previous periods, in both cases with 19% of all production. Compared with the two previous periods, the nuclear energy production fell by 8.0% and 9.3% compared to the first and second halves of 2020, respectively. Seven of the eight existing nuclear power plants are planned to be closed this decade.
 Source: Prepared by AleaSoft using data from National Grid.
The solar energy production increased by 24% in the first half of the year compared to the previous half but it fell by 12% year‑on‑year. With 4.8% of total energy production, it was the fifth technology in terms of contribution to the generation mix, behind biomass, which represented 7.6% in this period. In the coming years, the solar energy capacity is expected to continue to increase but at a more moderate rate than that of the wind energy.
It is worth highlighting the presence of storage in the British generation mix. Although its contribution is still low, in the first half of the year the electricity from storage increased by 30% and 7.3% compared to the first and second half of 2020, respectively.
 Source: Prepared by AleaSoft using data from National Grid.
Electricity futures
During the first six months of 2021, the electricity futures prices for the next calendar year 2022 registered a clearly increasing behaviour. Both in the EEX market and in the ICE market, these futures increased by more than 22% during this period.
In the last session of the first half of 2021, the prices of this product in the EEX and ICE markets were £72.96/MWh and £73.03/MWh respectively.
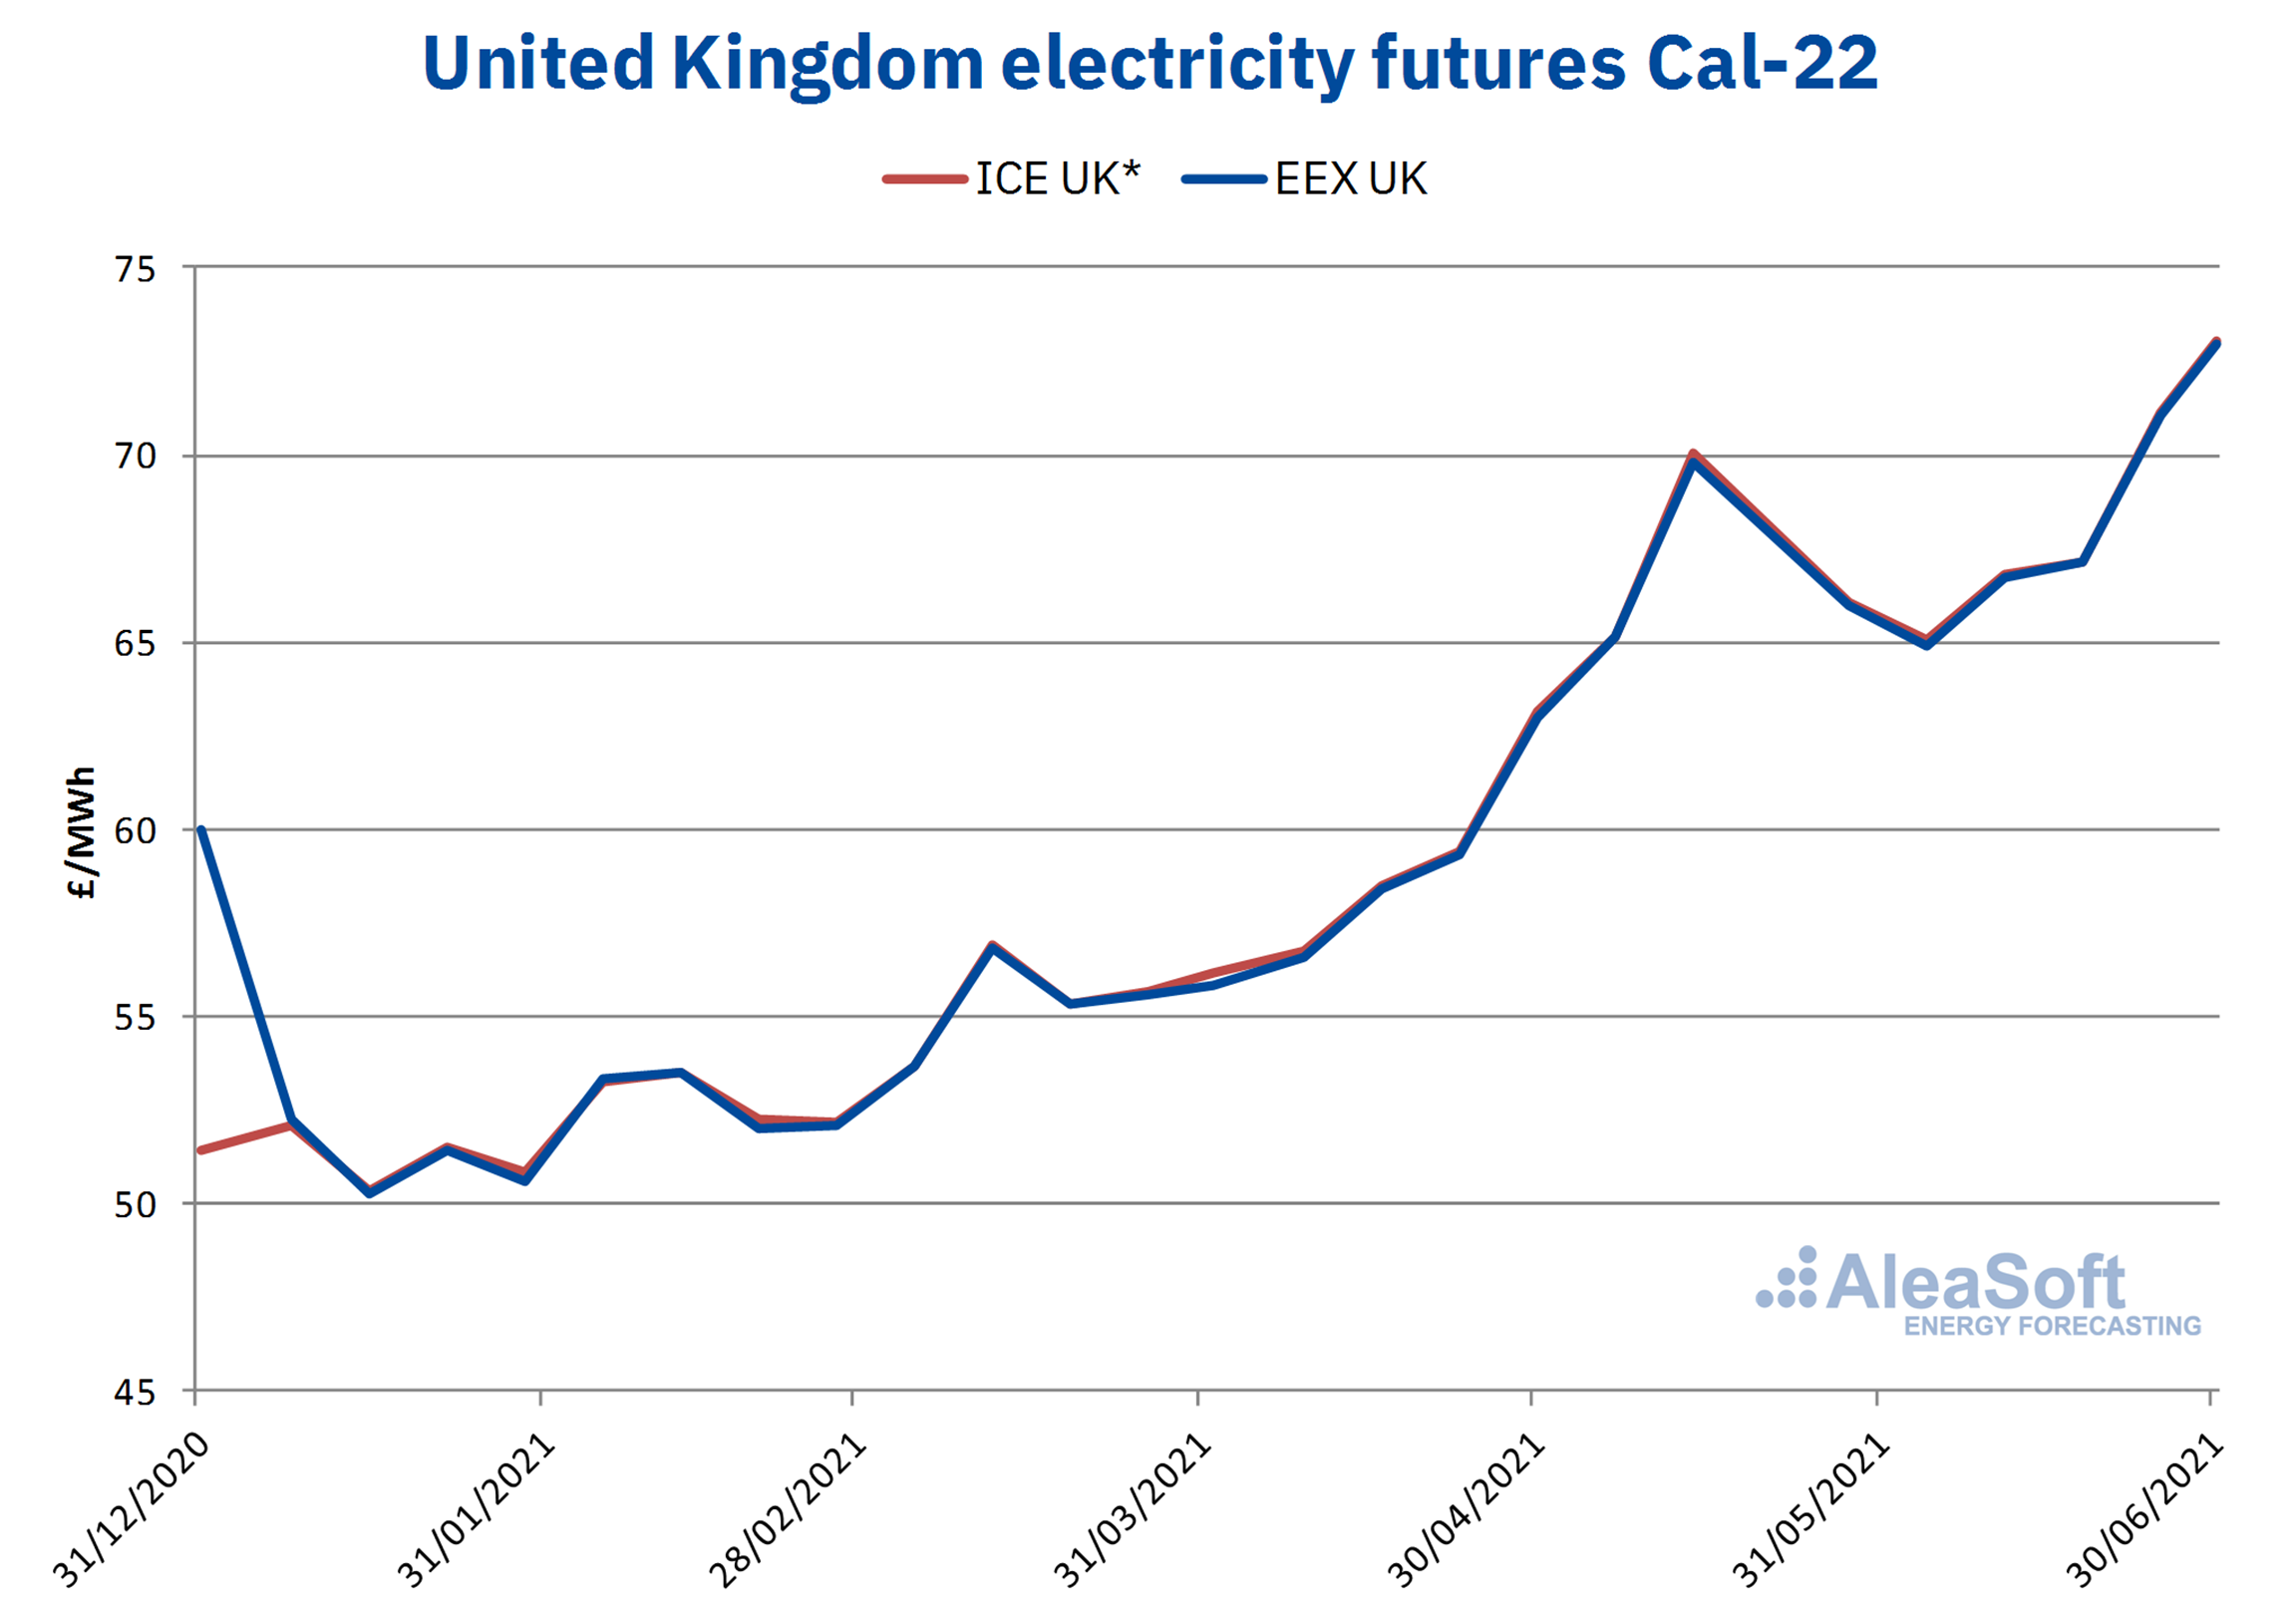 * Data obtained from monthly products.
Source: Prepared by AleaSoft using data from EEX and ICE.
International exchanges
The balance of the international exchanges of the United Kingdom was importer during the first half of 2021 as in the two previous periods. The highest volume of exchanges was registered between the United Kingdom and France, with an import balance of 8.3 TWh, which represented an increase of 52% compared to the first half of 2020 and 140% compared to the second half of that same year. Out of all the interconnections, the only one that registered an export balance during the first half of 2021 was that of Ireland with 0.2 TWh, contrary to what was registered in both halves of 2020 in which the balance was importer. It should be noted that the interconnection with Ireland was also the one with the lowest volume of energy exchanges, with only 0.8 TWh in the first half of 2021.
To the interconnections with France, Belgium, Ireland and the Netherlands was added the interconnection with Norway, through the North Sea link completed in June 2021. This link, which is the longest submarine energy transmission cable so far in the world with 730 km long, was proposed in 2003 and the testing phase began in mid‑June 2021. The Viking Link with Denmark is also under construction, which is expected to exceed the North Sea link by 10 km in 2023 and thus continue to contest the world record for the longest subsea energy transmission link.
AleaSoft’s analysis on the prospects for the energy market in the United Kingdom
In the context of uncertainty with the departure of the United Kingdom from the European Union and the situation of high prices in the markets, it is very important to have scientifically‑based forecasts that provide a picture of which the long‑term market trend is in order to be able to minimise risks in decision making. At AleaSoft, forecasting reports of European markets, including the UK market, are carried out, which reflect the expected behaviour in the medium and long term. A special promotion is currently in force for these reports.
To promote knowledge and exchange between all market agents, AleaSoft organises webinars in which topics related to the European electricity sector are analysed and debated. The next meeting is set for October 7 and it will feature the participation of speakers from Deloitte, who together with the regulars from AleaSoft will analyse the state of the European electricity markets in the recovery from the crisis, a year after that held with these same speakers in October 2020. The registration to attend this webinar is already open. Among other issues, the renewable energy projects financing and the importance of the forecasting in audits and portfolio valuation will be addressed.