AleaSoft, November 14, 2019. This week the solar energy production fell in much of Europe. In the case of the wind energy, there were also declines in the Iberian Peninsula, although in the rest of Europe it increased. The decline in the renewable energy production was added to the general drop in temperatures, which increased the European electricity demand, causing the prices to rise in much of the continent. The Iberian market was the one with the greatest increase in prices so far this week.
Photovoltaic and solar thermal energy production, wind energy production and electricity demand
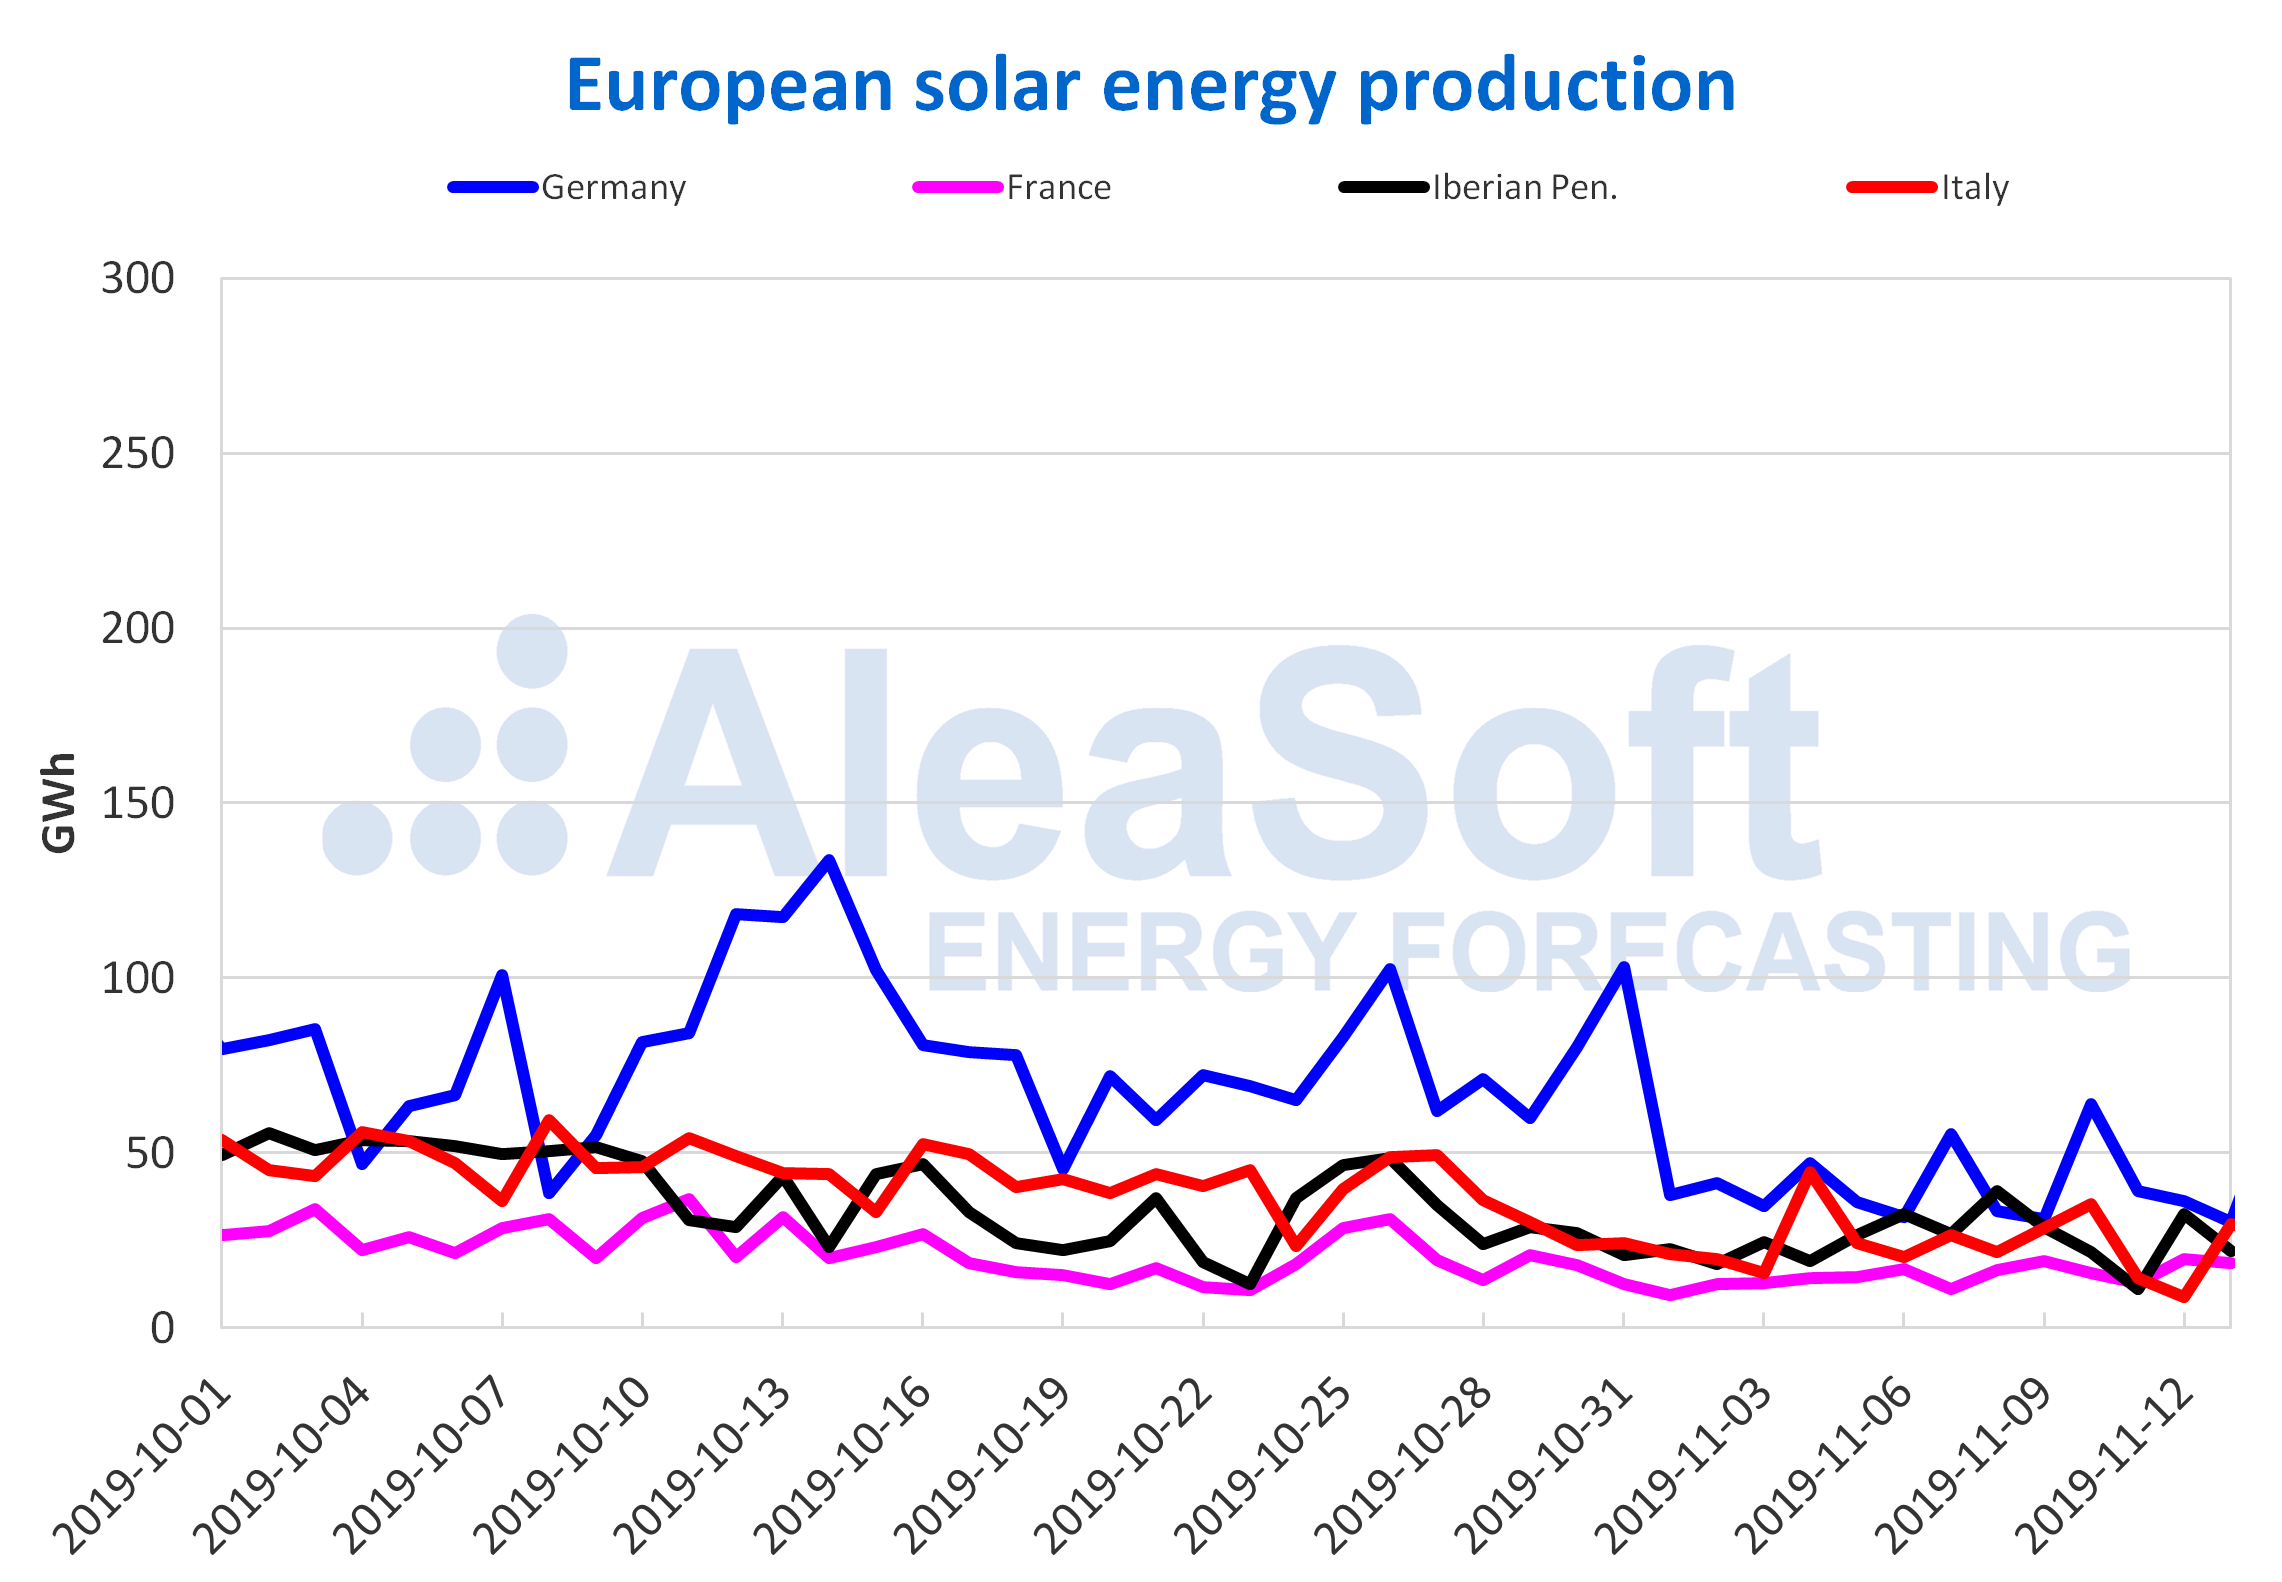
This week the solar energy production decreased in most of the European markets analysed with respect to the average values of last week, except in France where there was an increase of 11%. In Italy there was a setback of 39%, and in Germany of 17%. According to AleaSoft’s forecasts, at the end of this week in these two markets, the production will have fallen compared to last week, which would account for the sixth week of falls in Germany.
In the days since November started, the year‑on‑year increase in the Iberian Peninsula, of 44%, stands out. In the case of France, the production was 5.4% above. On the other hand, Italy and Germany had declines of 2.0% and 14% respectively.
Source: Prepared by AleaSoft using data from ENTSO-E, RTE, REN, REE and TERNA.
Sources: Prepared by AleaSoft using data from ENTSO-E, RTE, REN, REE and TERNA.
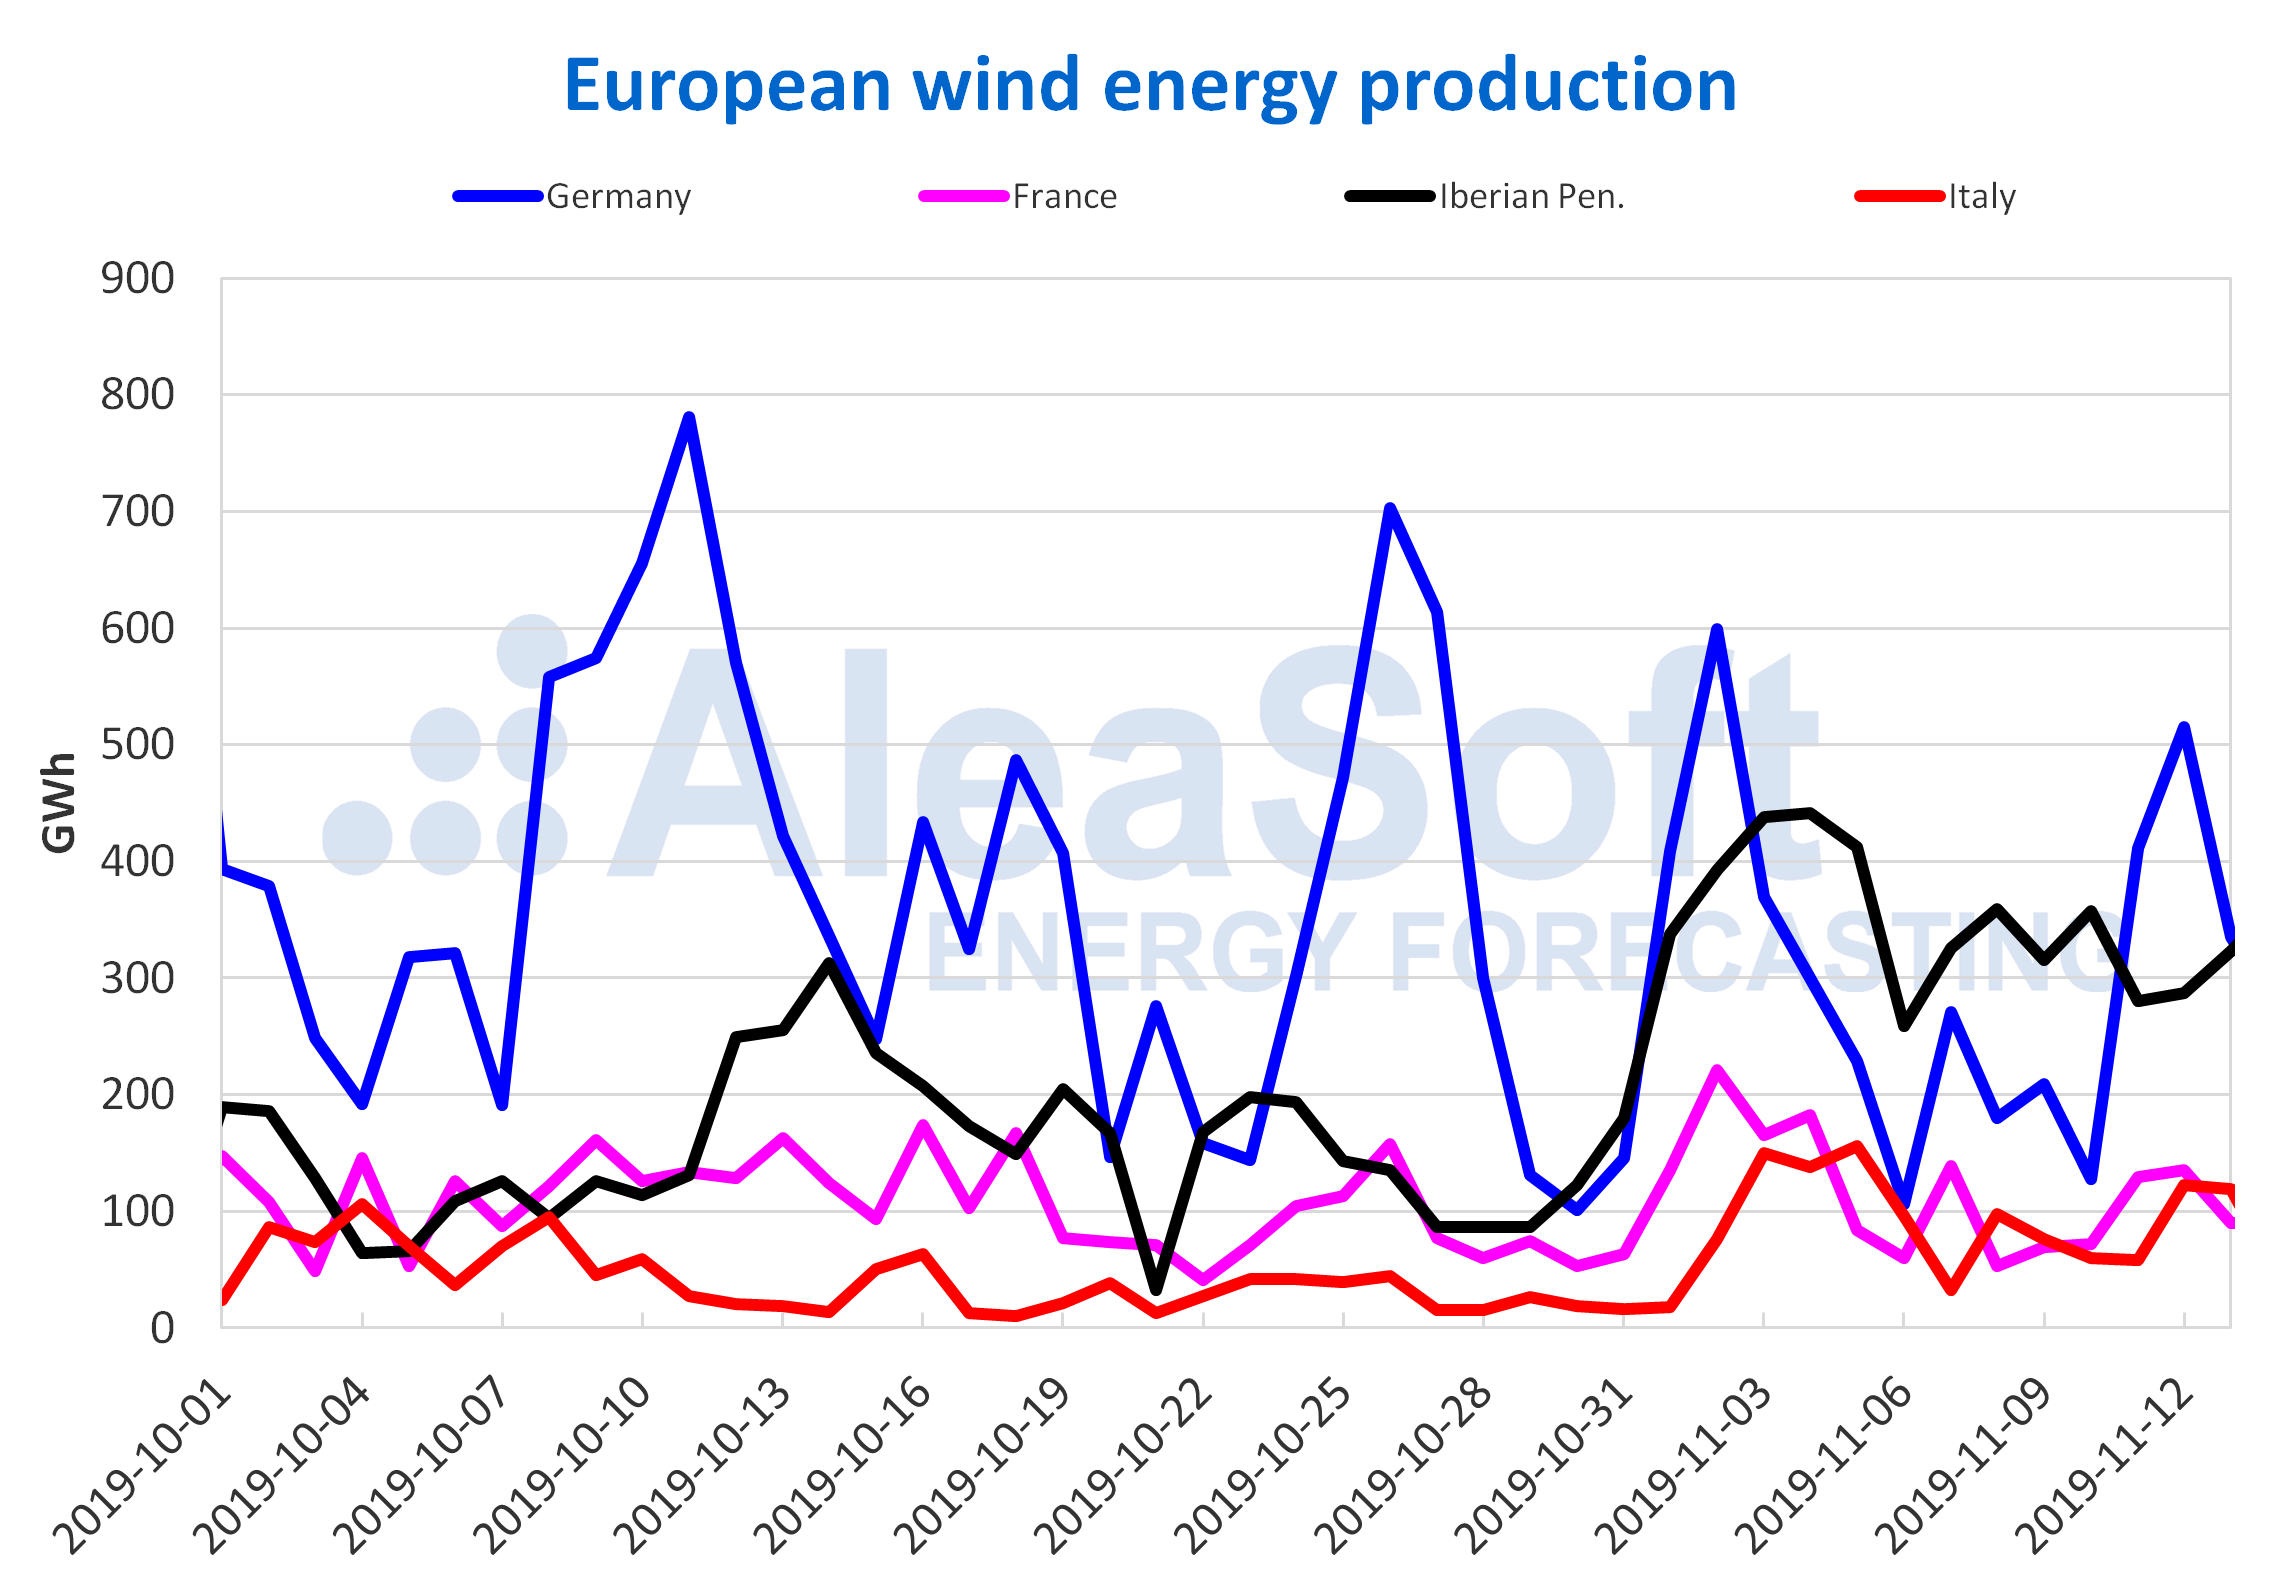
So far this week, Germany’s wind energy production had a recovery of 107% compared to last week’s average. There was a 26% increase in France and 6.9% in Italy. This last market has a growing streak for the fifth consecutive week.
In the same way, in Germany there was a year‑on‑year increase of 7.3%, during the first thirteen days of November. In Italy, year‑on‑year production continues to increase significantly, in this case 247%. These increases also include France and Portugal, with variations of 20% and 46%, respectively.
On Friday, November 8, a total of 1 GW of capacity was granted for renewable energy production projects in Italy, as Terna published, about the capacity market auction for 2022. A second auction, which will cover 2023, will be held on Thursday, November 28.
Sources: Prepared by AleaSoft using data from ENTSO-E, RTE, REN, REE and TERNA.
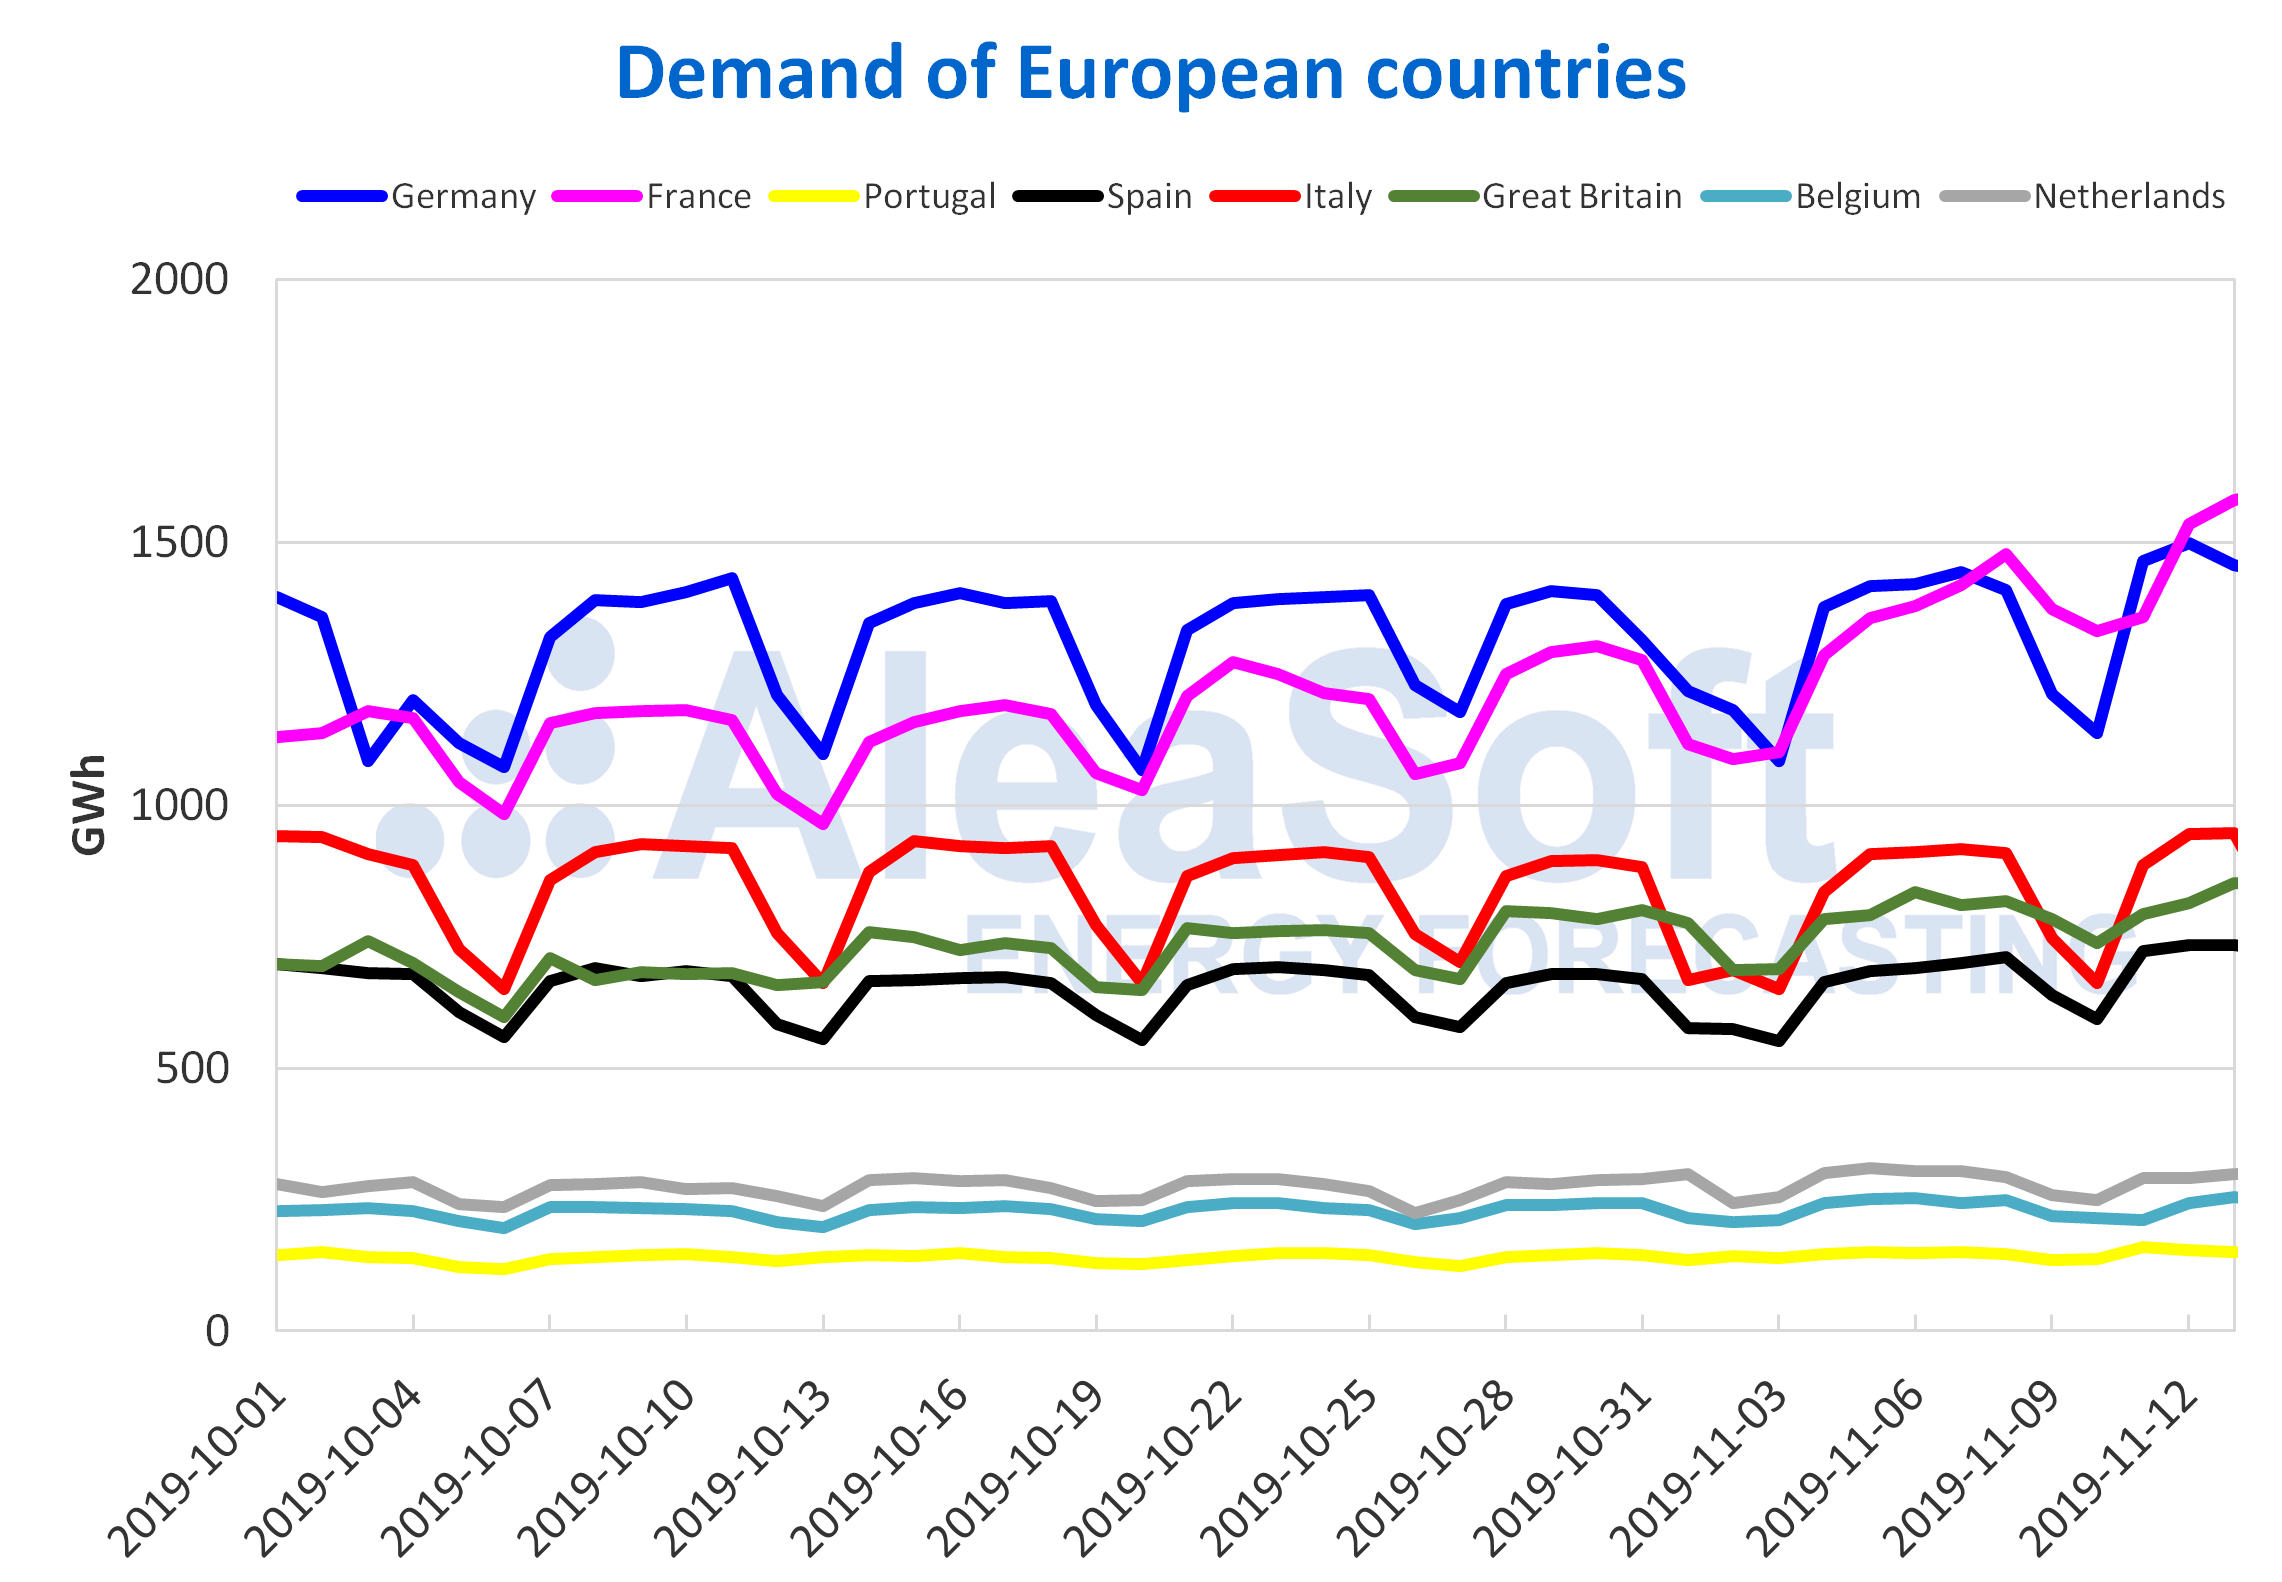
The electricity demand fell 4.9% in Belgium in the first three days of this week, due to the labour effect of the holiday of November 11. This holiday is also celebrated in France, but its effect was offset by the average temperatures that dropped 3.7 °C so far this week compared to the same period of days last week, as a result the demand increased in 11%. Portugal, Italy and Germany had close percentage increases of 4.2%, 4.8% and 4.9% respectively. At AleaSoft it is expected, that next week the electricity demand will decrease in Italy and Germany, while in the rest of the analysed countries it will increase slightly.
Source: Prepared by AleaSoft using data from ENTSO-E, RTE, REN, REE, TERNA, National Grid and ELIA.
Mainland Spain, photovoltaic and solar thermal energy production and wind energy production
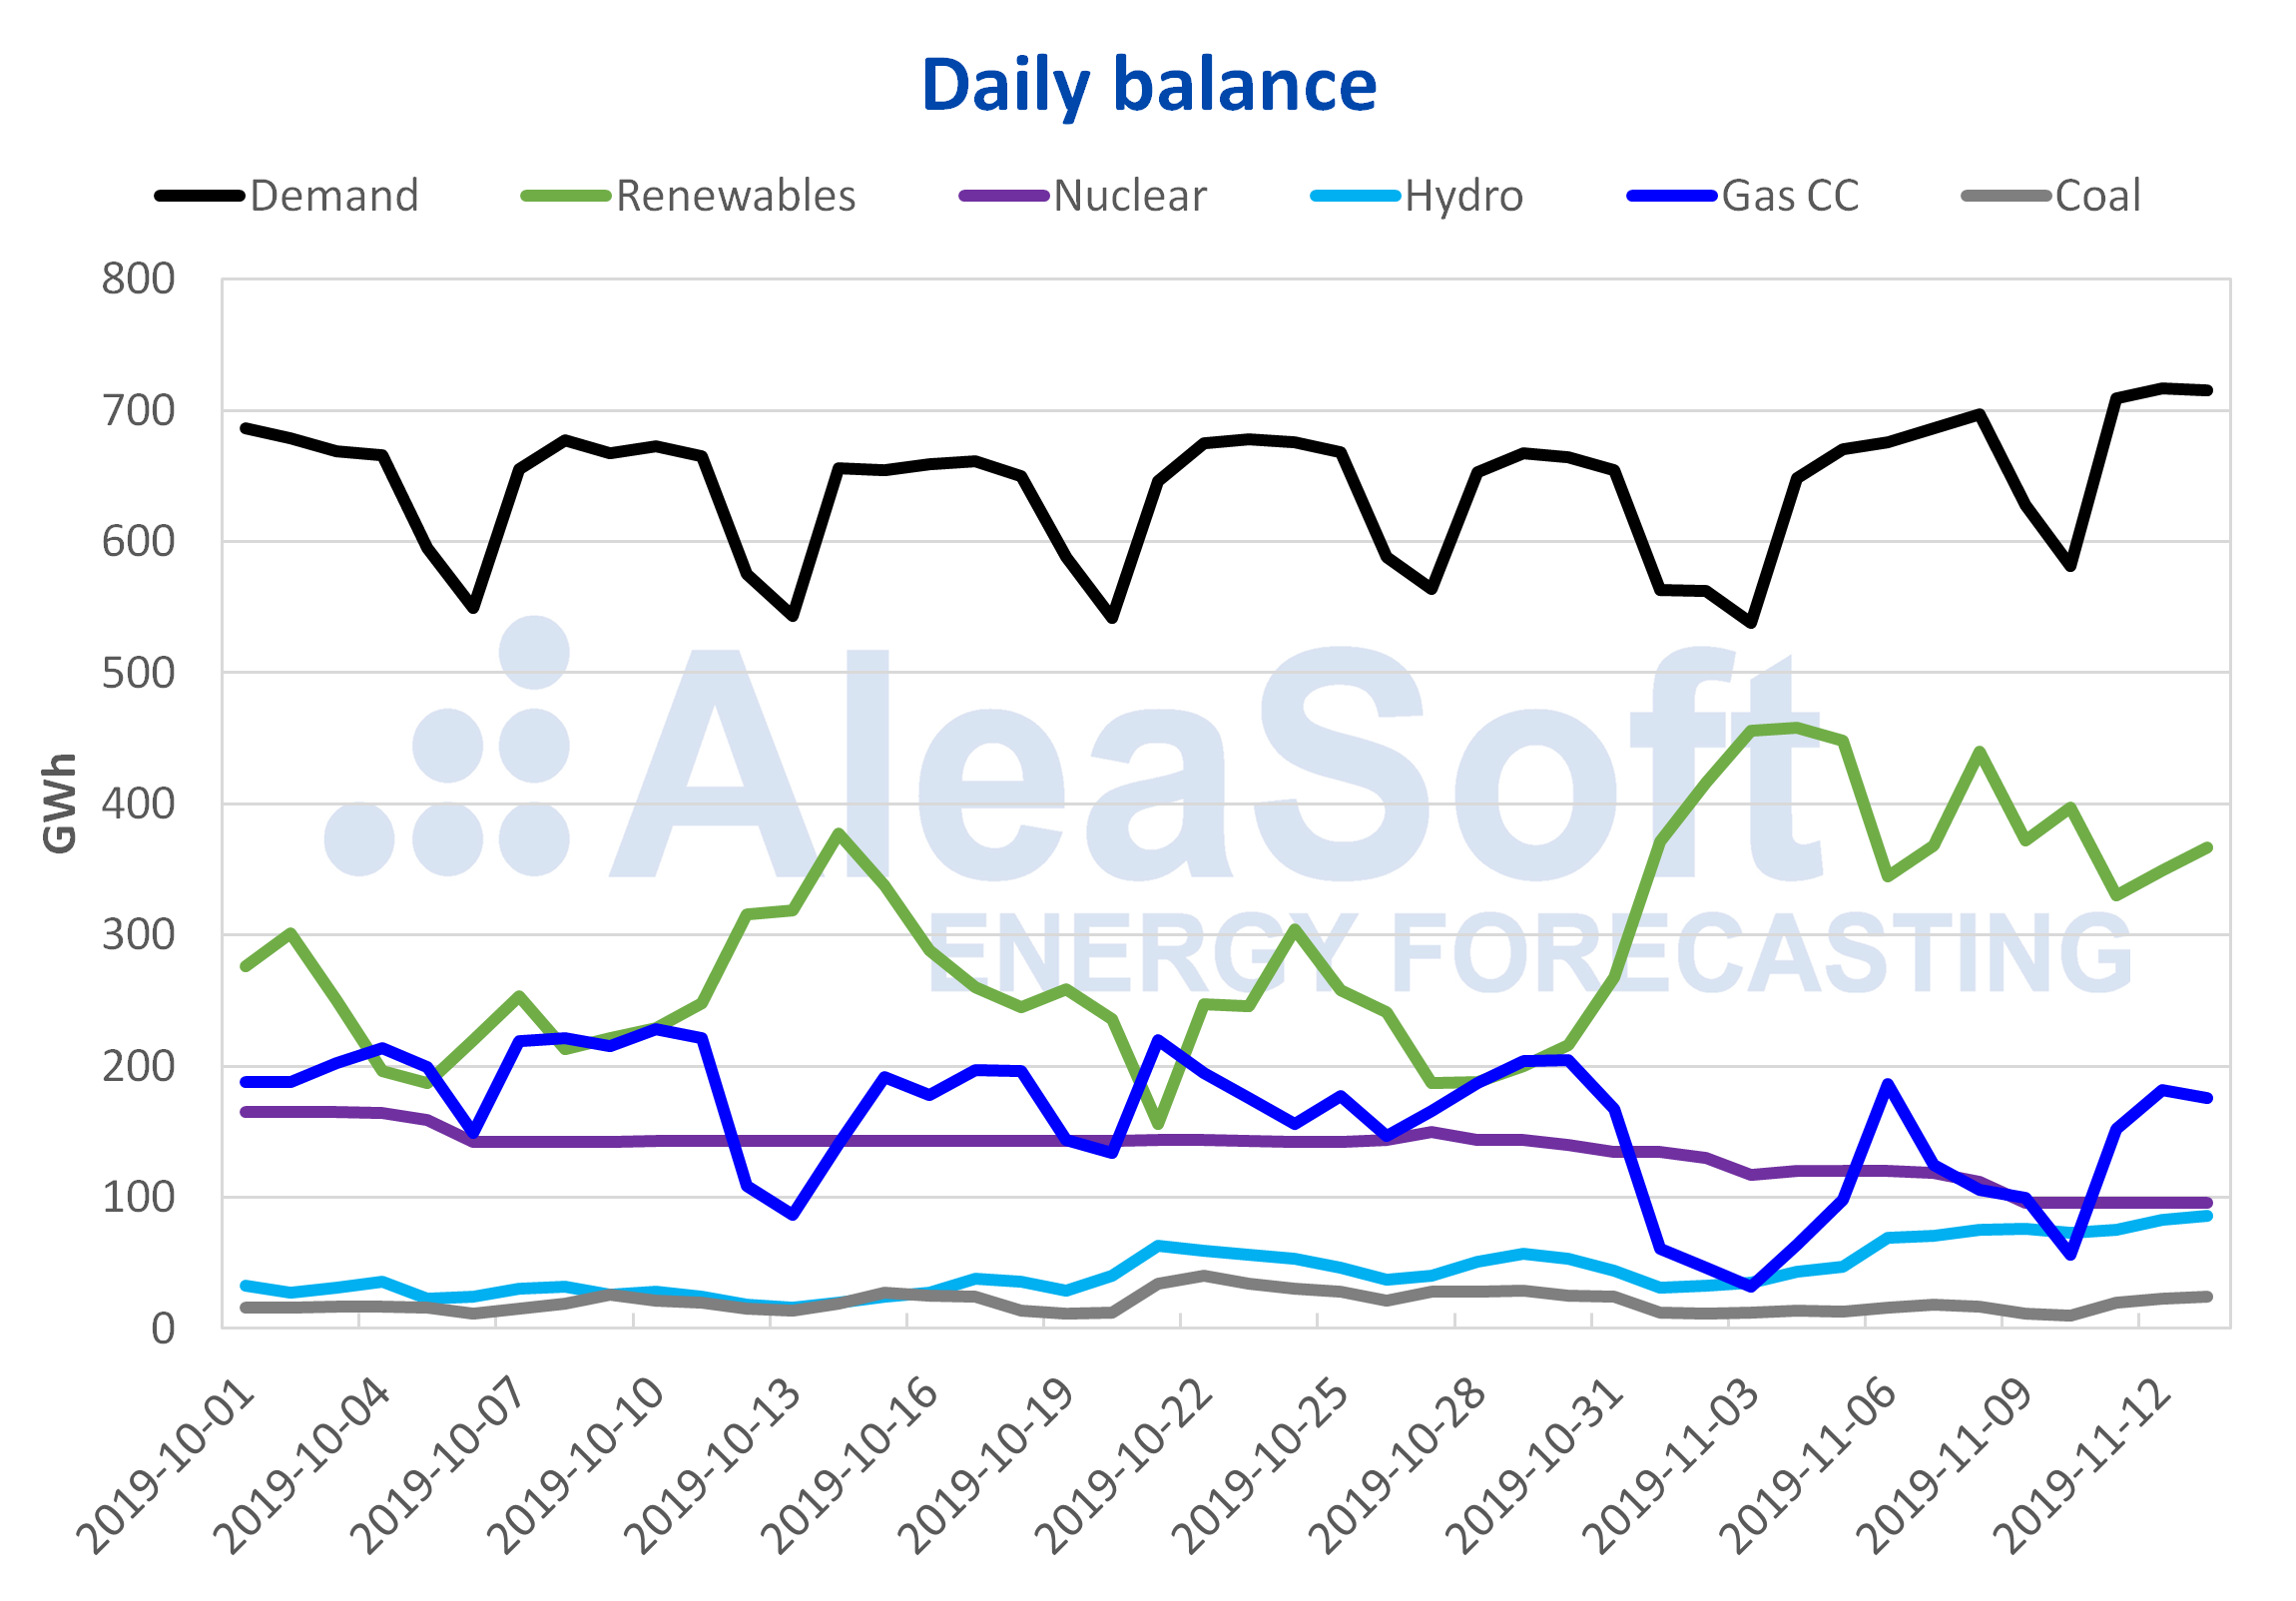
The solar energy production of Spain, which includes the photovoltaic and solar thermal technologies, fell by 22% from Monday of this week until Wednesday, compared to the average of last week. On Monday, November 11, a daily production of 10 GWh was registered, which represents the minimum since March 2019. However, during the days that elapsed of this month until yesterday November 13, a 45% year‑on‑year increase was achieved in Spain.
The average values of the wind energy production, so far this week, were lower than those of last week in the Spanish peninsular territory. After the consecutive increases of the average generation in the last two weeks, in these first three days of the week the fall was of 19%. In 2019 there was an increase of 67%, regarding the year‑on‑year comparison of the first 13 days of November.
This week the electricity demand of Mainland Spain continued to increase. The increase was 7.4% from Monday to Wednesday of this week compared to the same period last week. This is mainly due to the 2.6 °C decrease in average temperatures so far this week.
The reactor number II of the Almaraz nuclear power plant is currently in start‑up mode, while the Cofrentes power plant continues to be stopped by refuelling. The Vandellós power plant is stopped for refuelling since Saturday, November 9. This caused a decrease of the average nuclear energy production of 14%, in the first three days of this week with respect to the same period of the previous week.
The Plenary of the Nuclear Safety Council (CSN) approved at its meeting on Wednesday November 13, a unified criterion to “establish the start date of the design life and the period of long‑term operation of the Spanish nuclear power plants”. The agreed criterion determined that the initial moment to count the 40 years of design life of the nuclear power plants must be taken from the date of the first connection to the electricity grid.
With the new unified criteria of the CSN, Almaraz I will turn 40 in 2020. In the case of Ascó I it will be in 2022, Almaraz II in 2023, and Ascó II and Cofrentes, in 2024. On the other hand, Trillo and Vandellós II were launched 32 years ago.
Sources: Prepared by AleaSoft using data from REE.
The hydroelectric reserves increased 1.2% according to data from the latest Hydrological Bulletin of the Ministry for Ecological Transition. Currently the level is at 8172 GWh, which constitutes 36% of the total capacity.
European electricity markets
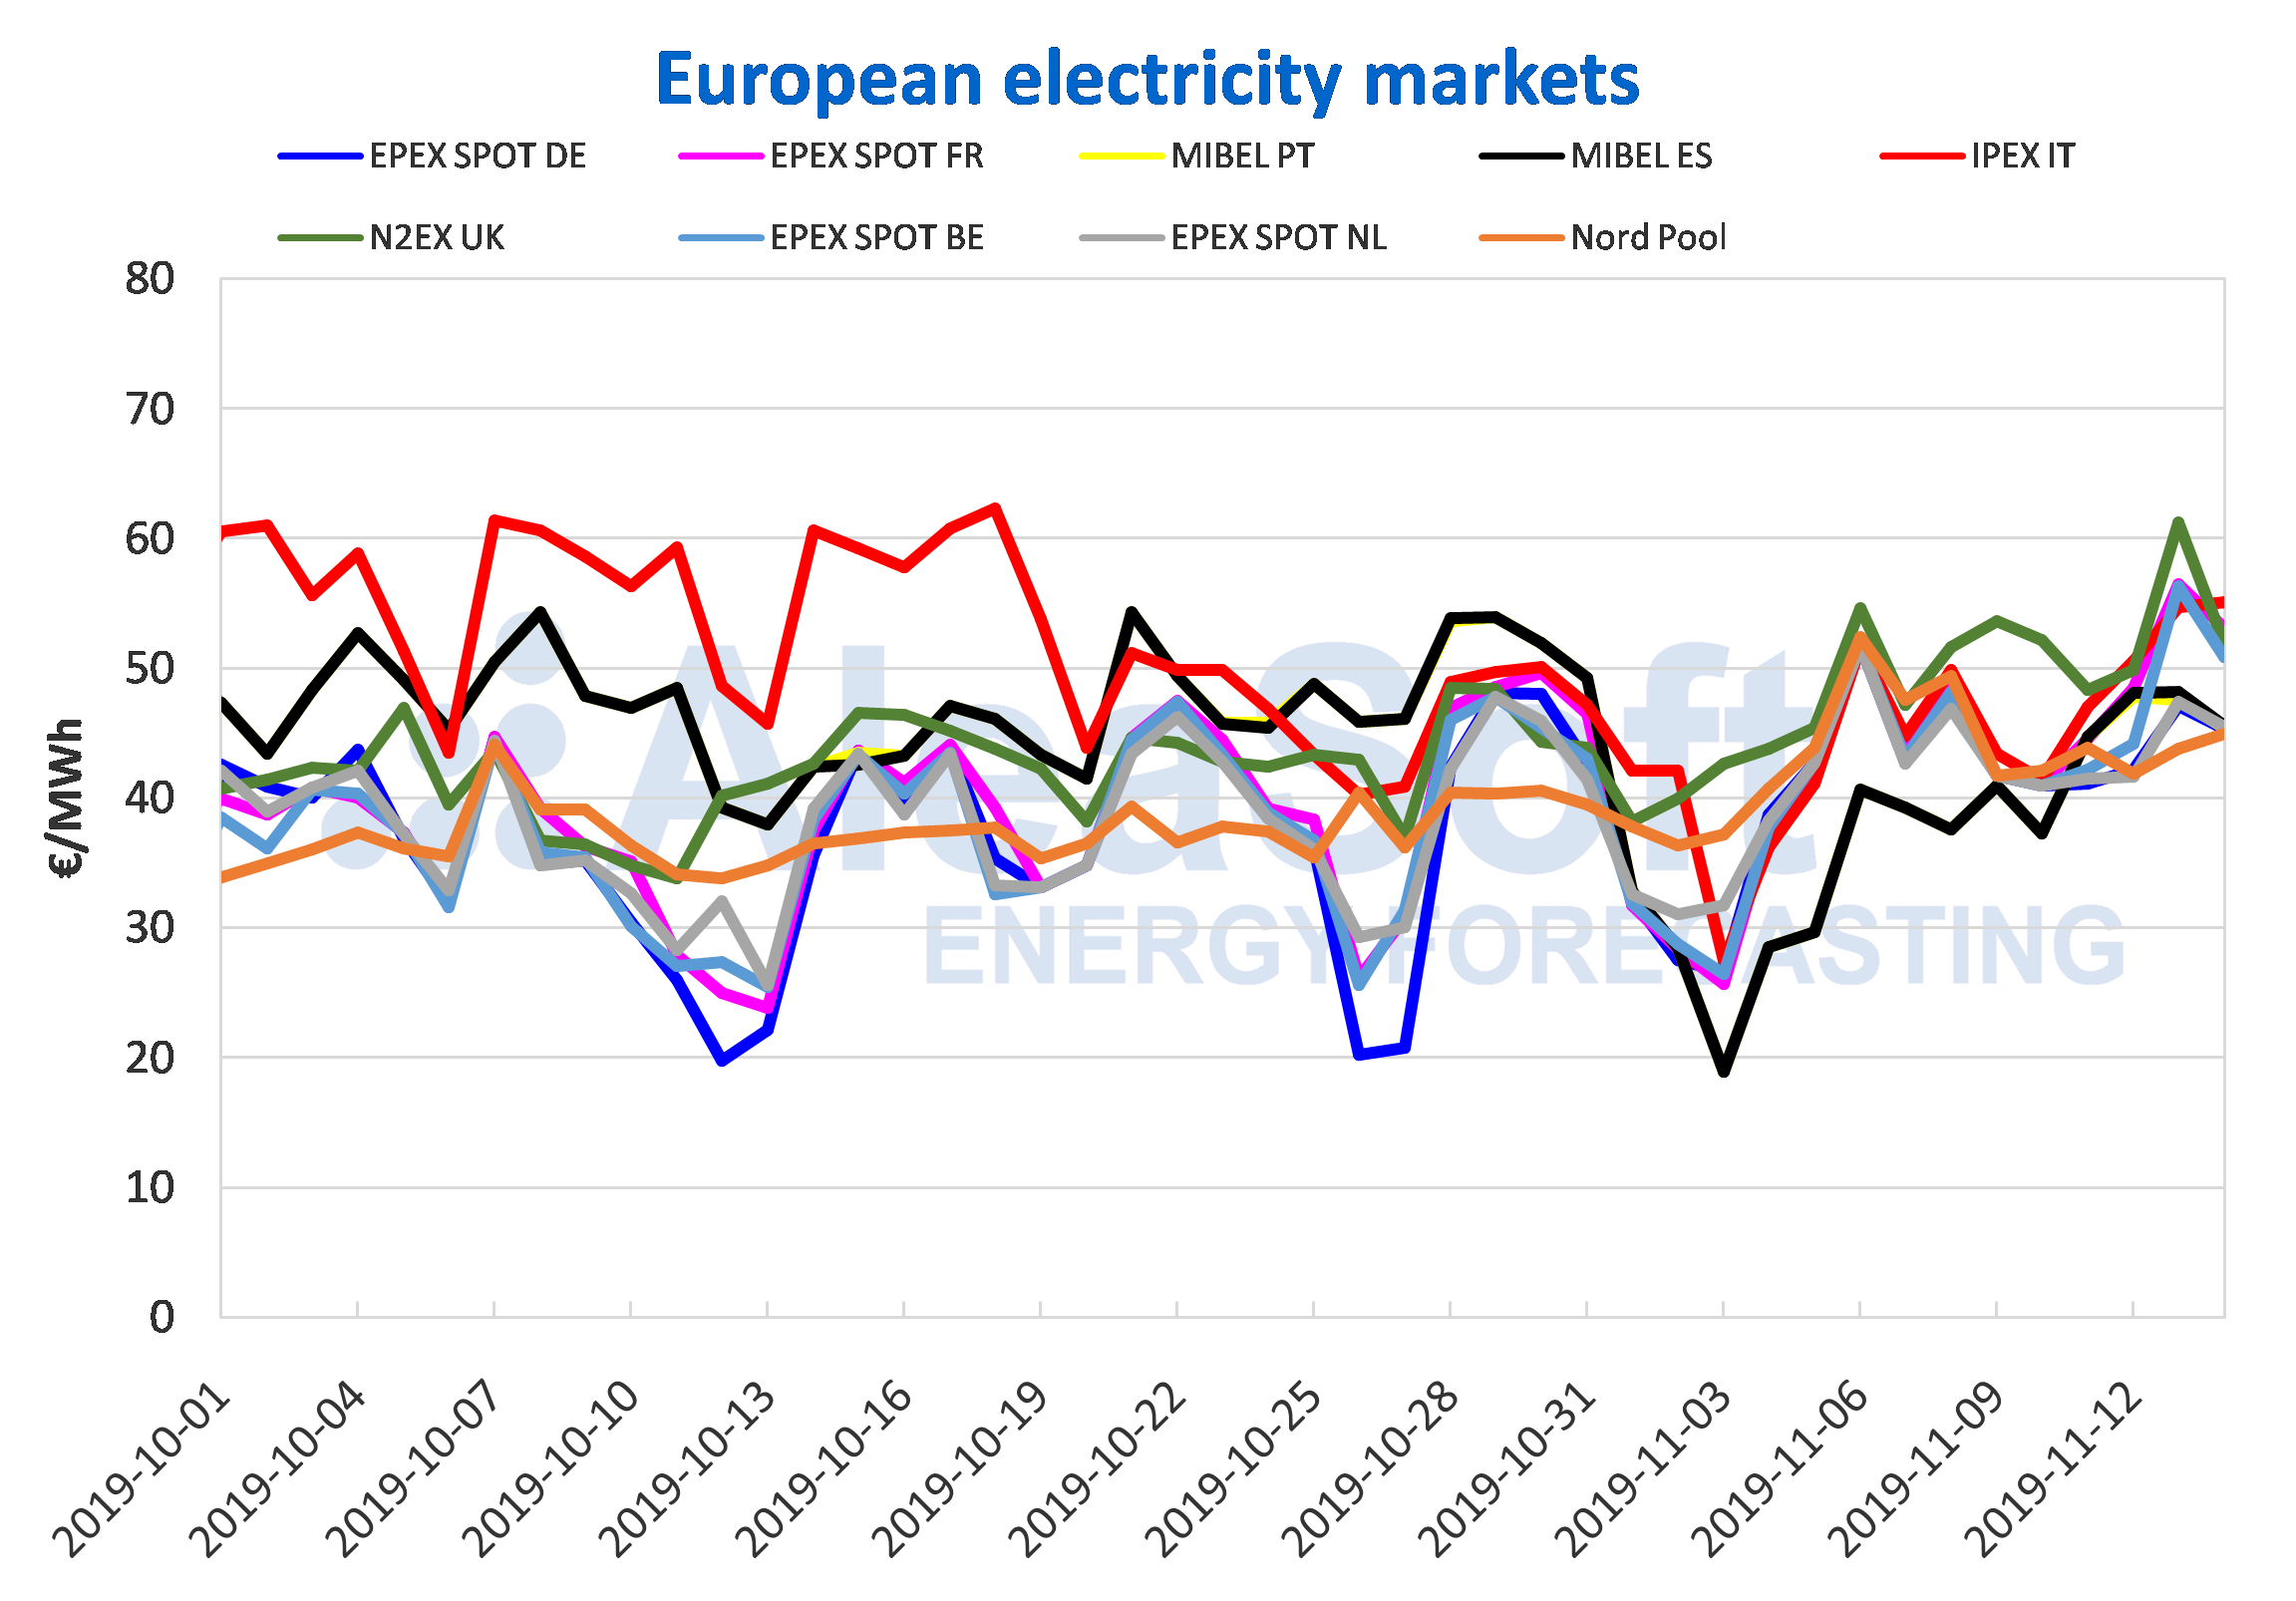
So far this week the average price of most European electricity markets increased over the same period last week, with the exceptions of the Nord Pool market of the Nordic countries and the EPEX SPOT market of Germany, which had decreases of 5.5% and 0.1% respectively. The rest of the countries registered increases between 0.4% of the EPEX SPOT market of the Netherlands and 35% of the MIBEL market of Spain. The increase in demand in much of Europe due to a general decrease in temperatures during the first three days of this week, together with the decline in solar and wind energy production in some markets, led to the upward trend of electricity prices.
During the first four days of this week, the market prices were in the range of €43/MWh to €53/MWh. The usual distribution of the markets in two groups according to their price this week was not fully met. The Nord Pool market of the Nordic countries, with an average of €43.61/MWh, regained its position as the lowest‑priced market in Europe, followed by the EPEX SPOT markets of Germany with €43.93/MWh and the Netherlands with €44.01/MWh. On the other hand, the N2EX market of Great Britain, corresponding to the group with higher prices, topped this list with an average price of €52.82/MWh, followed in second place by the €51.85/MWh of the Italian market IPEX. The EPEX SPOT markets of France and Belgium that belong to the lowest price group took the third and fourth place with the highest prices, settling with averages of €50.64/MWh and €48.37/MWh, respectively.
Source: Prepared by AleaSoft using data from OMIE, , N2EX, IPEX and Nord Pool.
Iberian market
In the MIBEL market, the average price for the first four days of this week was €46.63/MWh for the Spanish pole and €46.38/MWh for the Portuguese one. With increases of 35% and 34%, for Spain and Portugal respectively, they took the fifth and sixth place in the ranking of the markets with the highest prices in Europe. This week the MIBEL remained between €45/MWh and €48/MWh.
From Monday November 11 until today Thursday November 14, the daily average prices of the MIBEL market, both for Spain and Portugal, were increasing compared to the same days last week, with an approximate variation that ranges from €18/MWh of Tuesday 12 to €6/MWh of this Thursday. This increase in prices corresponds to the decrease in the wind and solar energy production that was registered since the beginning of this week, together with the increases in demand due to the low temperatures that began to register since the middle of last week in both countries.

Electricity futures
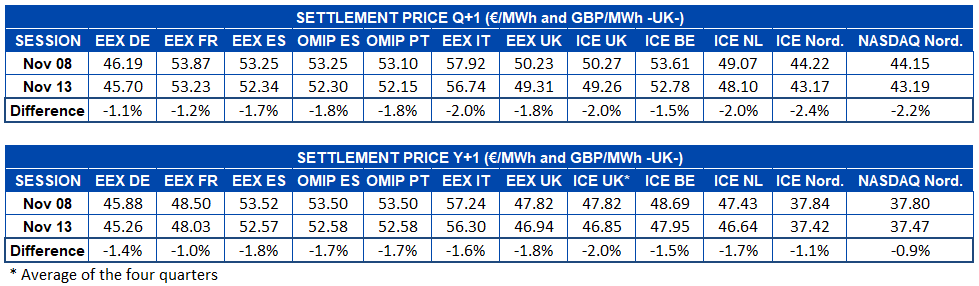
The electricity futures price for the first quarter of 2020 registered a generalised decline in all markets analysed by AleaSoft. With differences between ‑1.1% and ‑2.4%, all markets reduced their price for this product by approximately €1.0/MWh as a general average. The EEX market of Germany was the one with the least change, while the ICE market of the Nordic countries registered the largest decrease, in percentage terms.
In the case of the electricity futures for the next year a similar phenomenon occurred. The price of all markets was reduced. In this product the Nordic countries were those that least reduced their price. Specifically in the NASDAQ market, the lowest decrease was registered, of 0.9%. The largest price variation for the future of 2020 was in the ICE market of the Great Britain, with 2.0%.
Brent, fuels and CO2
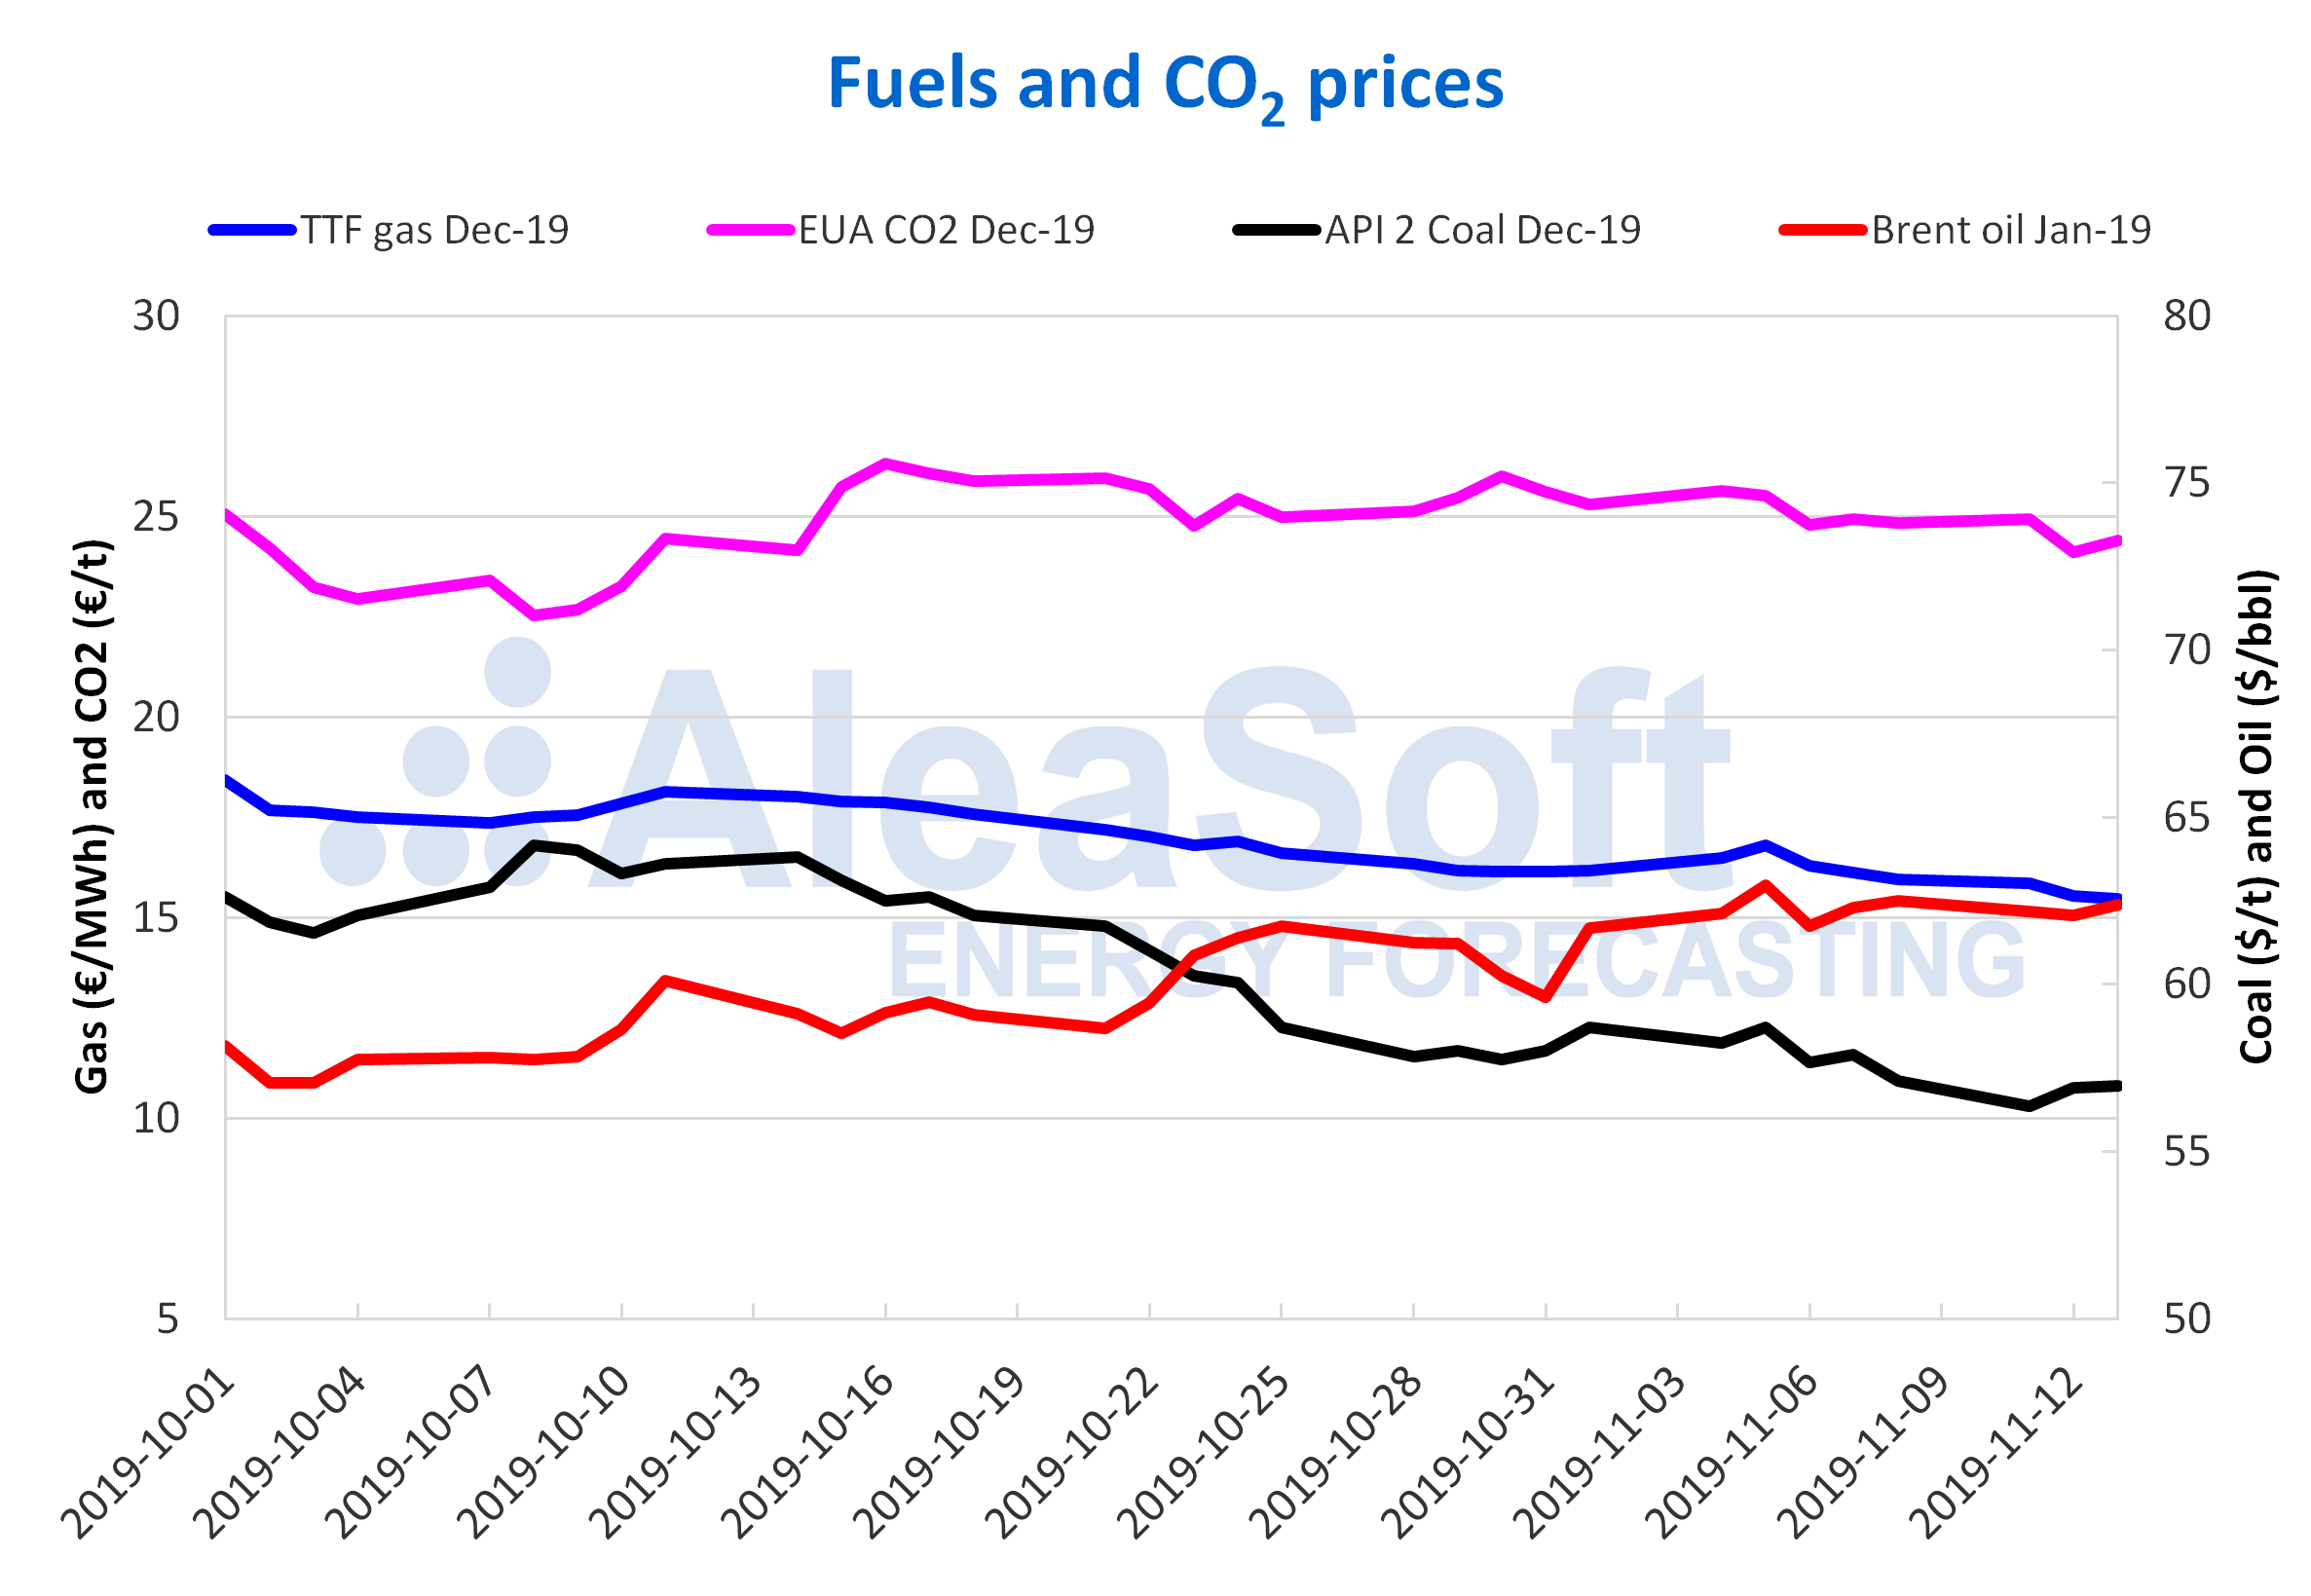
The Brent oil futures prices for the month of January 2020 in the ICE market, the first days of this week ranged between $62.06/bbl on Tuesday, November 12, and $62.37/bbl on Wednesday, November 13, with daily variations of 0.5% at most. The expectation on the development of the trade conflict between China and the United States and the results of the OPEC+ meeting, to be held in early December, is behind this relatively stable behaviour.
There is concern about whether China and the United States will reach an agreement before December 15, when new import tariffs imposed by the United States would take effect. On the other hand, the possibility of the US government setting new tariffs on imports from the European automobile sector is also worrying. The development of the United States tariff policy will exert its influence on the evolution of the prices in the coming weeks. However, a decrease in US crude oil reserves during the last week could cause a price increase in the next few days.
The TTF gas futures prices in the ICE market for the month of December the first days of this week continued with the downward trend that began on Wednesday of last week. As a consequence of this behaviour, yesterday, Wednesday, November 13, the settlement price was €15.45/MWh, 5.1% lower than that of Wednesday, November 6.
The API 2 coal futures in the ICE market for the month of December began this week with a price of $56.35/t on Monday, November 11, a value $0.75/t lower than that reached on Friday, November 8. But on Tuesday, November 12, the prices began to recover increasing by 1.0% compared to the previous day, reaching $56.90/t. Yesterday, Wednesday, November 13, the increase was lower, of 0.1%, and the settlement price was $56.95/t. The threats of strike in the coal mines of South Africa influenced this price evolution. The development of the conflict is expected to condition the coal prices in the coming days.
The CO2 emission rights futures prices in the EEX market for the reference contract of December 2019, after the stability shown since the middle of last week, on Tuesday, November 12, fell by 3.3% compared to the previous day, reaching a value of €24.11/t, the lowest so far this month. On the other hand, yesterday, Wednesday, November 13, the settlement price rose again to €24.39/t. Tuesday’s decline came when the news of the German government’s plans on the closure of coal‑fired power plants became known.
Source: Prepared by AleaSoft using data from ICE and EEX.
Source: AleaSoft Energy Forecasting.