AleaSoft, November 4, 2019. The month of October closed with a very positive data for the solar energy production in Spain, which increased 29% year‑on‑year. In Italy the solar energy production grew too. These data and the increases in the wind energy production in some countries favoured the fall in the prices of the electricity markets. Although, according to the analysis carried out by AleaSoft, the year‑on‑year declines in the prices of gas and coal are the main cause of the fall in the prices of the electricity markets.
Photovoltaic and solar thermal energy production, wind energy production and electricity demand
In October of this year, the solar energy production in Spain, which includes photovoltaic and solar thermal energy, increased 29% year‑on‑year. Another month, the monthly energy production of 2019 in Spain remained above that of the same months of 2018, except in the month of July. Italy and Germany had variations in opposite directions: in the first one it rose 12% while in the second it decreased 12% in year‑on‑year terms.
In the first 10 months of this year, the solar energy production in Spain was also higher than in 2018, 8.4%. In the case of Germany, the production of this period fell 2.3%, and in Italy a little less than 80 GWh, which represents 0.4%.
At AleaSoft it is expected that during this week the solar energy production in the European countries analysed will recover from the falls occurred last week.
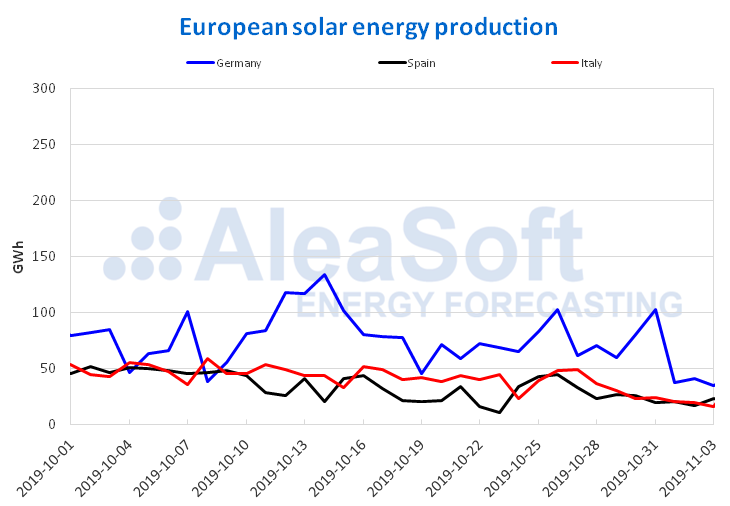
Source: Prepared by AleaSoft using data from ENTSO-E, REE and TERNA.
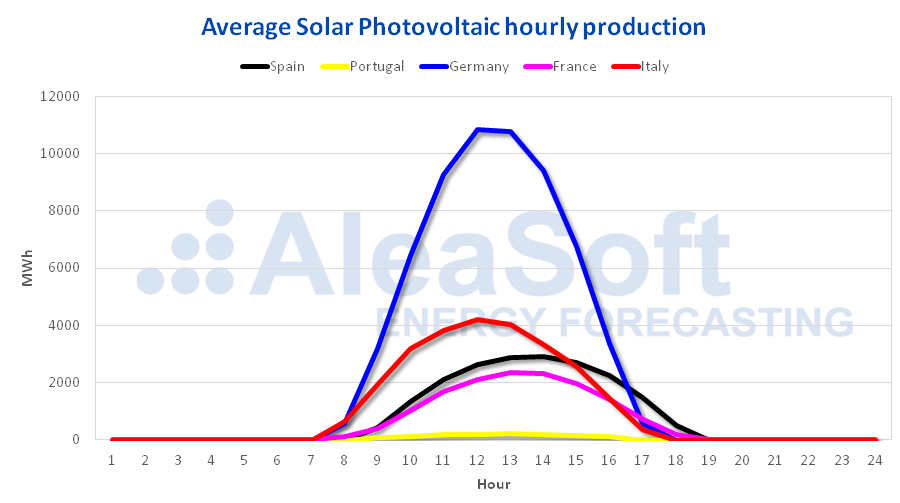
Source: Prepared by AleaSoft using data from ENTSO-E, REE and TERNA.
On the other hand, the wind energy production in October in France increased by 36% compared to the same month last year. Since March 2019, the monthly wind energy production in France was higher compared to the same months of 2018, registering the largest increase last September. In Spain, Portugal and Italy there were decreases between 14% and 17% in year‑on‑year terms.
In the past months of this year, Germany, Italy and France had a total year‑on‑year increase in production above 13%, while in the rest of the countries there were reductions between 0.15% and 0.18%.
The wind energy production increased last week in most of the European countries analysed compared to the previous week. For this week, this growing trend is expected to continue in much of the countries studied.
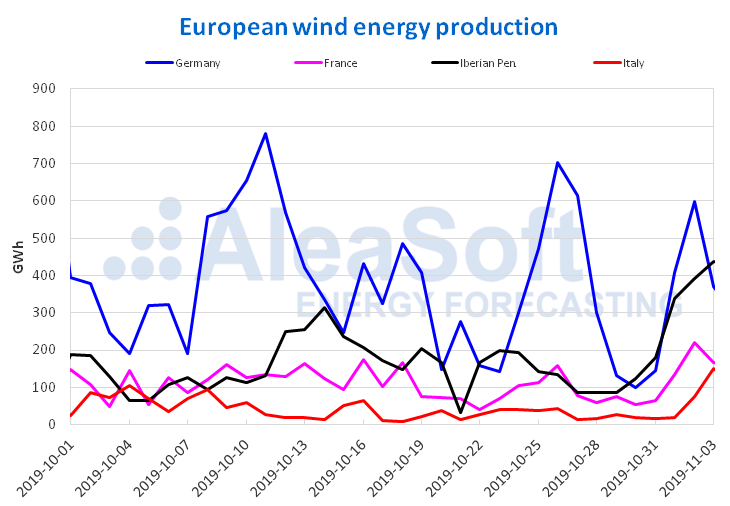
Source: Prepared by AleaSoft using data from ENTSO-E, RTE, REN, REE and TERNA.
The electricity demand in the month just concluded fell 6.2% in Germany. In Portugal, it increased 0.9%, and 0.8% in the United Kingdom. In general, in most of the territories of the European continent analysed, the monthly electricity demand of 2019 was below the levels of last year in the same period.

Source: Prepared by AleaSoft using data from ENTSO-E, RTE, REN, REE, TERNA, National Grid and ELIA.
European electricity markets
In October, all the European electricity markets analysed presented average prices lower than those of October 2018. The greatest drop was that of the EPEX SPOT Belgium market, of 51%. While the market that experienced a smaller decline was the Nord Pool market of the Nordic countries, of 13%. The increase in the renewable energy production in some countries favoured this decline but the fundamental cause was the fall in fuel prices. The average price of TTF gas in the spot market fell by 60% compared to the prices of October last year and those of API 2 coal by 40%.
As for last week, the prices of most European electricity markets rose compared to the previous week, except in the MIBEL markets of Spain and Portugal and the IPEX market of Italy, which experienced decreases of 14% in the case of the two markets of MIBEL and of 4.5% in the Italian market. In the rest of the markets, the increases were between 0.6% of the EPEX SPOT market of Belgium and 7.2% of the EPEX SPOT market of Germany.

In the group of markets with lower prices, last week the one that presented the minimum price was the EPEX SPOT market of Germany, with a price of €38.24/MWh. The next market with the lowest prices was the EPEX SPOT of Belgium, with a price of €38.47/MWh.
The market with the lowest average price during the month of October was also the EPEX SPOT market of Germany, with a value of €36.96/MWh.
Regarding the group of markets with the highest prices, last week the IPEX market of Italy was the market with the highest average price in Europe, with a value of €43.95/MWh, followed by the N2EX market of Great Britain, with a price of €43.68/MWh.
During the month of October the market with the highest average price was, as in September, the IPEX market of Italy, with a value of €52.84/MWh.
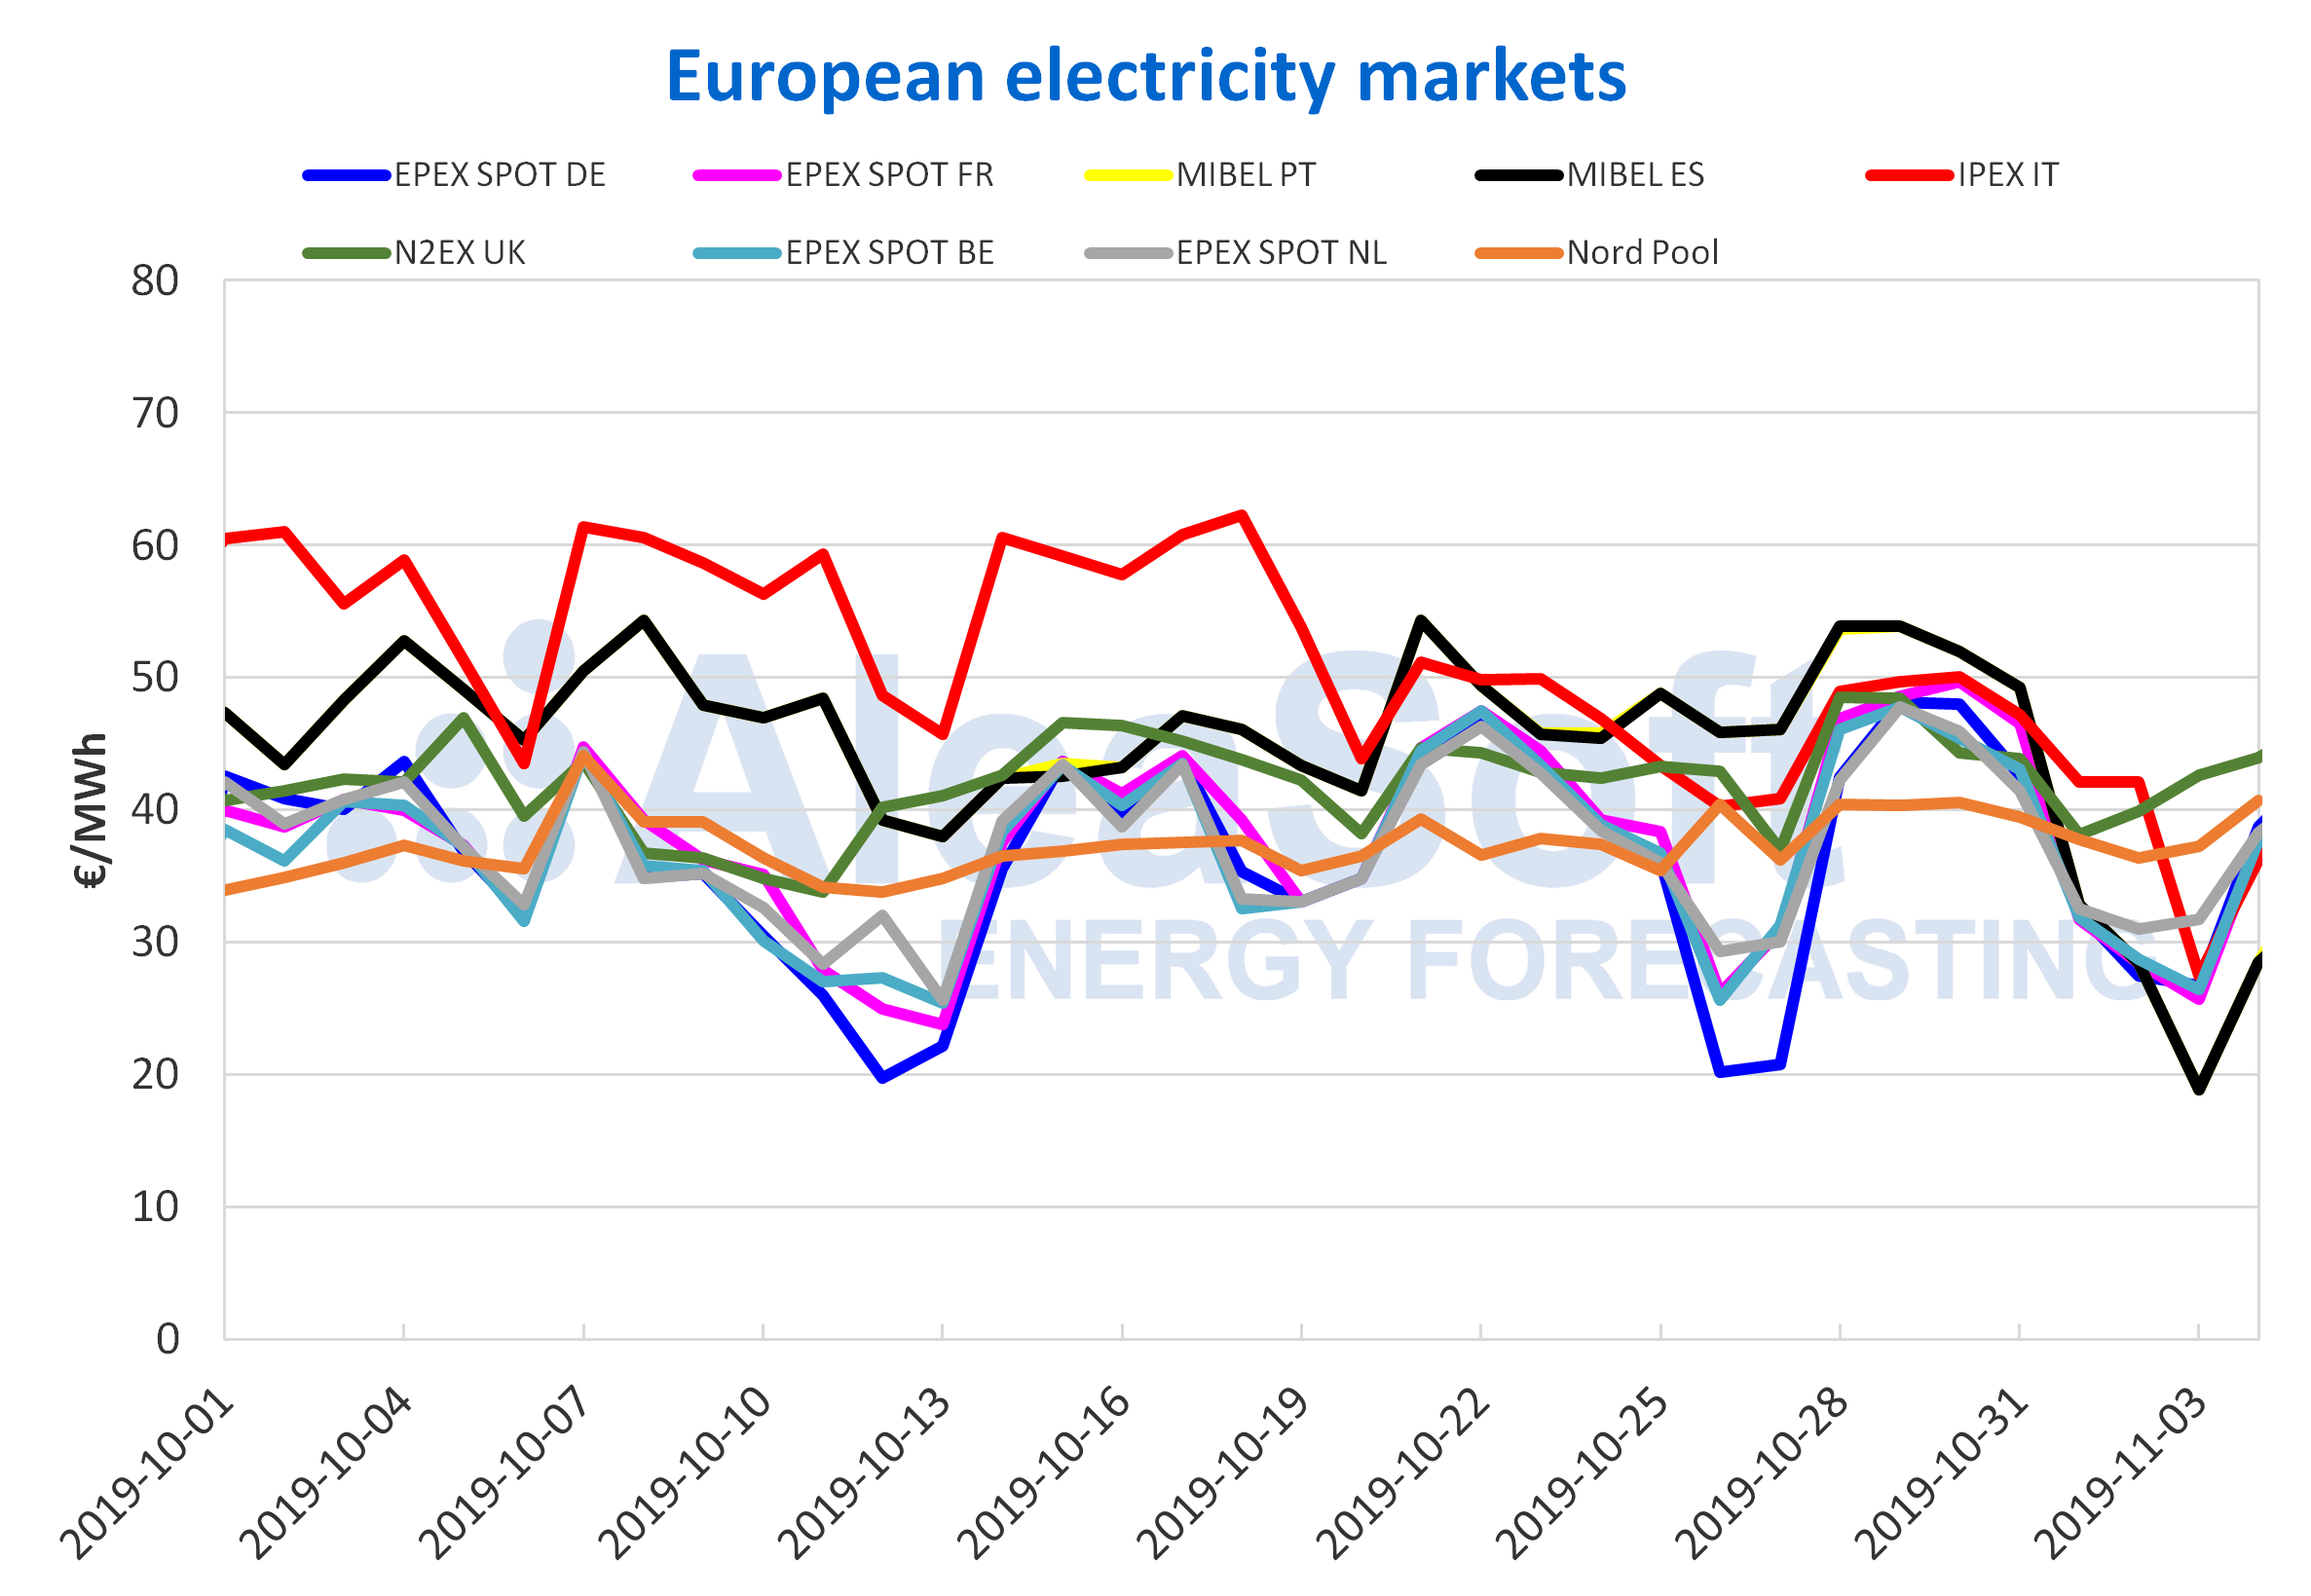
Source: Prepared by AleaSoft using data from OMIE, , N2EX, IPEX and Nord Pool.
Captured price by the solar and wind energy
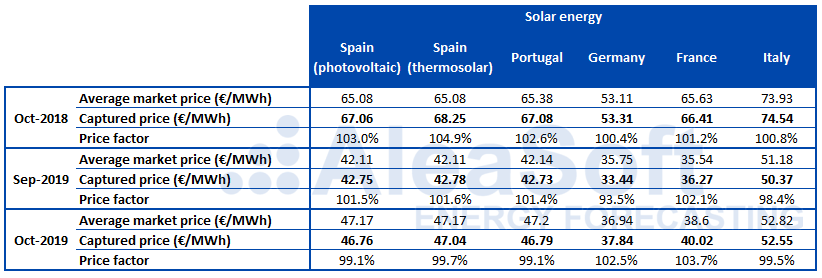
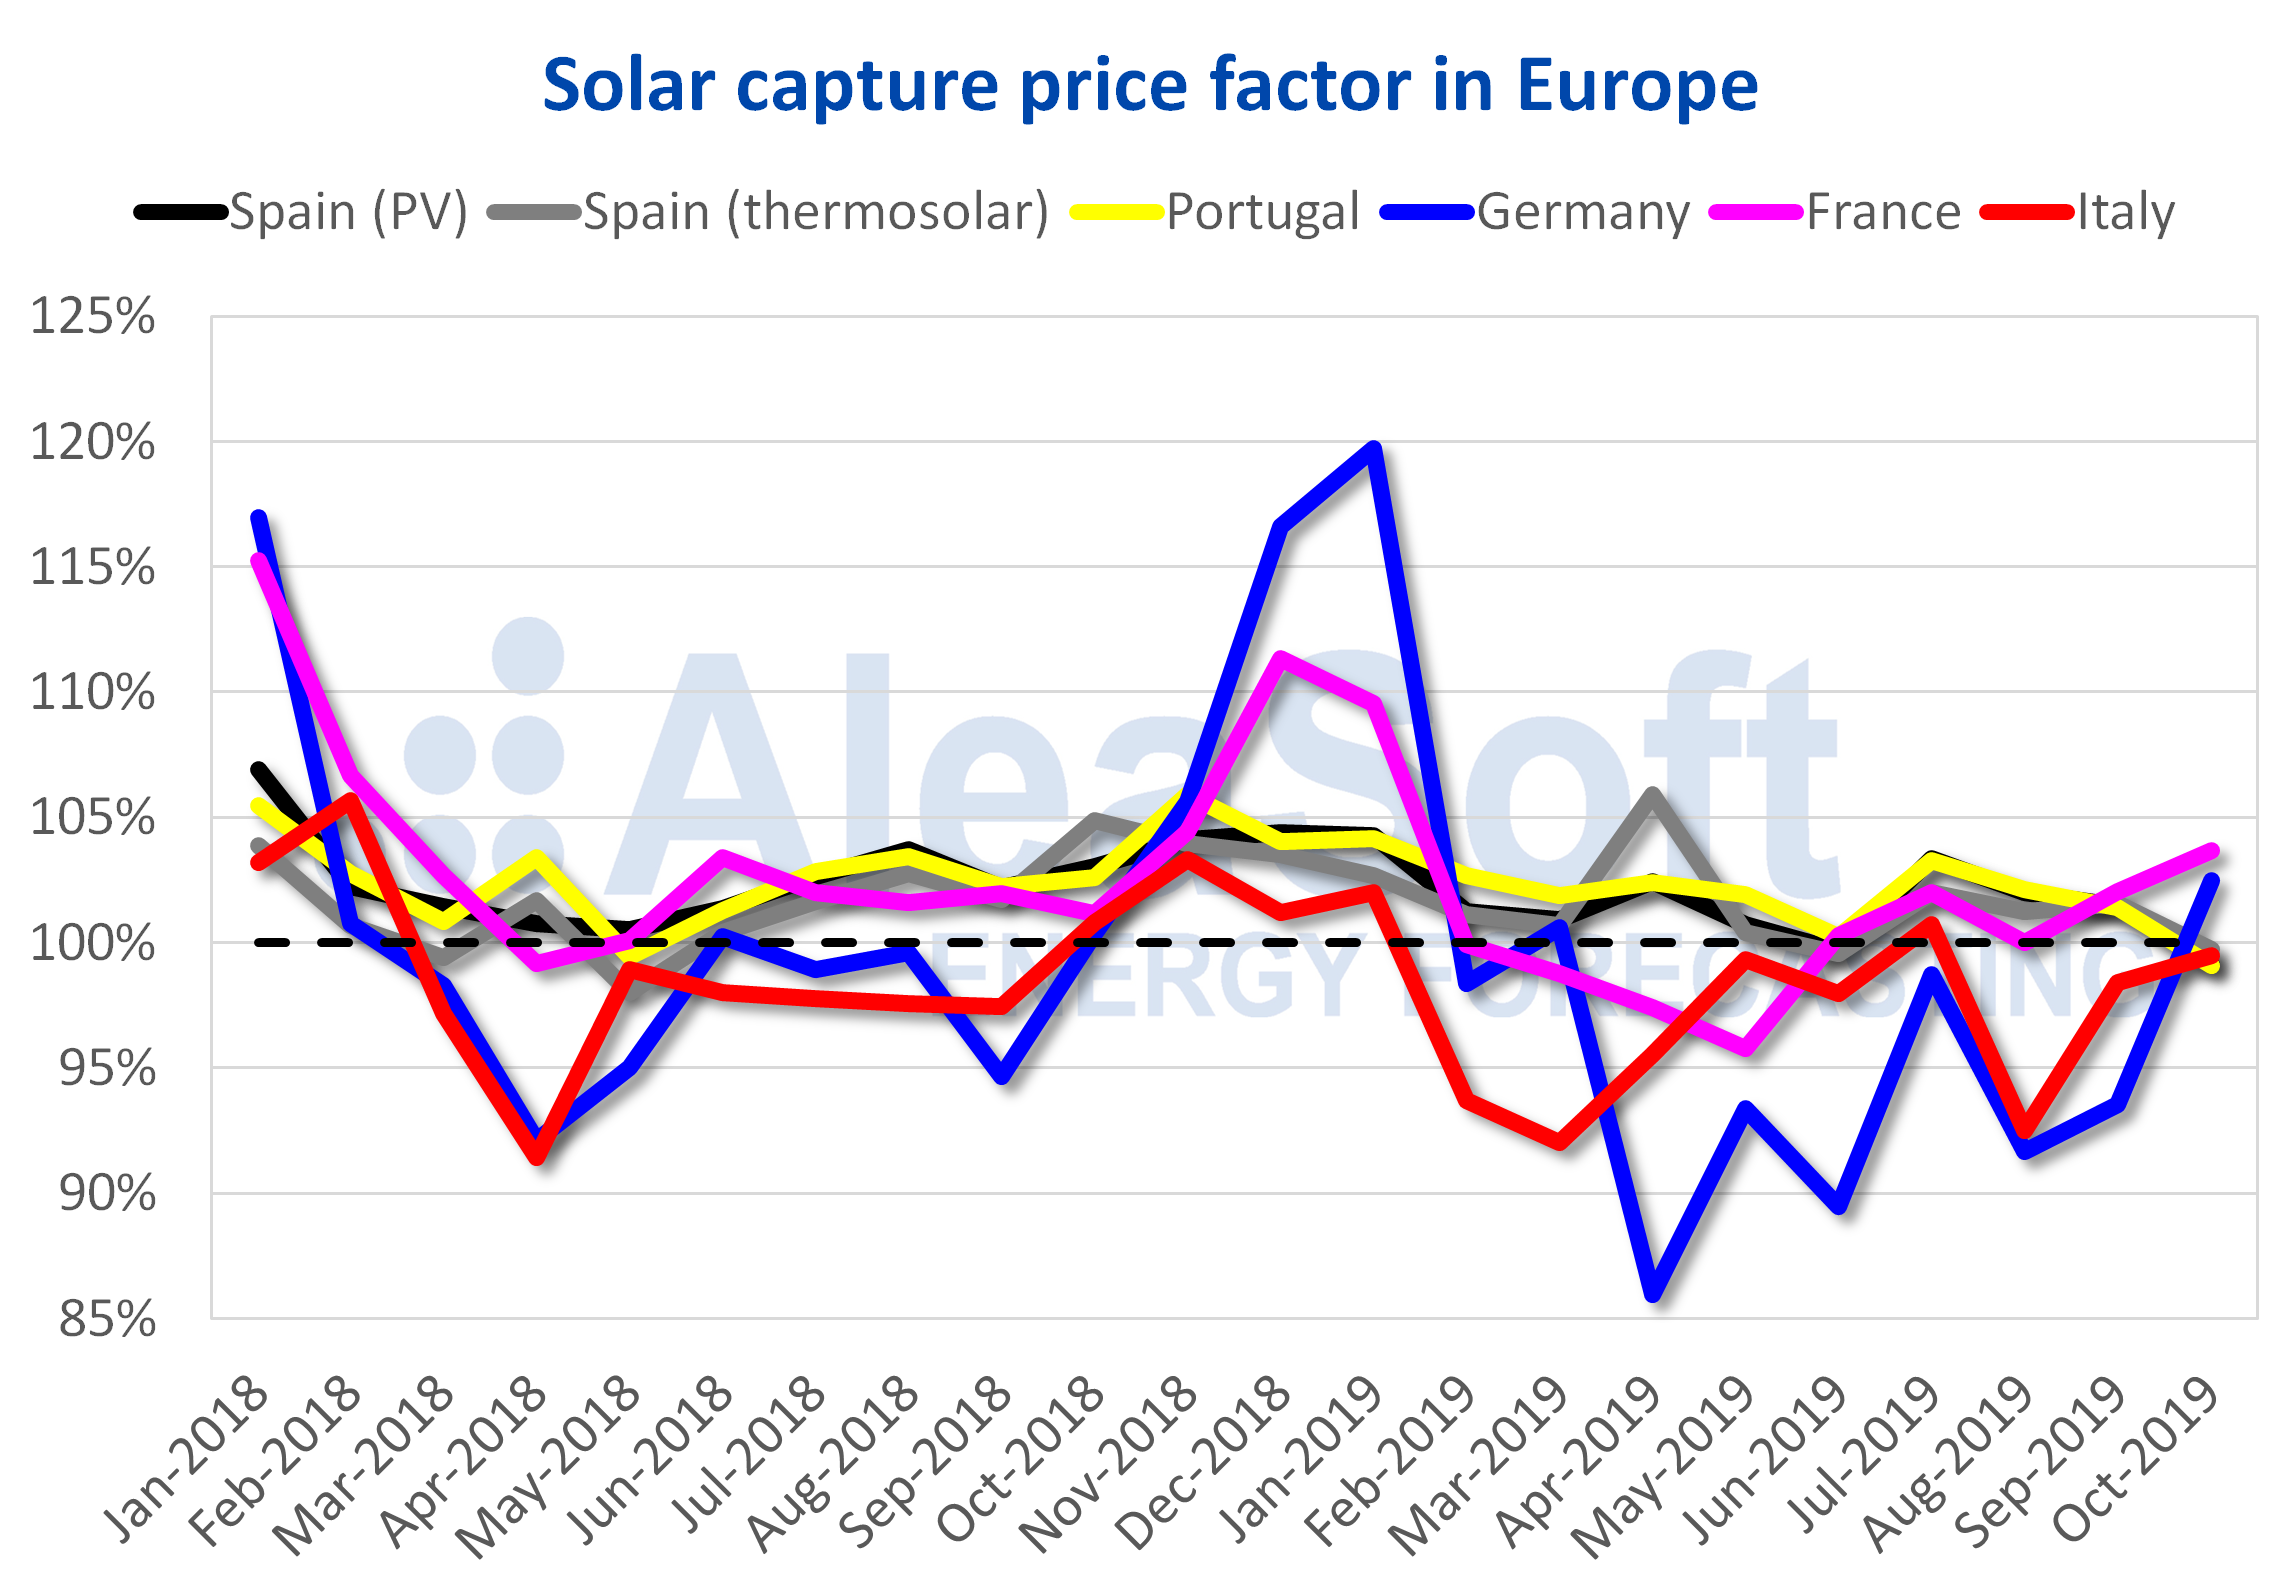
In the month of October just finished, the captured price by the solar technology rose in all European markets analysed compared to September of this year, but fell compared to October of last year. In the case of the Iberian Peninsula, the price factor dropped, reaching values below 100% for the first time since June of this year in the case of Spain, and since May 2018 in the case of Portugal. In Italy the price factor was also less than 100% but it was higher than that of the last September. In Germany and France the price factor was 102% and 104% respectively, higher than those of the month of September of this year and the month of October of last year.
Source: AleaSoft calculations using data from OMIE, , IPEX, REE, REN, ENTSO-E, RTE and TERNA.
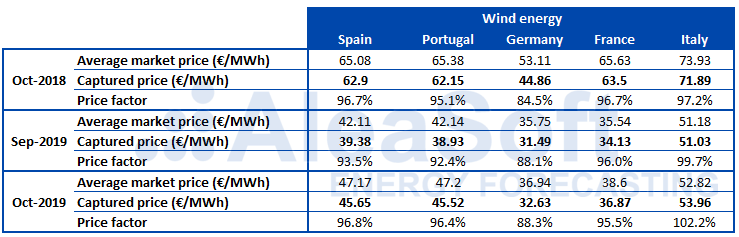
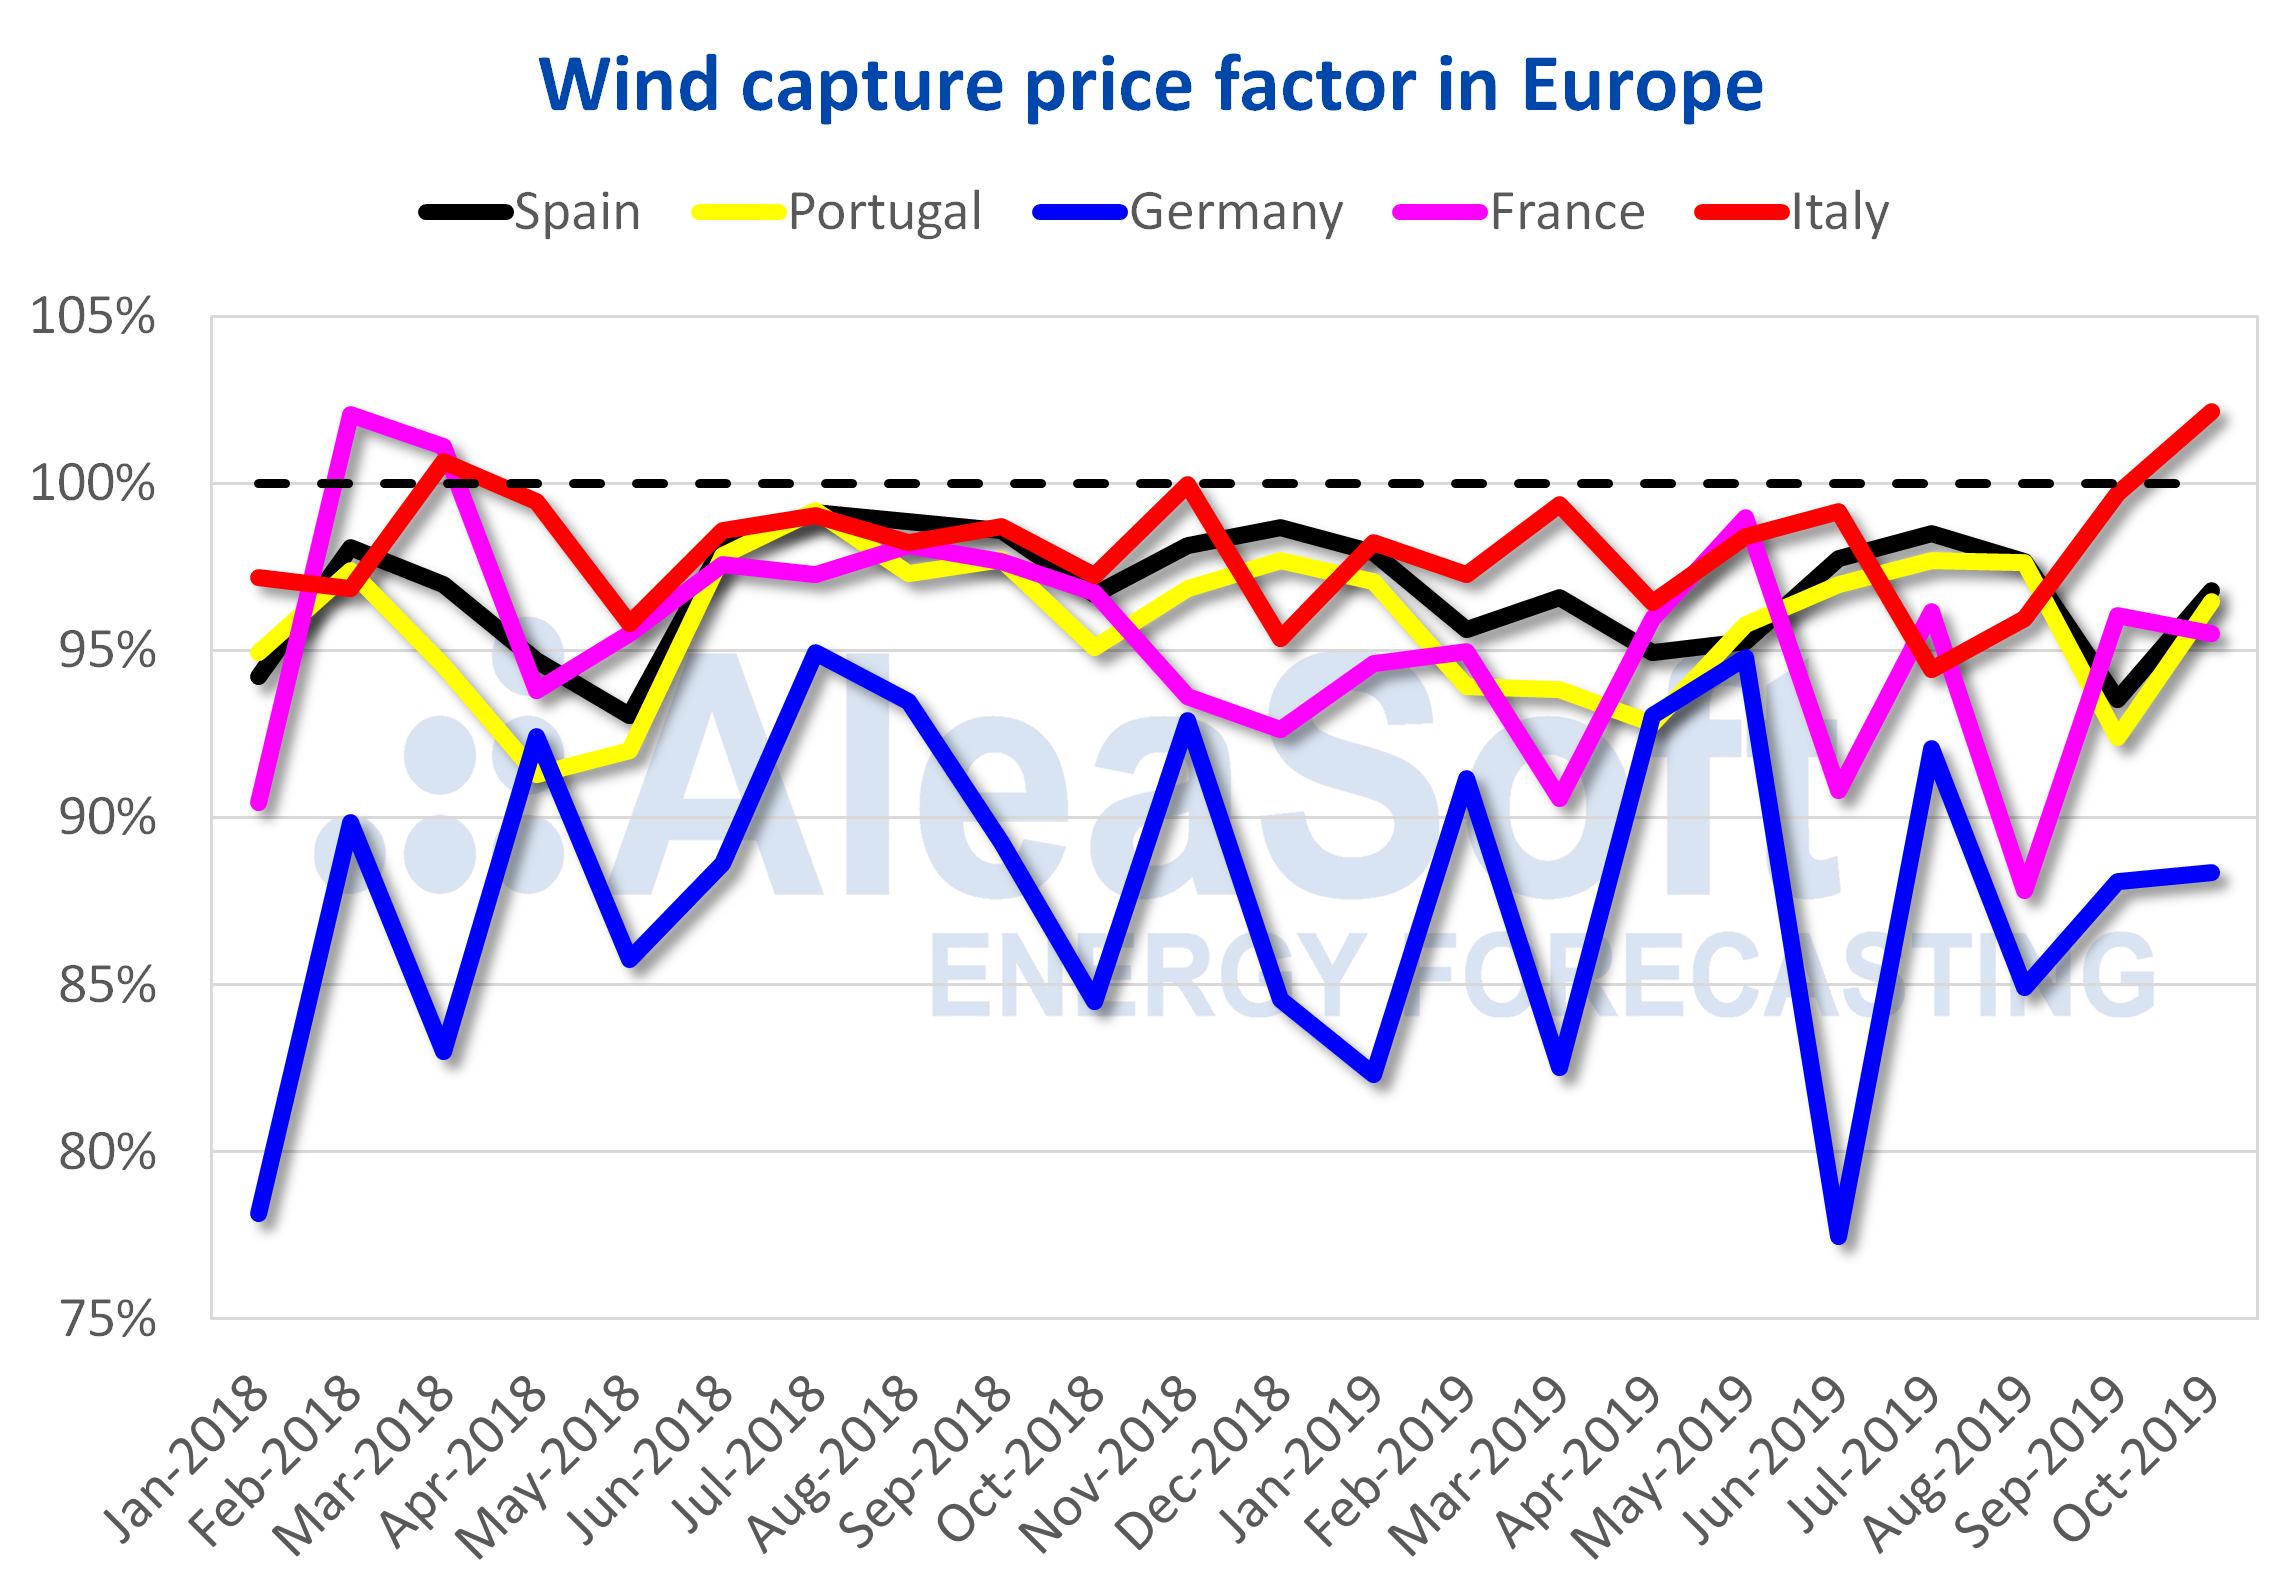
The captured price by the wind technology, like that of the solar technology, increases compared to September but decreases compared to October last year. The price factor increases in most of the markets analysed both with respect to September 2019 and with respect to October 2018, except in France. The price factor remains below 100% in most of the markets analysed except in the Italian where it was 102%.
Source: AleaSoft calculations using data from OMIE, , IPEX, REE, REN, ENTSO-E, RTE and TERNA.
Electricity futures
The prices of the electricity futures markets during the last month presented a general decrease for the product of the first quarter of 2020. The ICE market of Great Britain was the one with the largest decrease in percentage terms, with 9.3%, between the first and the last session of the month. The second place is also occupied by Great Britain, but in the EEX market, with a drop of 9.0%. The Nordic countries experienced the lowest decrease, accounting for 0.5% in the NASDAQ market and 0.4% in the ICE market, the latter being the market with the lowest price drop during the month. This market settled last Friday, November 1, at €42.85/MWh, being also the one with the least change compared to the previous week, but this time with a 0.2% rise.
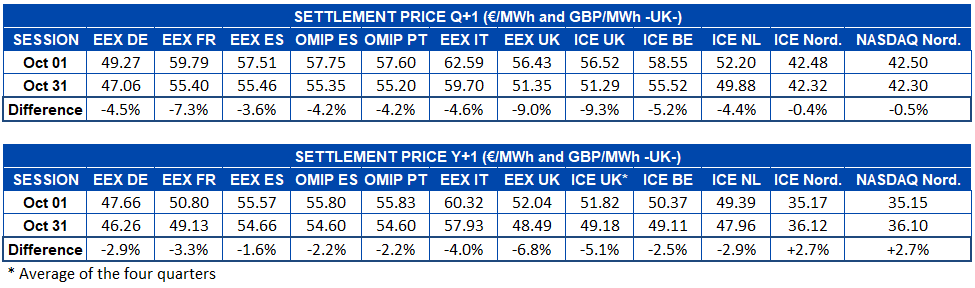
On the other hand, analysing the product of the 2020 calendar year, although most markets experienced declines, the futures of the Nordic countries, both in the ICE market and in NASDAQ, presented increases. In both cases the price in the last session of the month was 2.7% higher than the price of the first session of the month. Meanwhile, the rest of the markets registered declines for this product of between 1.6% and 6.8%. The latter is the case of the EEX market of Great Britain, which was also the one with greatest decline in the futures for the following year. On the other hand, the ICE market, also of Great Britain, experienced the greatest decrease compared to the previous week. The decrease was 6.0% when settling last Friday, November 1, at £48.63/MWh.
Brent, fuels and CO2
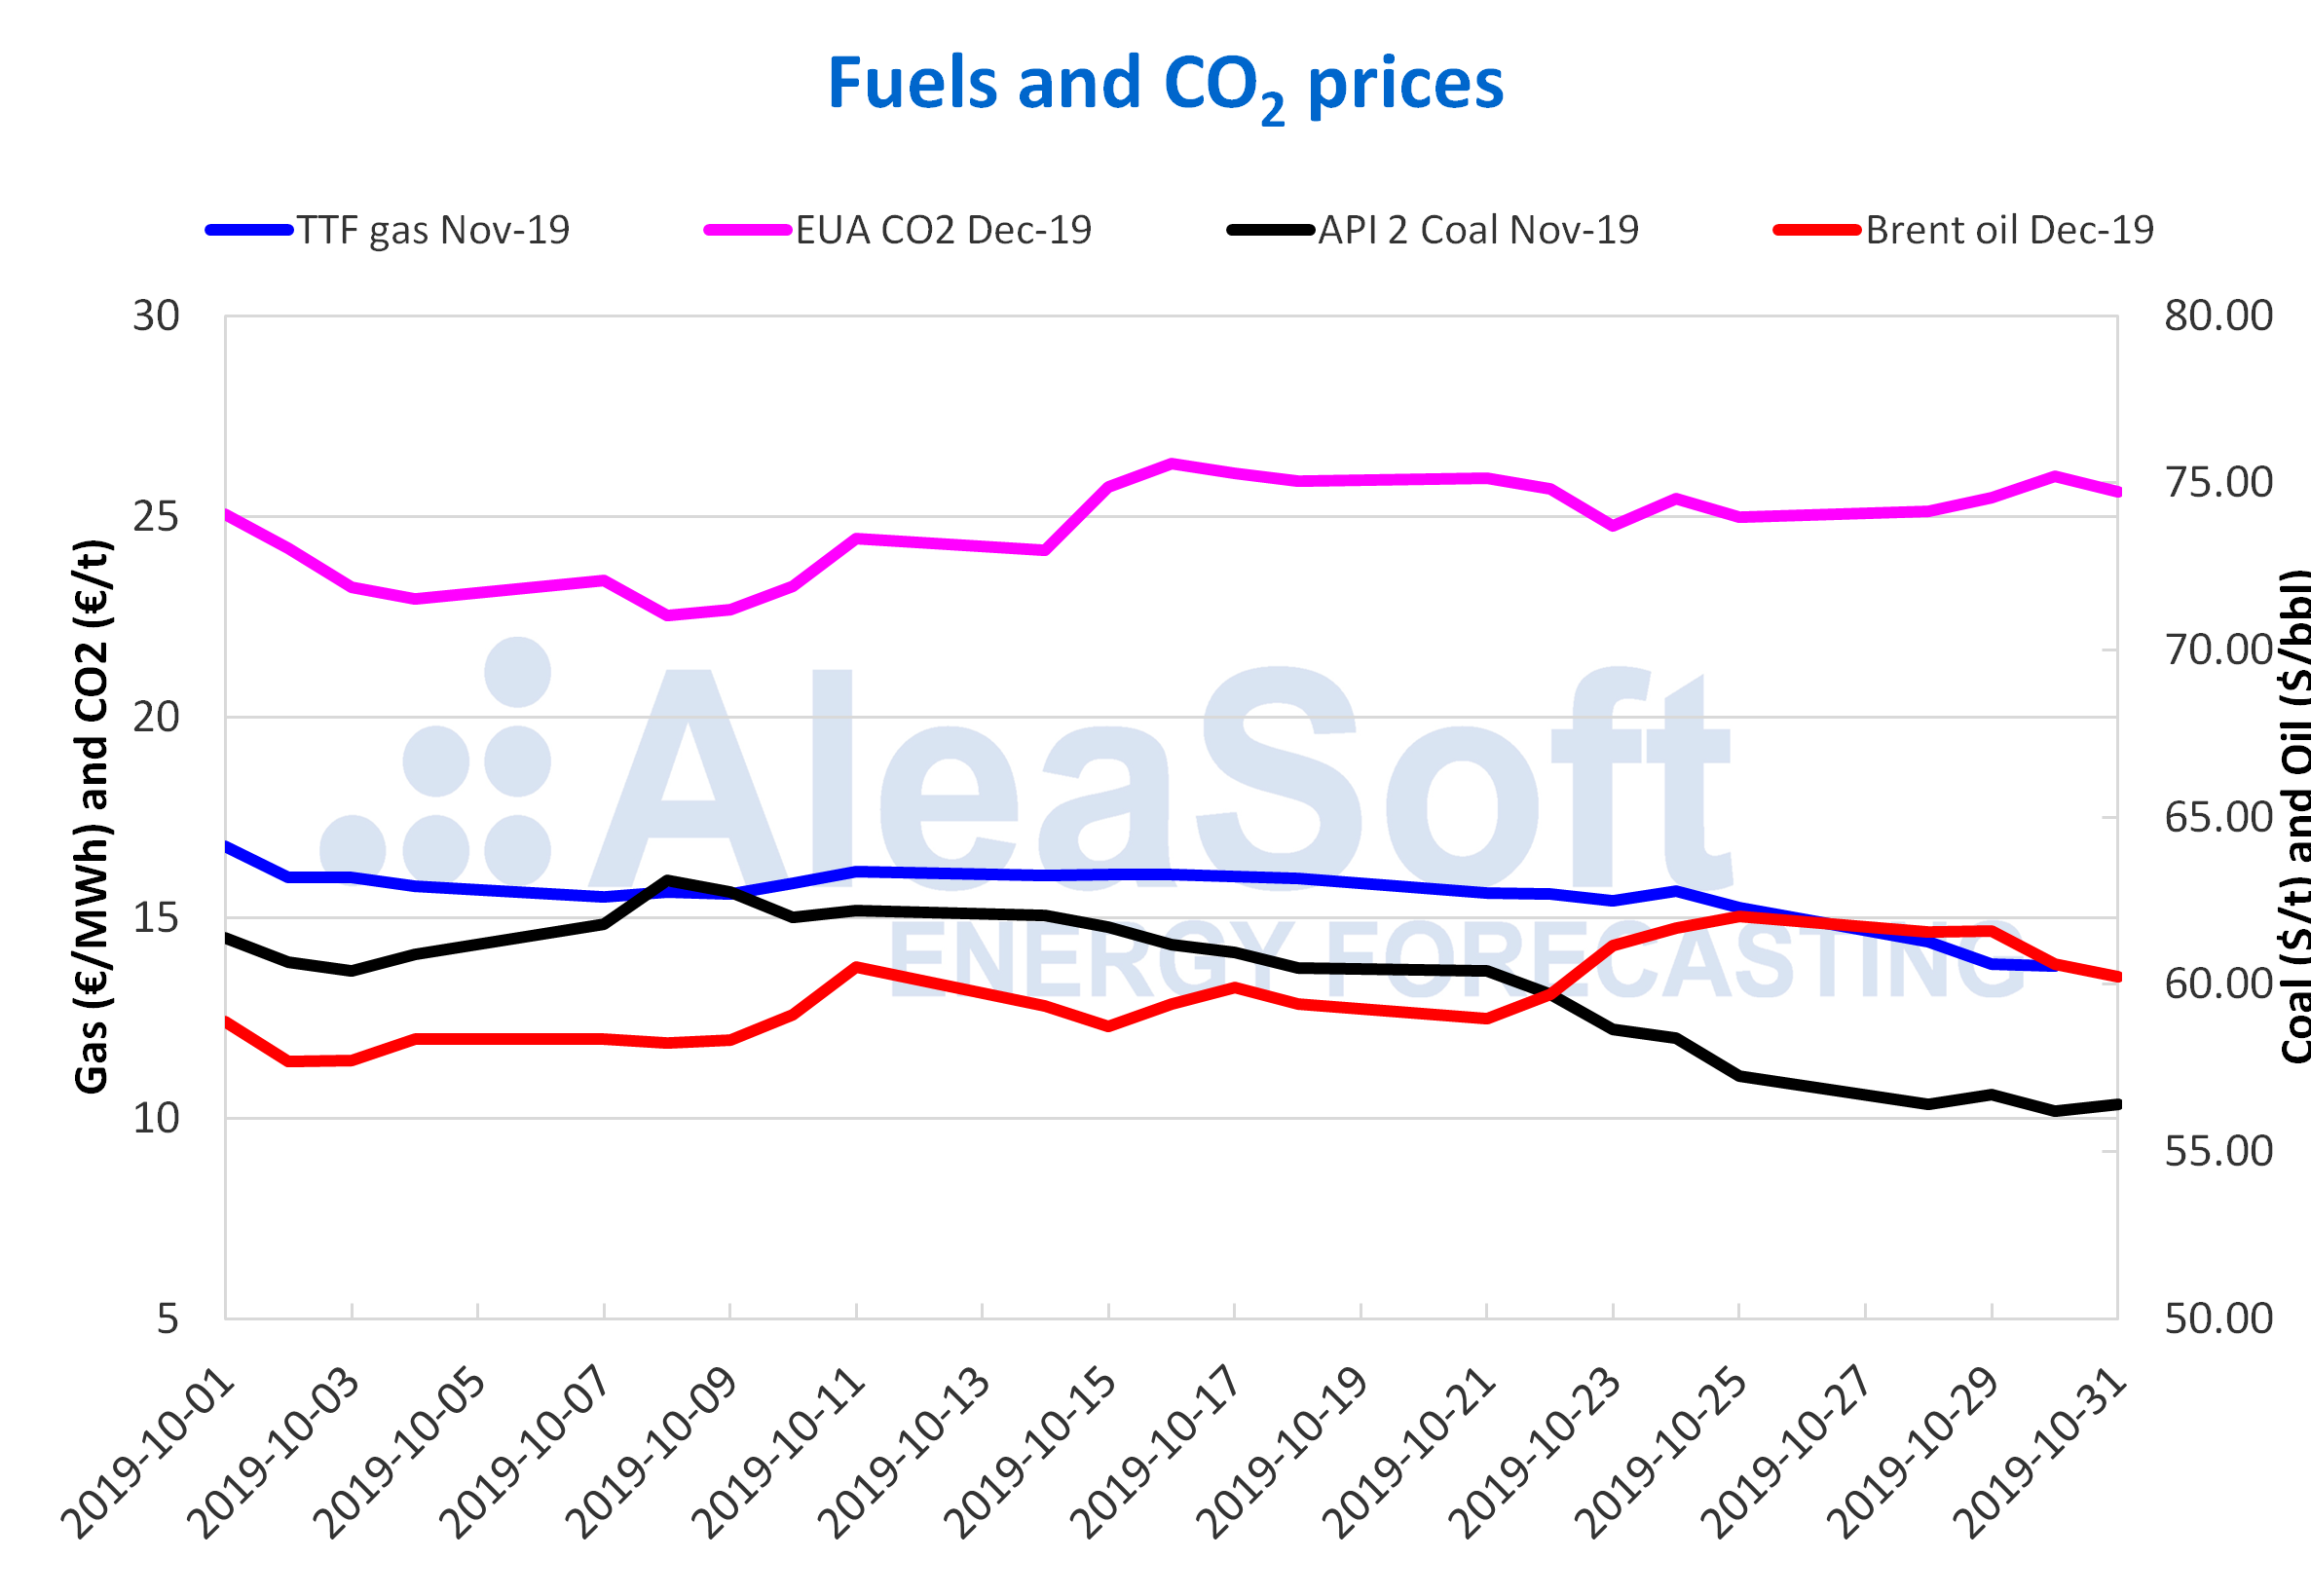
The Brent oil futures prices for the month of December in the ICE market, after the increases experienced in the penultimate week of October, decreased the last days of the month. On Wednesday, October 30, the price fell 1.6% compared to Tuesday. While on Thursday, October 31, the decrease compared to the previous day was 0.6% and the settlement price of the last day of the month was $60.23/bbl.
During the month of October, the Brent oil futures prices for the month of December in the ICE market reached a maximum value of $62.02/bbl on October 25 and a minimum value of $57.69/bbl on October 2. The average value of the Brent oil futures prices for the month of December in the month of October was $59.63/bbl.
Throughout the month of October, the price behaviour was affected by the fears of the slowdown in the world economy and the trade conflict between China and the United States. The month of October began with a downward trend influenced by the recovery of the production levels in Saudi Arabia. Although the intensification of tensions in the Middle East and the intentions of OPEC+ to agree in December to maintain production cuts contributed to a change in the price trend. The levels of the oil reserves in the United States also had an influence on the evolution of the prices.
The TTF gas futures prices in the ICE market for the month of November, the last days of October experienced a downward trend. On October 30, a settlement price of €13.78/MWh was reached, which is the minimum price for the month of October. This value is 12% below the monthly average value of €15.59/MWh. Regarding the maximum value of this month, it was €16.76/MWh and was registered on October 1.
The gas futures prices during the month of October were conditioned by the high levels of the gas reserves and the excess of supply. The evolution of the temperatures and the wind energy production also exerted their influence on prices.
The API 2 coal futures prices in the ICE market for the month of November ended the month of October with a value of $56.40/t, equal to that of the first day of last week. Last week it showed great stability and the minimum value recorded, of $56.20/t, corresponding to October 30, was also the monthly minimum value. These values for the last days of October were reached after the prices fell during most of the month. Although at the beginning of the month there were increases that allowed reaching a monthly maximum value of $63.10/t on October 8. As a result of this behaviour, the average price for the month of October was $60.07/t.
The CO2 emission rights futures prices in the EEX market for the reference contract of December 2019, all last week reached values above €25.00/t. On Wednesday, October 30, the maximum value of last week was recorded, of €26.00/t. Although on Thursday and Friday there were declines compared to the previous day, of 1.5% and 1.2% respectively, so the settlement price of Friday, November 1, was €25.30/t. This price was 2.3% higher than the average for the month of October, of €24.73/t. In this month of October the maximum value recorded was €26.31/t, corresponding to October 16. While the minimum price for that month was €22.53/t, for October 8.
The evolution of the CO2 emission rights prices during the month of October was greatly influenced by the progress on the Brexit negotiations. The price increases experienced at the end of the month are related to the third extension for the Brexit announced by the European Union on Monday, October 28. This extension, together with the elections scheduled in the United Kingdom for December 12, dissipate, for the moment, the concerns about a Brexit without agreement, which could prevent, in the coming weeks, the prices from falling to values similar to those corresponding to the second week of October, when the monthly minimum value was recorded.
Source: Prepared by AleaSoft using data from ICE and EEX.
Source: AleaSoft Energy Forecasting.