AleaSoft, October 1, 2019. In AleaSoft, the analysis of the main European electricity markets in September and the third quarter of 2019 was carried out. In both periods, the prices fell year-on-year due to the increase in wind energy production in all the countries analysed and the decrease in the prices of the fuels used in electricity generation, mainly gas and coal. In Q3, the solar energy production, which includes photovoltaic and solar thermal, grew in the countries of southern Europe.
Brent, fuels and CO2
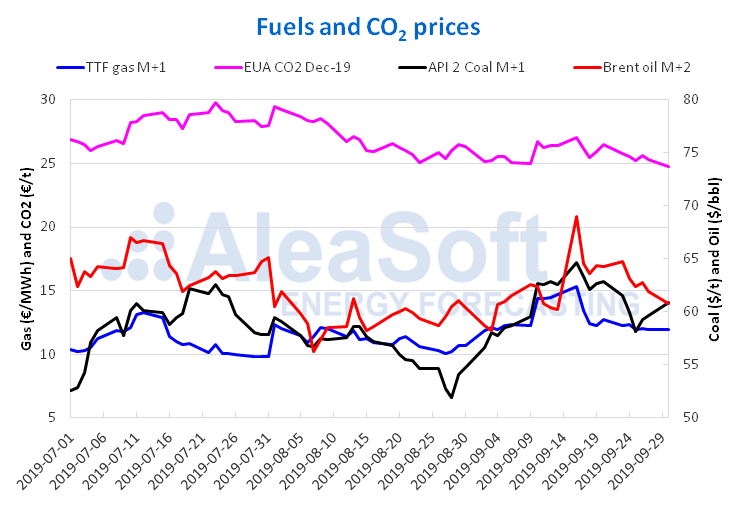
The Brent oil futures prices for the month M+2 in the ICE market during the third quarter of 2019 reached a maximum value of $69.02/bbl on Monday, September 16, and a minimum value of $56.23/bbl on Wednesday, August 7. The average value of Brent oil futures prices for the month M+2 in this quarter was $62.03/bbl. The concerns about reducing the pace of global economic growth and the trade dispute between China and the United States marked the price behaviour throughout the quarter. The reduction of US crude oil inventories and the production restrictions established by OPEC+ also influenced the evolution of rising prices in August and the first half of September.
In the particular case of September, the prices of Brent oil futures for the month M+2 in the ICE market began the month below $59.00/bbl. In particular, on Tuesday, September 3, the settling price was the minimum for this month, with a value of $58.26 bbl. The maximum price of this month, $69.02/bbl, which also coincides with the quarterly maximum, was reached on Monday, September 16, after the attacks carried out in oil facilities in Saudi Arabia on September 14. However, this price fell in the following days due to the increase in US production and the statements of the Saudi Arabian energy minister, ensuring that by the end of the month the production levels in this country would have been restored. The price continued to decline progressively as the production levels in Saudi Arabia were restored. Even so, the month of September ended with a price of $60.78/bbl, $2.12/bbl above the price with which the month began.
The prices of TTF gas futures in the ICE market for the month M+1, presented an average value of €11.66/MWh during the third quarter of 2019. The minimum value of this quarter, €9.79/MWh, was reached on July 30 and the maximum value, of €15.33/MWh, on September 16. In general, the lowest prices were observed in July and at the end of August. While in September the highest prices were reached and the monthly average value was €12.87/MWh. In September, the prices started to increase from the minimum monthly value of €11.85/MWh, corresponding to Monday, September 2. Between September 10 and 17, the highest prices for this month were reached, with values above €13.00/MWh, being the monthly maximum the value corresponding to September 16, of €15.33/MWh. The rest of the month, the prices returned to values below €13.00/MWh. At the end of the month, the prices stabilized at values similar to those of the beginning of September. The price evolution was mainly influenced by news about problems in the French nuclear power plants that could force technical stops during the colder months, although it was finally announced that these stops would not be necessary. The planned reduction in gas production in the Netherlands from October 1, Germany’s intentions to reduce the entry of gas from Russia and a greater influx of gas from Norway to the rest of Europe also exerted its influence on the prices reached during the month of September.

Regarding the prices of API 2 coal futures in the ICE market for the month M+1, during the third quarter of 2019, values between $51.95/t, on August 28, and $64.70/t, corresponding to September 16 were obtained. The quarterly average price was $58.64/t. In September, after reaching the maximum quarterly value, a downward trend began that continued until Wednesday, September 25. Then, a price recovery began, closing on Monday, September 30, with a value of $60.90/t. This price is $8.95/t above the minimum quarterly value.
The prices of CO2 emission rights futures in the EEX market for the reference contract of December 2019 during the third quarter of 2019 had an average value of €26.93/t and, in general, took lower values during the second half of the quarter. The maximum price reached, of €29.80/t, corresponded to July 23. While the minimum value, of €24.73/t, corresponds to September 30. In the second half of September, the prices tended to decrease until reaching the minimum quarterly value on the last day of the month. This minimum price reached is €1.02/t below the monthly average value of September, of €25.75/t.
Sources: Prepared by AleaSoft using data from ICE and EEX.
European electricity markets
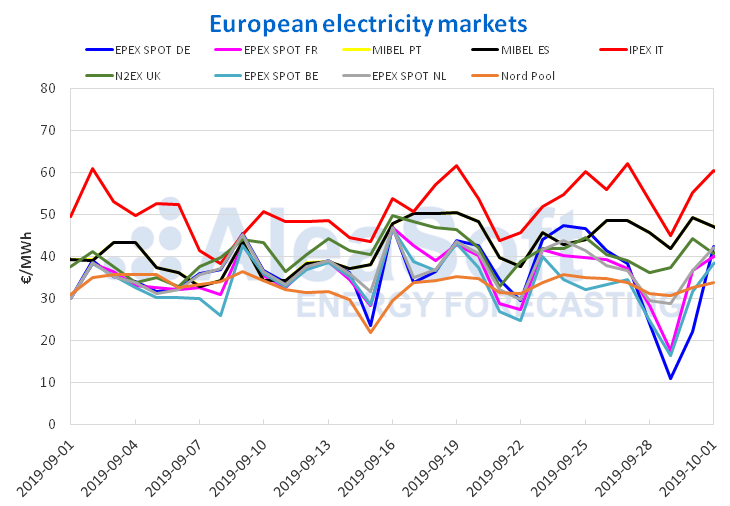
In the month of September recently ended, although the majority of markets presented slight decreases in their monthly average price compared to the previous month, the market in France and the IPEX market in Italy showed increases of 6.4% and 3.3%, respectively. It is this last market, the Italian, which was the one with the highest price during the month of September, with an average value of €51.18/MWh. On the other hand, the Nord Pool market, which presented the largest decline among the analysed markets, of 8.5%, once again positioned itself as the market with the lowest average price in Europe, which it did not achieve in the month of August.
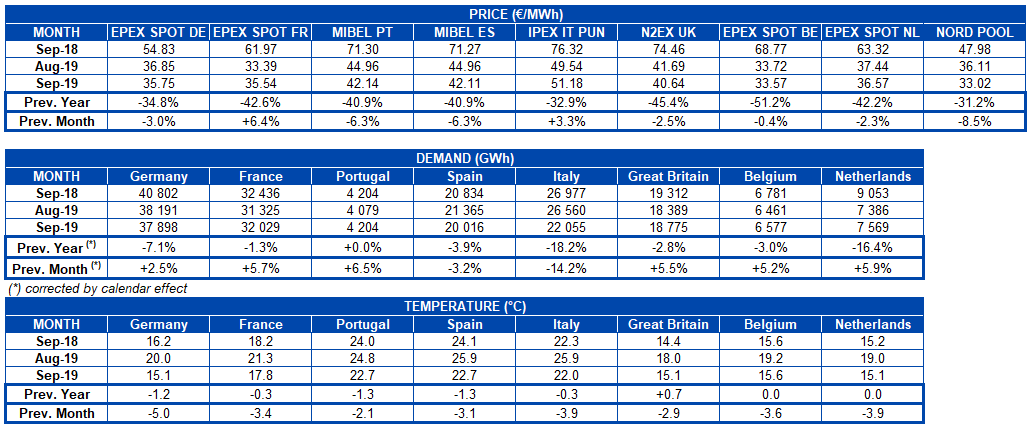
However, if a year-on-year analysis is performed, then the results are much more remarkable. With respect to September 2018, the prices of all the European electricity markets analysed dropped considerably. The biggest decline was experienced by the Belgian market, which ended the month of September 2019 with an average price that is less than half of the average price it had in the same month of 2018, presenting a 51% drop. The market that least decreased its price compared to the previous year was the Nord Pool, with a difference of ‑31.2%.
Sources: Prepared by AleaSoft using data from OMIE, , N2EX, IPEX and Nord Pool.
The same happens when the third quarter of 2019 is analysed with respect to its 2018 counterpart. The year-on-year differences show decreases in the average price between 25.9% and 42.3%. The market that presented the most change was the in Belgium, while the IPEX market in Italy was the one with the lowest year-on-year variation. It is precisely this Italian market that had the highest price during the penultimate quarter of the current year, with an average of €51.01/MWh.
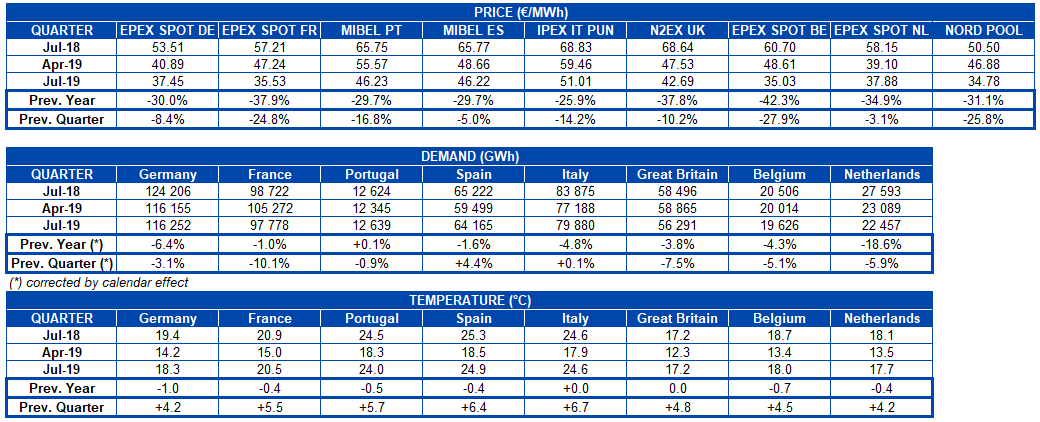
The main cause of these year-on-year drops is the year-on-year decrease in the price of fuels used for power generation. Just in the recently completed September it marks a year of the maximum price peak presented by natural gas and coal. The price drop that followed these highs was commented in AleaSoft‘s previous news. The API 2 coal and the TTF gas show year‑on‑year drops in the price of 40% and 65% respectively, which led to the prices in the electricity markets falling even though the prices of CO2 emission rights have an increase of 20% on a yearly basis. Already at the beginning of this year, in AleaSoft an analysis was made of how this drop in fuel prices influenced the price of the MIBEL market accompanied by political factors. In the month of September is where the year-on-year difference is most evident, since it is the month that corresponds to the maximum peak of that price escalation.
Electricity futures
The electricity futures for the year 2020 closed last Monday, September 30, with a generalized decline in all European markets compared to the start of the third quarter of this year. The largest declines were registered in the ICE markets in Belgium and the Netherlands with a variation of ‑3.6% and ‑3.4%, respectively. The smallest decreases occurred in the EEX and OMIP markets for Spain, which closed with a drop of less than 1.0%. The rest of the markets fell between 1.1% and 2.5%.
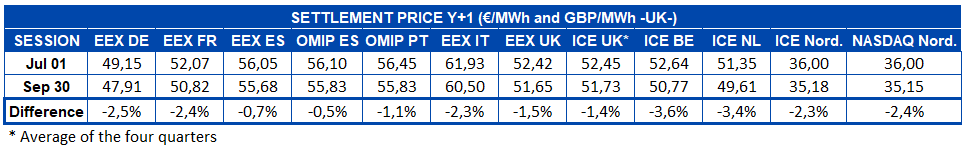
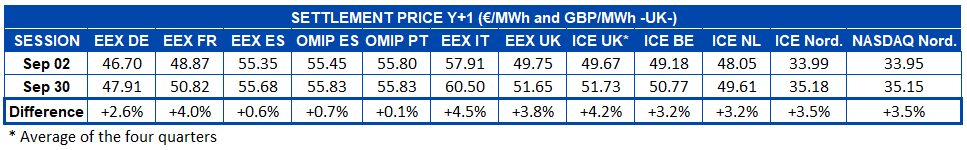
If the behaviour during the month of September is analysed, the electricity futures for the year 2020 recovered with a generalized increase compared to the first settling of this month, on September 2. It should be noted that during this period, these markets were affected by the uncertainty about supply after a deficiency in a French nuclear plant that caused a sharp rise in prices. As the widespread fear subsided, the prices resumed a downward trend, but yesterday, Monday, September 30, they continued above the values recorded in the first days of this month. Of all the markets, the least affected were EEX for Spain and OMIP for Spain and Portugal.
Wind and solar energy production
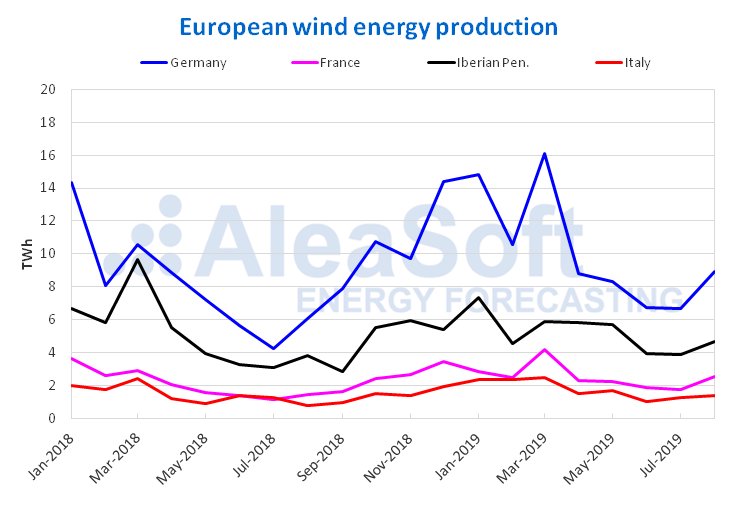
In September there was a general rise in wind energy production in much of the European continent, where several countries had increases of more than 40% in annual terms. These increases were led by Portugal, where the production doubled and marked an increase of 112%. This streak of increases that began in Portugal in April 2019, was maintained every month with a year-on-year monthly production higher than that of 2018. Another increase to highlight was that of France, of 60%, being the seventh consecutive month of this year with values above those of 2018, with increases higher than 37% in five of these months. The increase was 32% in the set of countries analysed. Similarly, the production increased last month compared to August 2019 in all countries analysed.
In the recently concluded quarter, there was also a uniform rise over the same period of 2018. As for the records of Germany, France and Italy, it is interesting to mention that they maintained levels higher than the values of the third quarter of 2018. In the case of Italy, the production remained higher than 16% in all quarters of 2019. The values corresponding to these increases were 18%, 43%, and 18%, respectively. For the group of European countries mentioned, the third quarter of 2019 had a year-on-year increase of 22%. However, compared to the second quarter of 2019, the wind energy production was lower in all the countries analysed.
Sources: Prepared by AleaSoft using data from ENTSOE, RTE, REN, REE and TERNA.
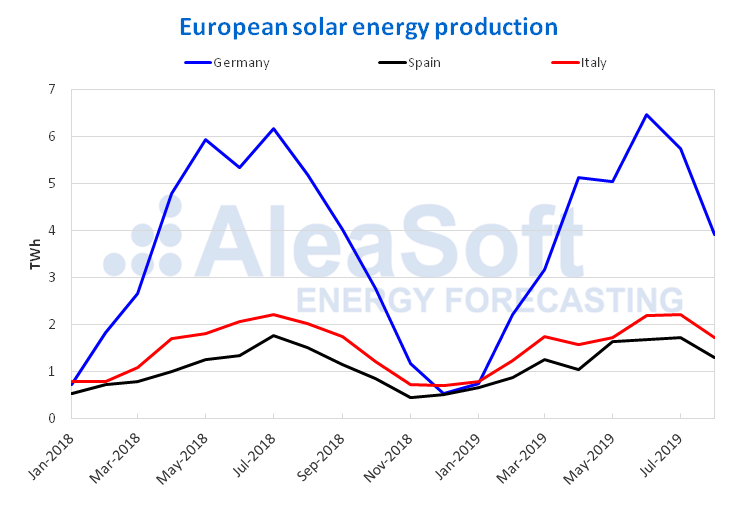
Regarding the solar energy production, which includes photovoltaic and solar thermal technologies, last month was similar to September 2018, in all the countries analysed. The solar generation of Spain was 11% higher in year-on-year terms, being the eighth month of 2019 with levels above those of the same period of 2018. In Italy and Germany, the production from this renewable source decreased slightly by 1.0% and 2.8%, respectively. On the other hand, there were decreases compared to August 2019 in the three countries mentioned.
Similarly, the three quarters of 2019 had greater solar energy production than those corresponding to 2018 in Spain. For the quarter that began in July 2019, the increase was 6.6%. It also rose 2.2% in Italy in the third quarter of this year, while in Germany it fell 2.9%.
Sources: Prepared by AleaSoft using data from ENTSOE, REE and TERNA.
Source: AleaSoft Energy Forecasting.