AleaSoft, August 13, 2020. The heat wave is keeping electricity demand high even in a holidays season like August. Some countries like the UK are breaking records for sustained temperatures, and several countries have seen demand increases over 10%. For its part, renewable energies did not have a uniform behaviour in all countries and both wind and photovoltaic energy registered increases or decreases depending on the country, so they have not managed to contain the high prices.
Solar photovoltaic and solar thermal energy production and wind energy production
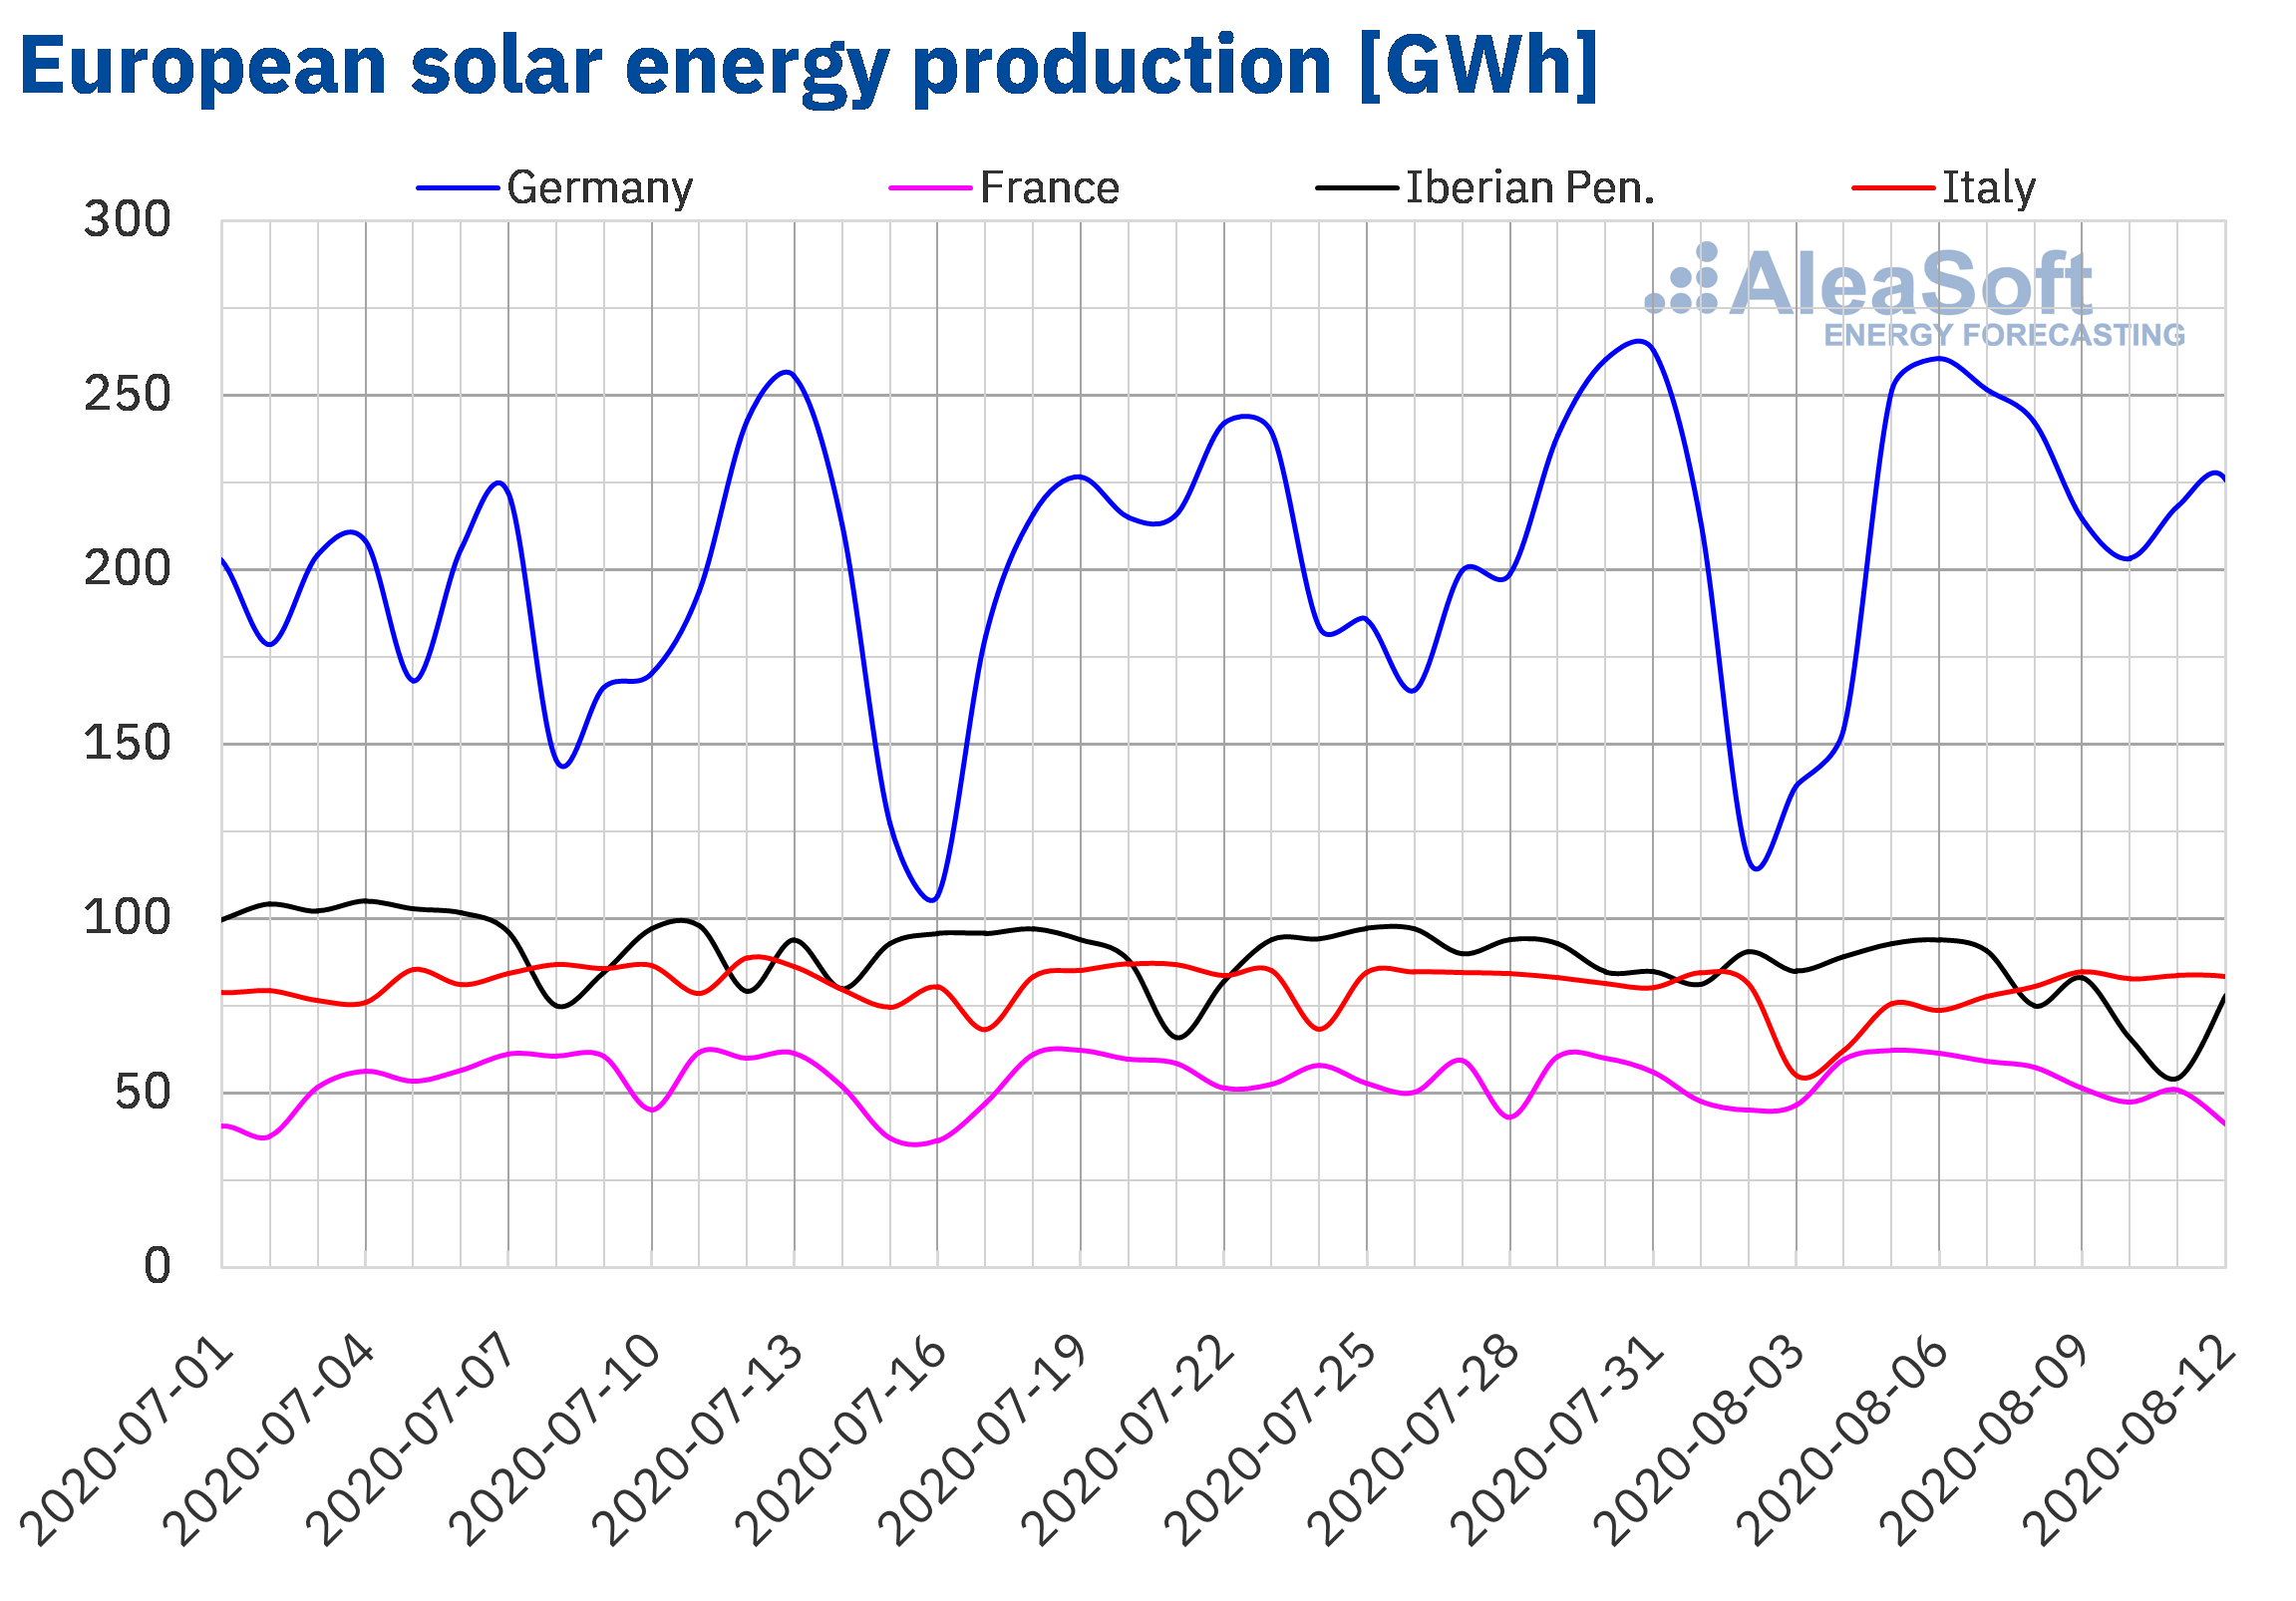
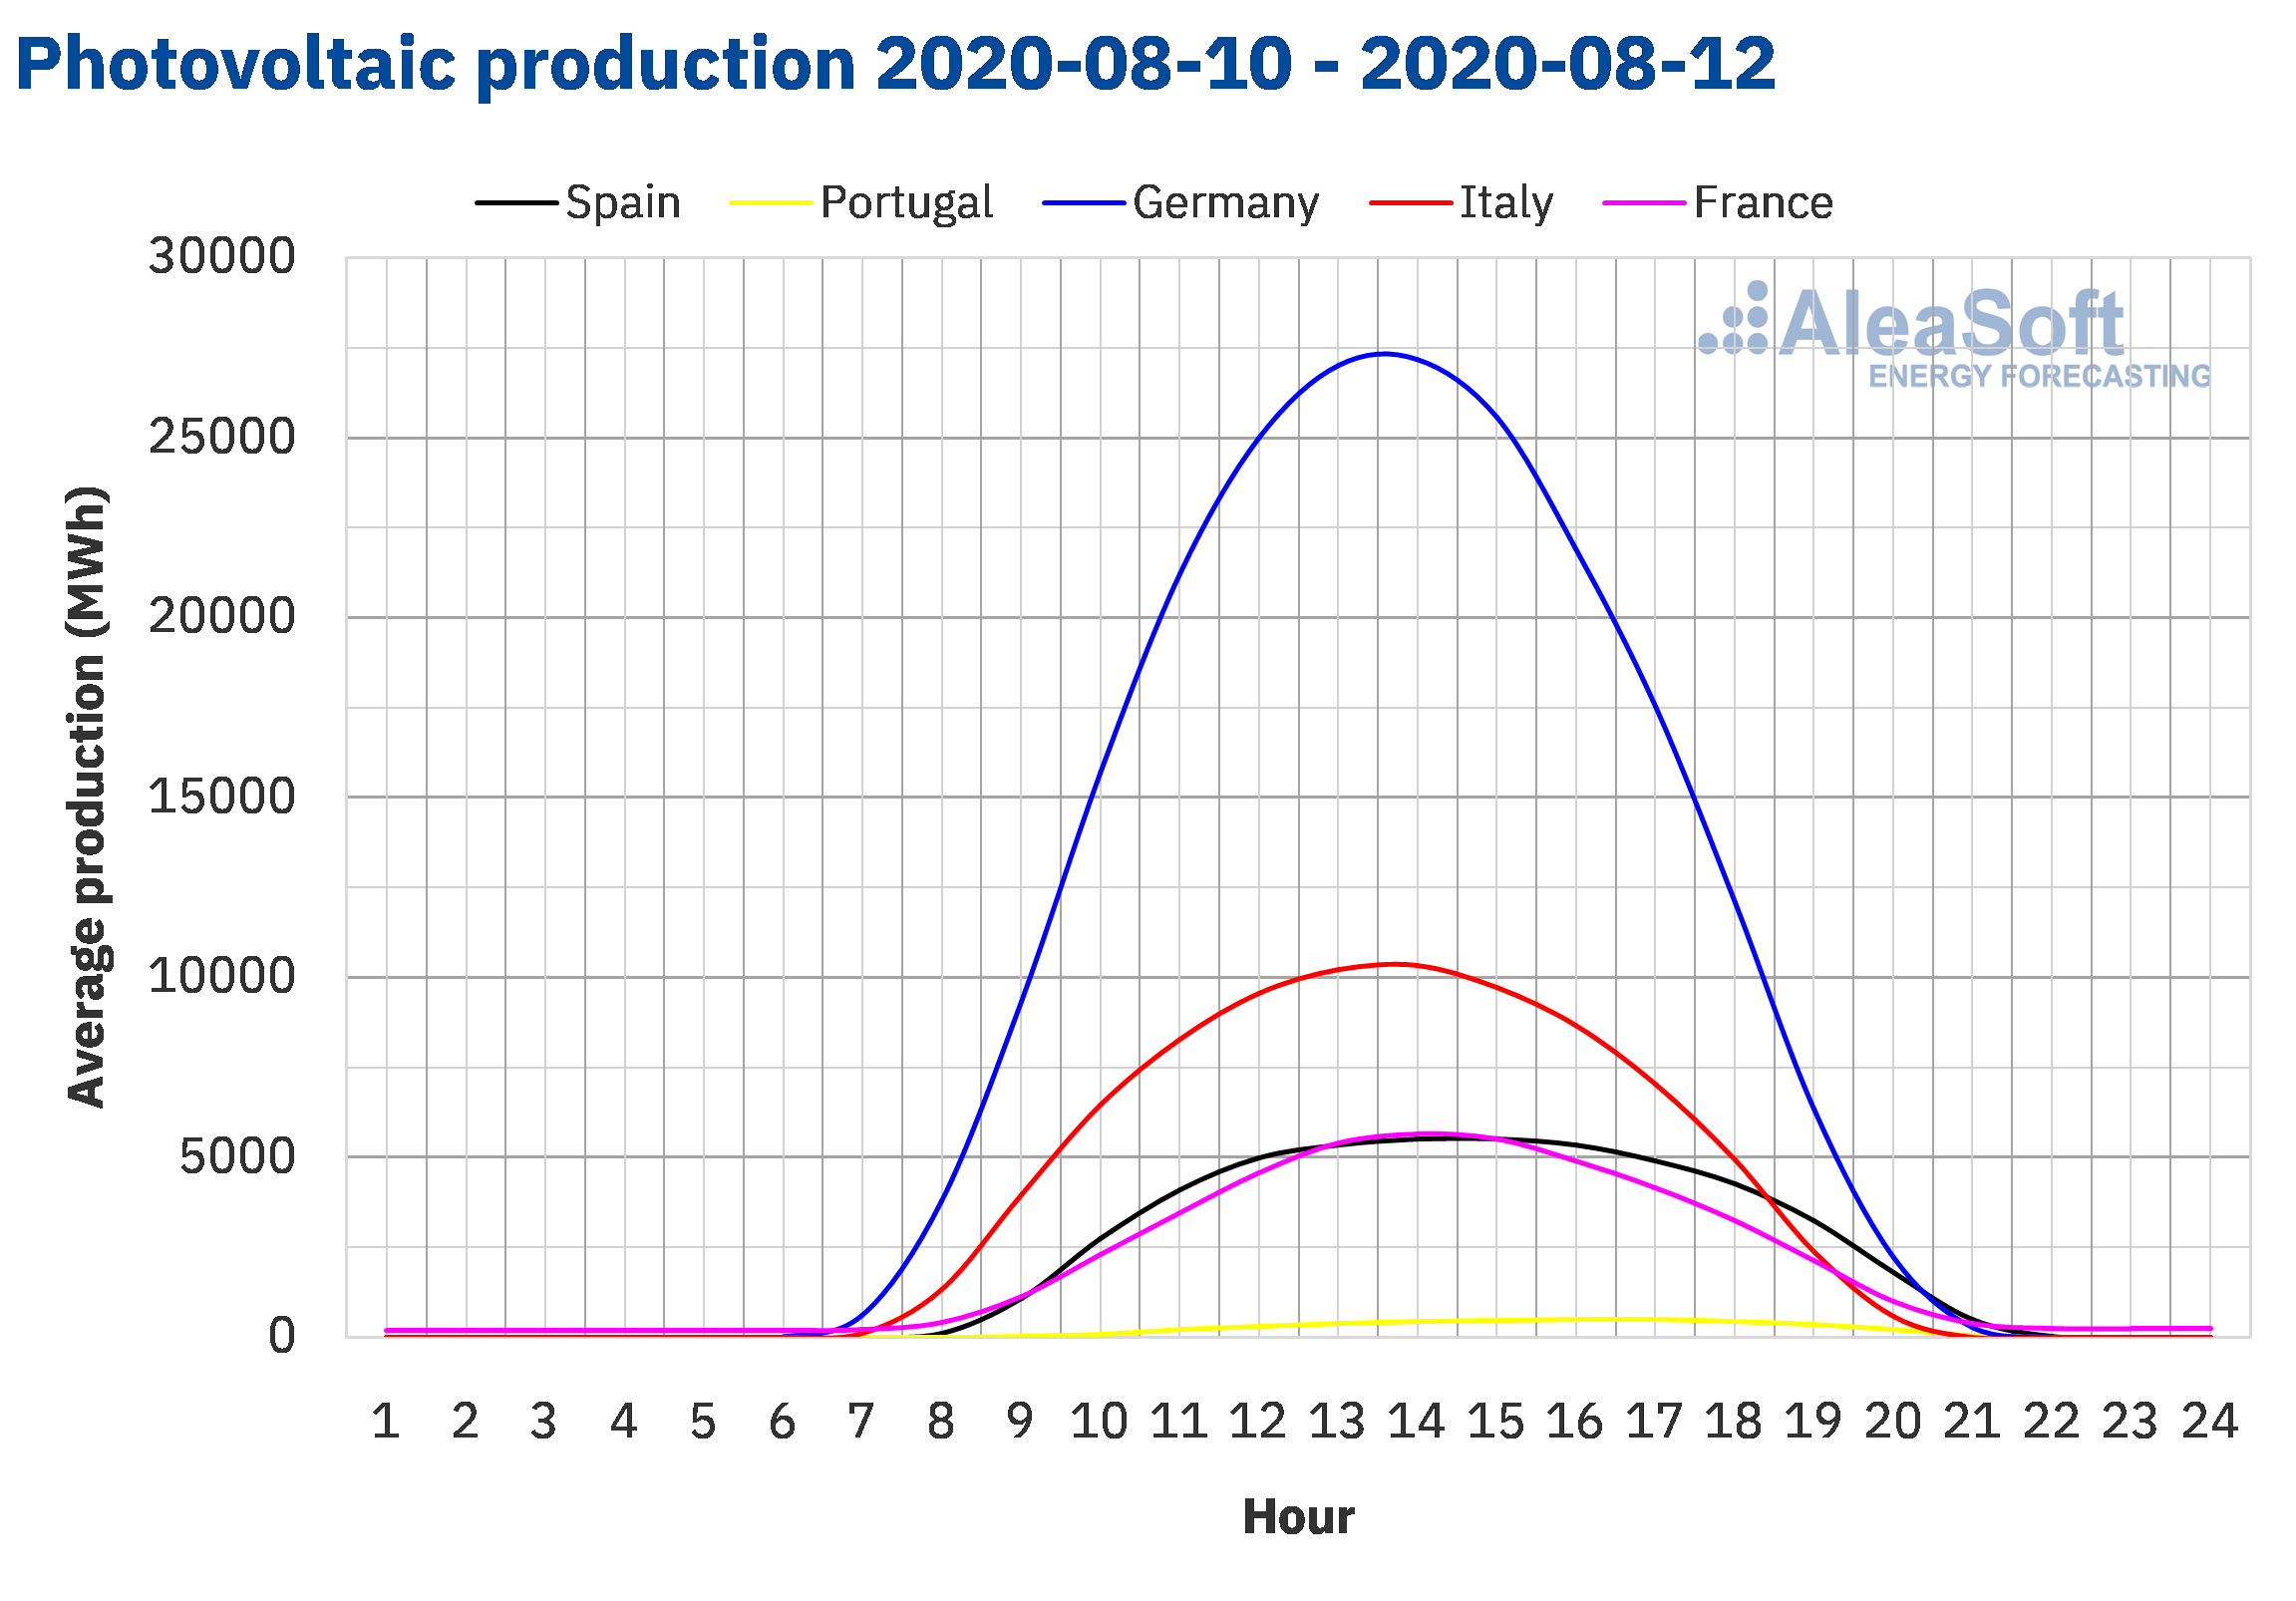
The solar energy production decreased in most of the markets analysed at AleaSoft during the period between Monday, August 10 and Wednesday, August 12, compared to the average of the previous week, the 32nd of the year. In the Iberian Peninsula, production decreased by 24% while in the French market it decreased by 18%. In the German market, production showed little variation, of 0.2%. The exception was the Italian market, where production with this technology increased by 14%.
In the 12 days elapsed in August, solar energy production was higher in all the markets analysed at AleaSoft compared to the same period in 2019. The highest growth was recorded in the Iberian Peninsula with an increase of 29%. In Germany and France there were increases of 26% and 17% respectively, while in Italy there was the smallest variation, of 4.3%.
For the week of August 10, the 33rd of the year, the analysis carried out at AleaSoft indicates that solar production in most markets will be lower than that registered during the week of August 3, with the exception of the Italian market where it is expected to increase.
 Source: Prepared by AleaSoft using data from ENTSO-E, RTE, REN, REE and TERNA.
 Source: Prepared by AleaSoft using data from ENTSO-E, RTE, REN, REE and TERNA.
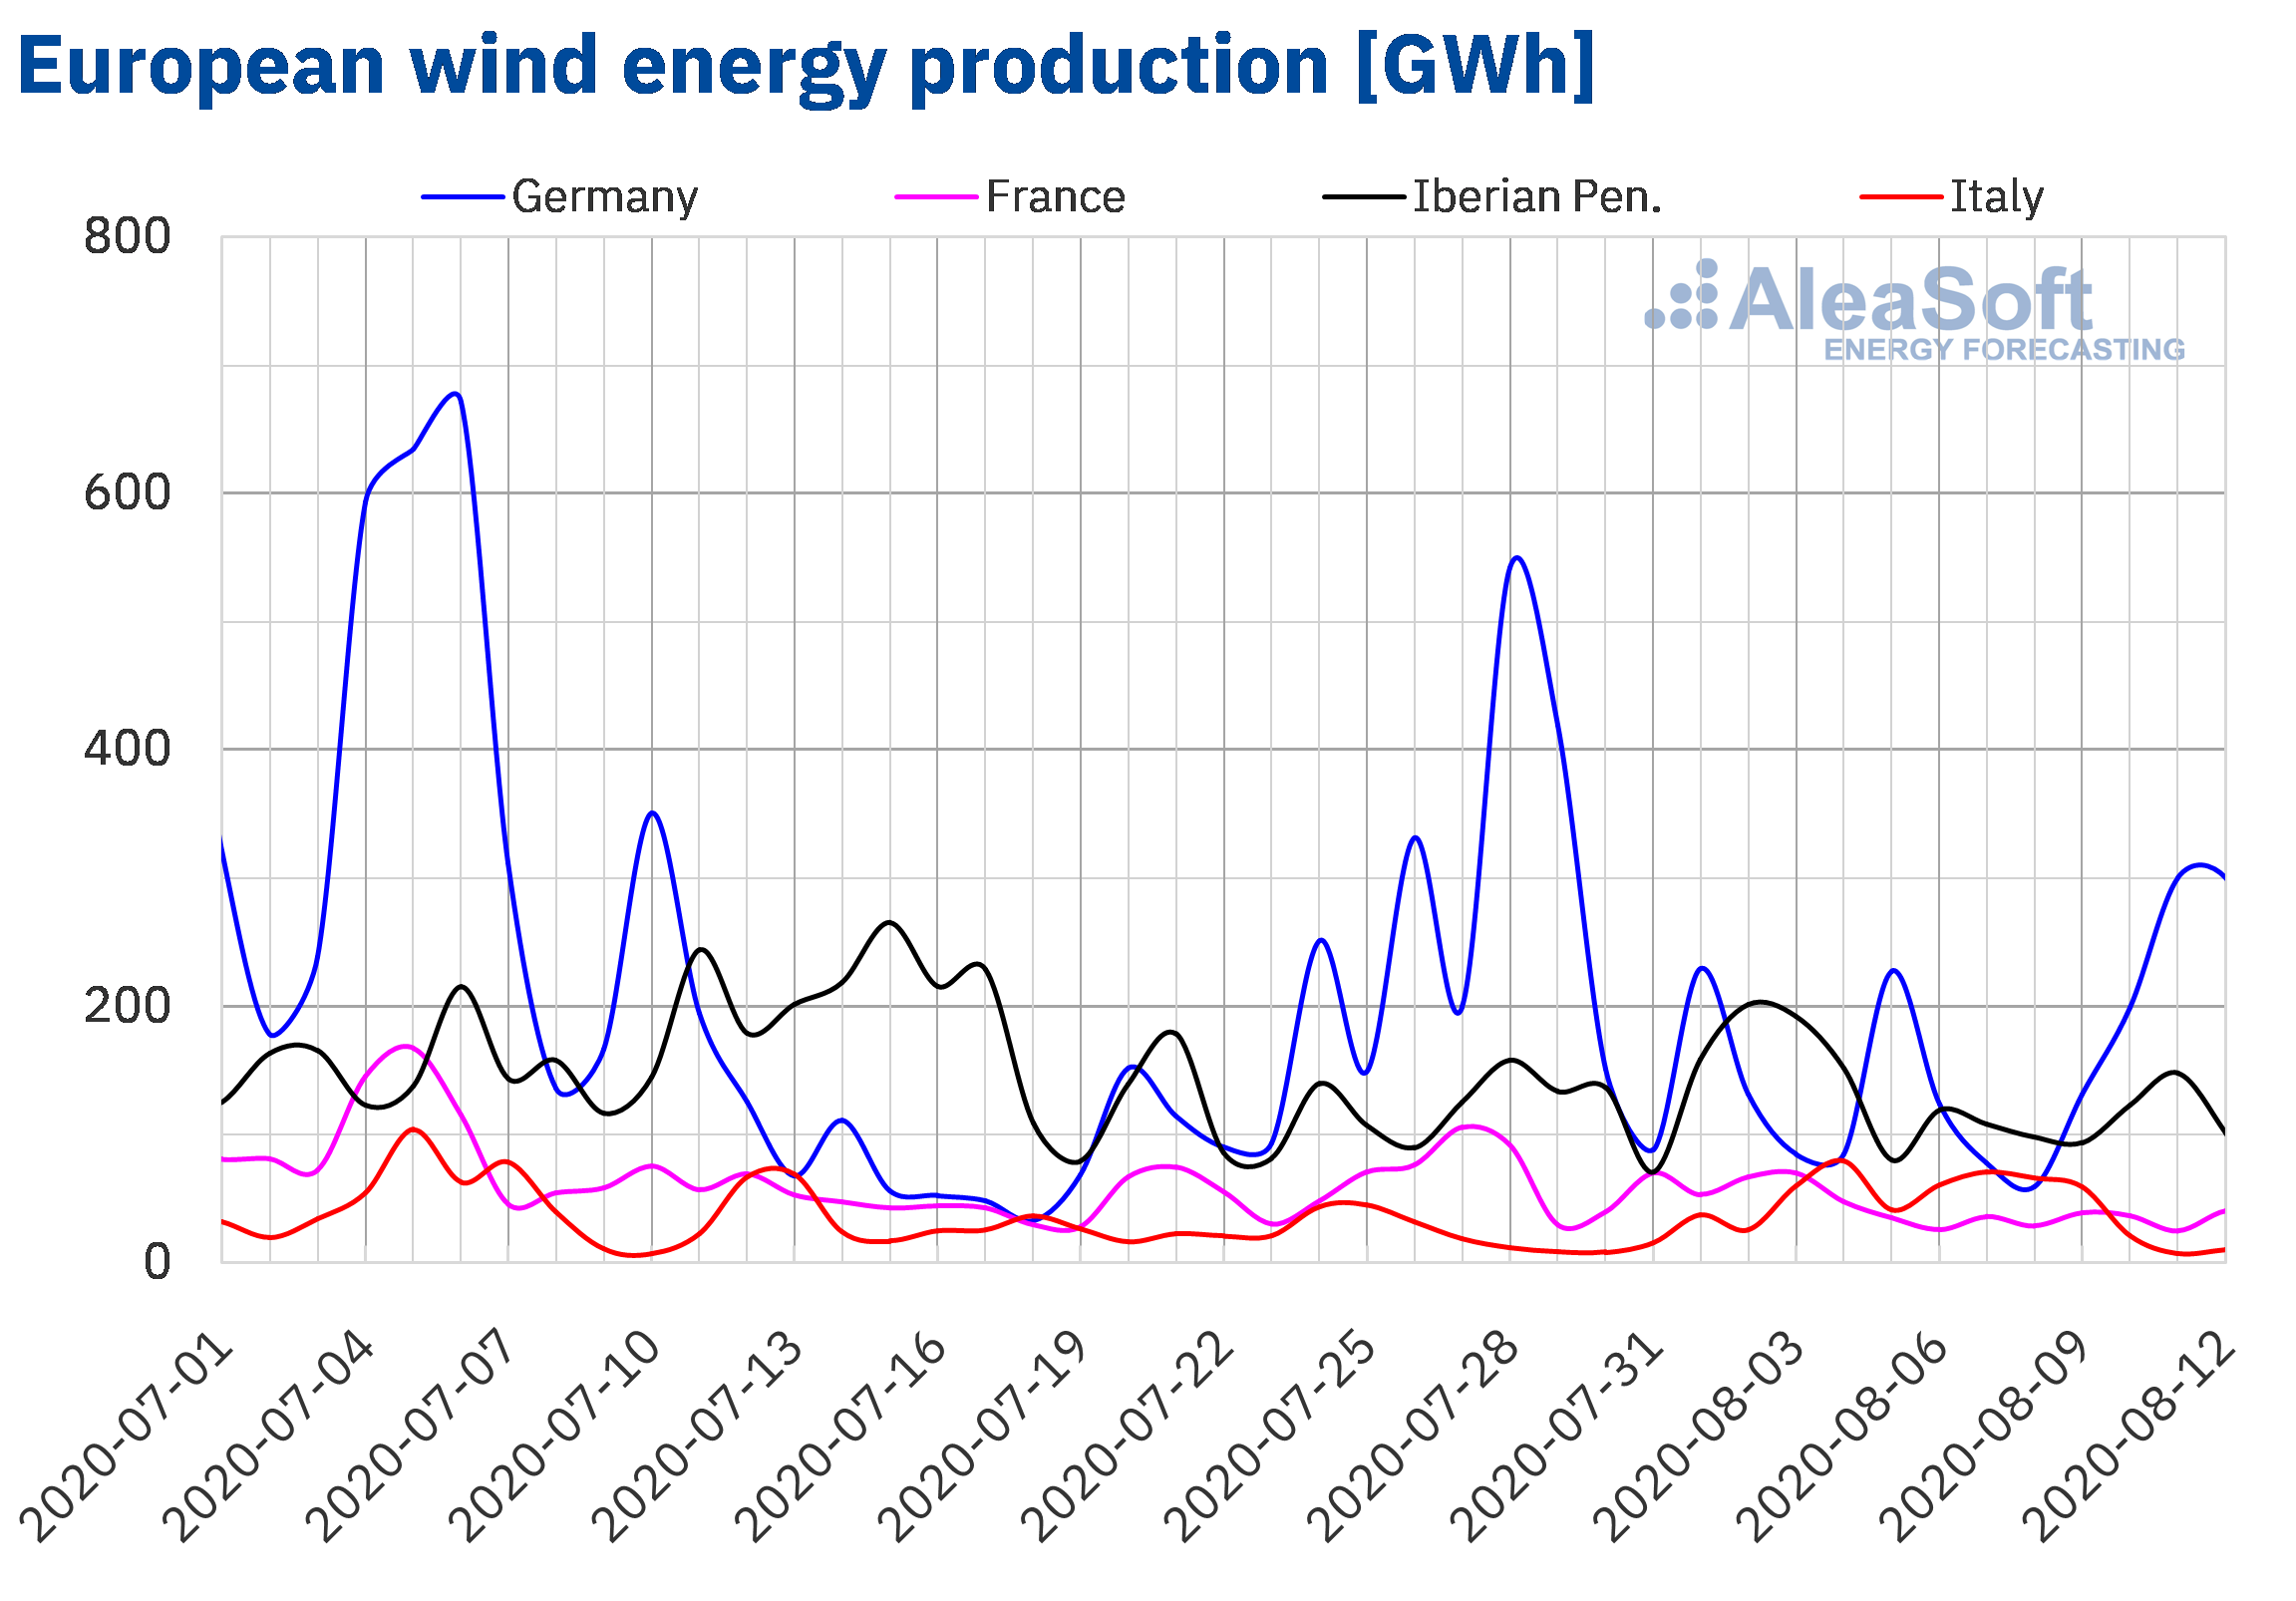
The average wind energy production for the first three days of the week of August 10 more than doubled in the German market and increased by 3.1% in the Iberian Peninsula compared to the average of the first week of August. On the contrary, in the Italian market and in the French market it decreased by 79% and 15% respectively.
Since the beginning of the month until Wednesday, August 12, wind energy production was higher compared to the first 12 days of August 2019 in the Italian market and in the Iberian Peninsula by 43% and 6.5%, respectively. On the contrary, in the French market it decreased by 28% and in the German market by 21%.
By the end of the second week of August, the AleaSoft‘s analysis indicates that the total wind energy production for the week will be lower in most markets compared to the first week of August. In contrast, wind energy production in the German market is expected to continue to be higher.
 Source: Prepared by AleaSoft using data from ENTSO-E, RTE, REN, REE and TERNA.
Electricity demand
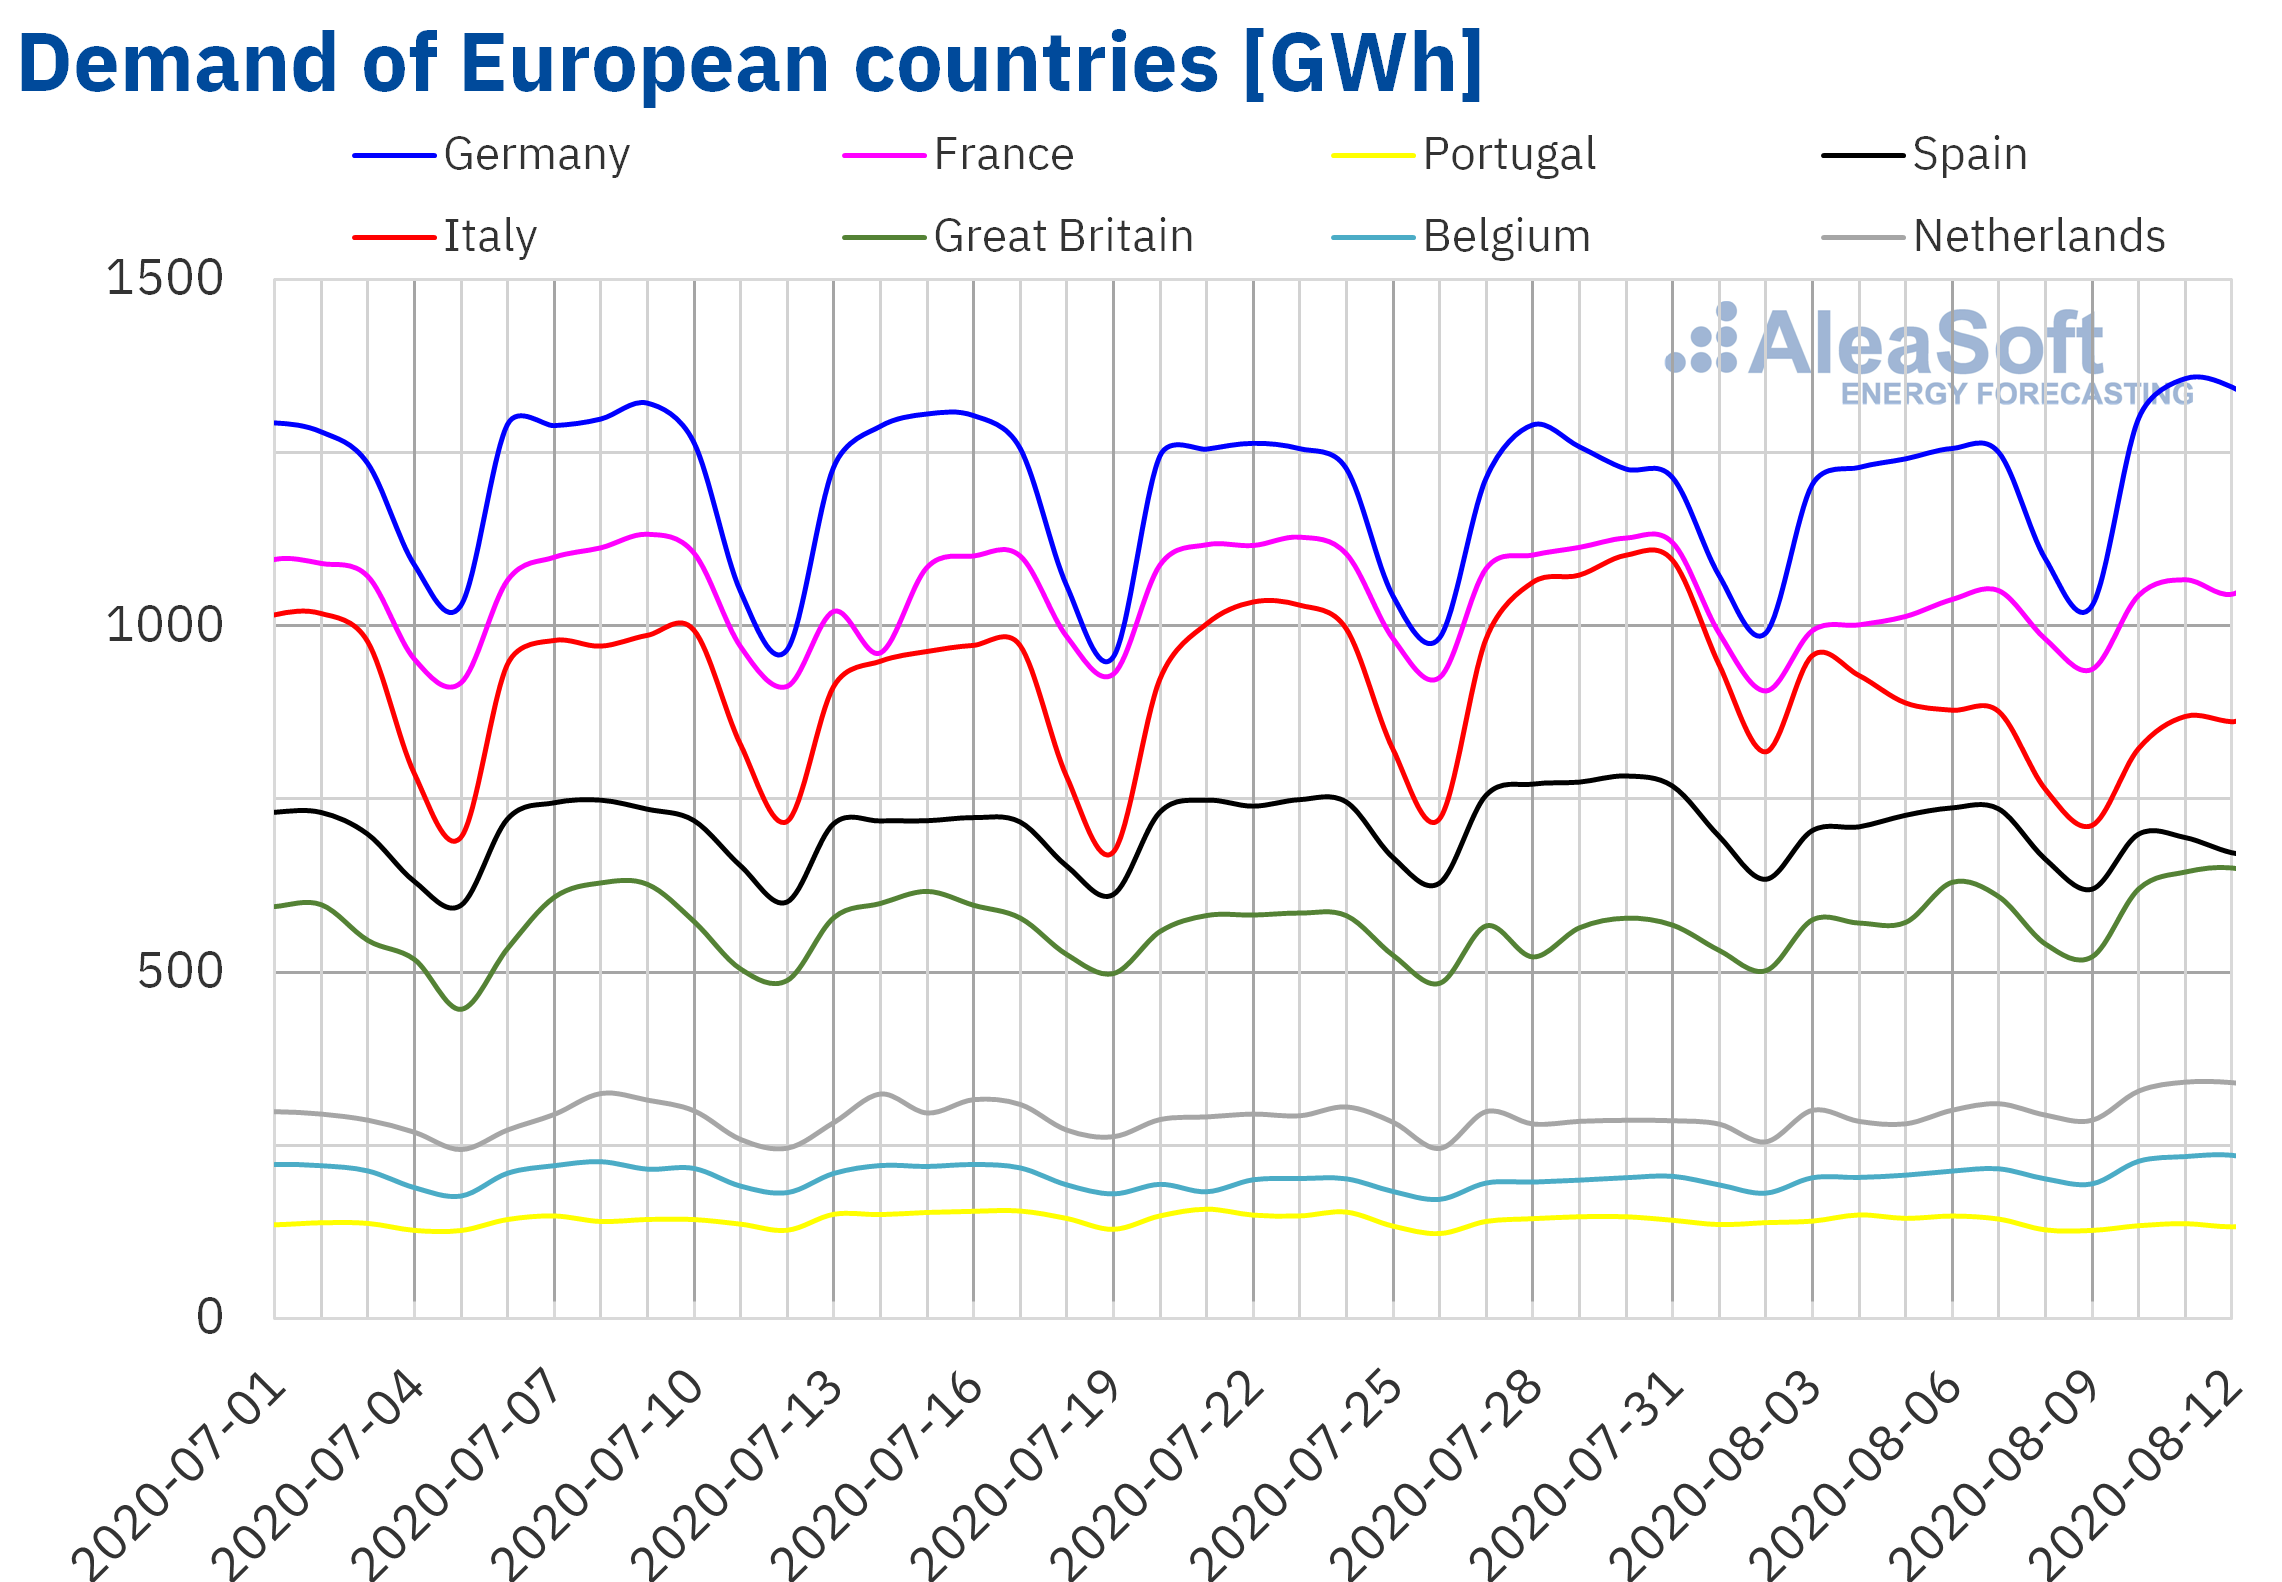
The heat wave that began at the end of the week of August 3 in Northern and Western Europe favoured the rise in electricity demand in those regions so far in the second week of August compared to the same period of the first week of August. In particular, some regions of Great Britain had the longest run of temperatures for almost 60 years, exceeding 34 °C during the days of August 7 to 12. This rise in temperatures allowed demand to increase by 11% in that territory from August 10 to 12 compared to the same period of the 32nd week of the year. Belgium was the one with the highest rise in average temperatures among those analysed, with an increase of 7.9 °C, and as a consequence caused demand to increase by 14%. In Germany and France the increases in average temperatures were around 7.0 °C and the respective increases in demand were 8.9% and 4.9%.
On the other hand, in Central Europe, the decline in labourality during the August holiday period contributed to maintaining the downward trend in electricity demand. From Monday to Wednesday of the week of August 10, the decreases in Italy and Portugal were 8.0% and 7.3% respectively.
The AleaSoft‘s electricity demand forecasting indicates that the behaviour of total demand at the end of the week of August 10 in the European markets will maintain the same trend registered up to now.
At AleaSoft‘s observatories, the electricity demand peaks during the week in European markets can be analysed, such as the cases of Great Britain and Belgium.
 Source: Prepared by AleaSoft using data from ENTSO-E, RTE, REN, REE, TERNA, National Grid and ELIA.
Mainland Spain, photovoltaic and solar thermal energy production and wind energy production
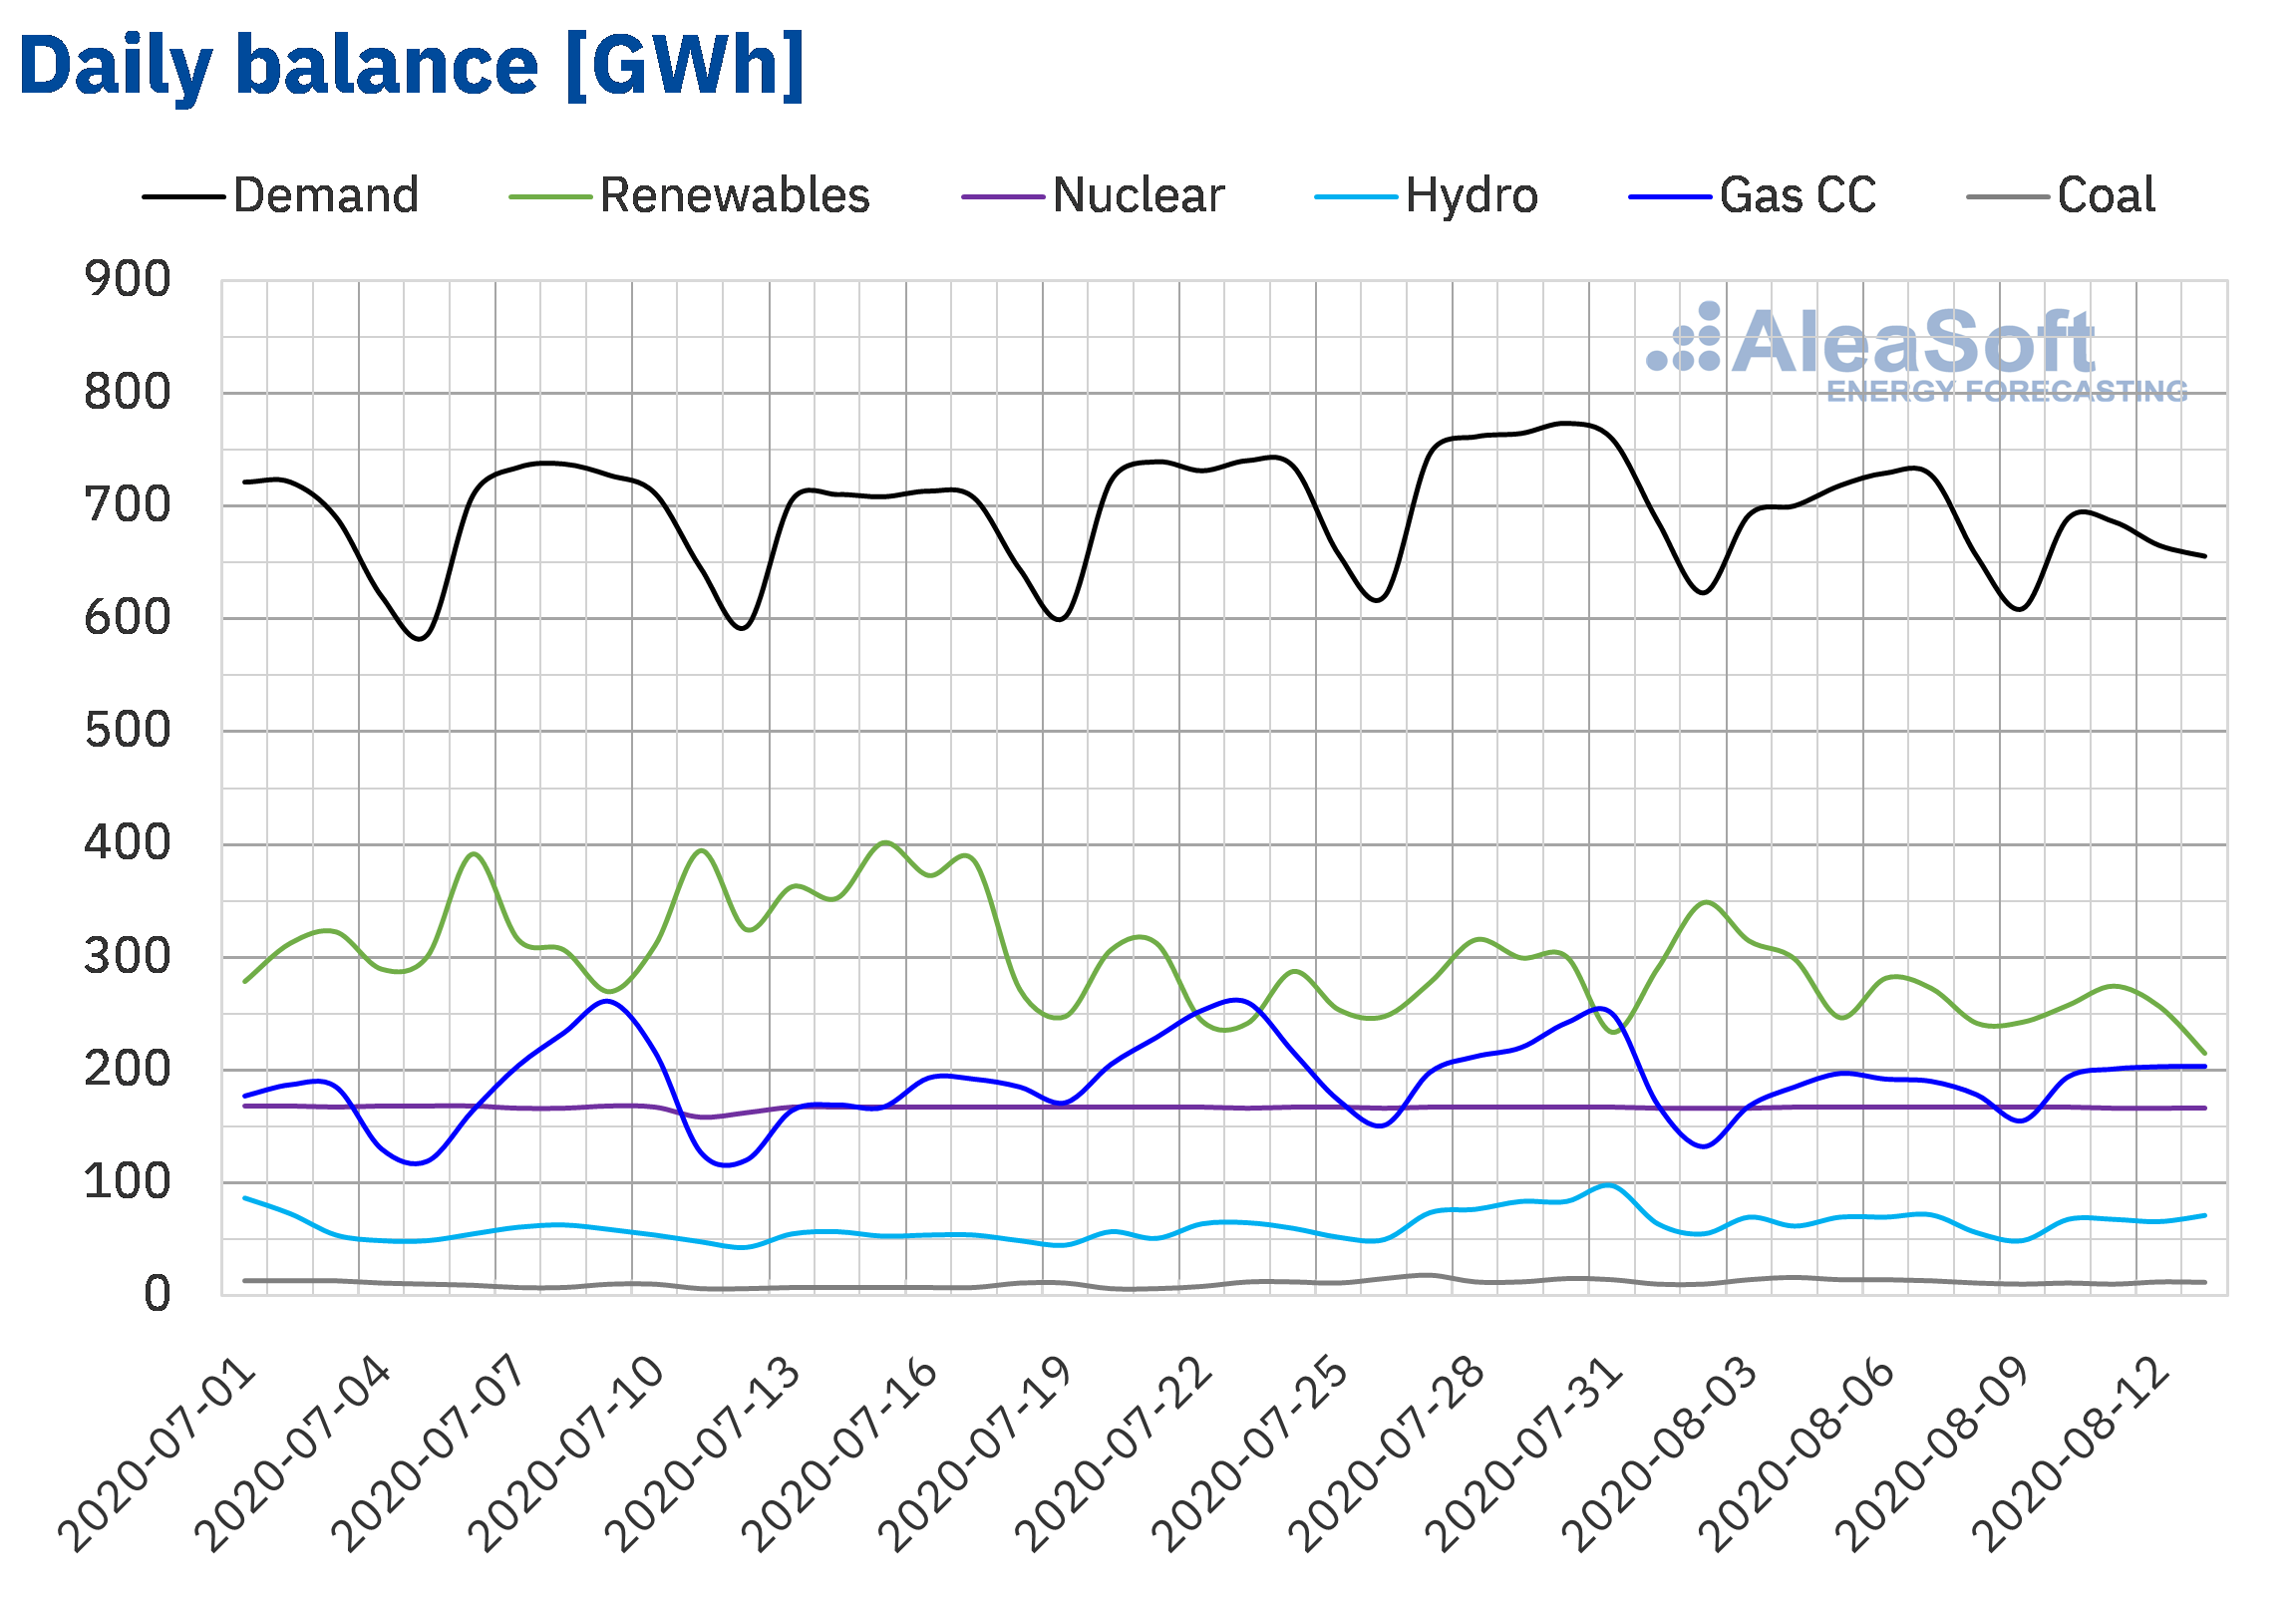
Average solar energy production in Mainland Spain, which includes both photovoltaic and solar thermal technologies, decreased by 25% between Monday, August 10 and Wednesday, August 12, compared to the average for week number 32 of 2020. In the year‑on‑year analysis of production, from August 1 to 12, registered an increase of 29%. For the second week of August, the analysis carried out at AleaSoft indicates that production will decrease compared to the total registered during the first week of August.
The average level of wind energy production in Mainland Spain for the first three days of the second week of August, increased by 8.4% compared to the average for the week of August 3. In the year‑on‑year analysis, wind energy production during the 12 elapsed days of August was 21% higher. For week 33, of August 10, the analysis carried out at AleaSoft indicates that production with this technology will be lower than that registered in week 32.
In Mainland Spain, average temperatures played a less important role than in other markets in the first three days of the week of August 10, since the difference between this average and the previous one was 0 °C. The lower labourality in August had the greatest influence on the 3.5% decrease in electricity demand. At AleaSoft it is expected that, at the end of the week of August 10, the total demand will have a more notable fall than during the first half of the week.
At the moment, all nuclear power plants are up and running and nuclear energy production maintains an average of around 166 GWh per day.
 Source: Prepared by AleaSoft using data from REE.
The hydroelectric reserves currently have 12 995 GWh stored, according to data from the Hydrological Bulletin of the Ministry for Ecological Transition and Demographic Challenge number 32, which represents a decrease of 497 GWh compared to the bulletin of the previous week.
European electricity markets
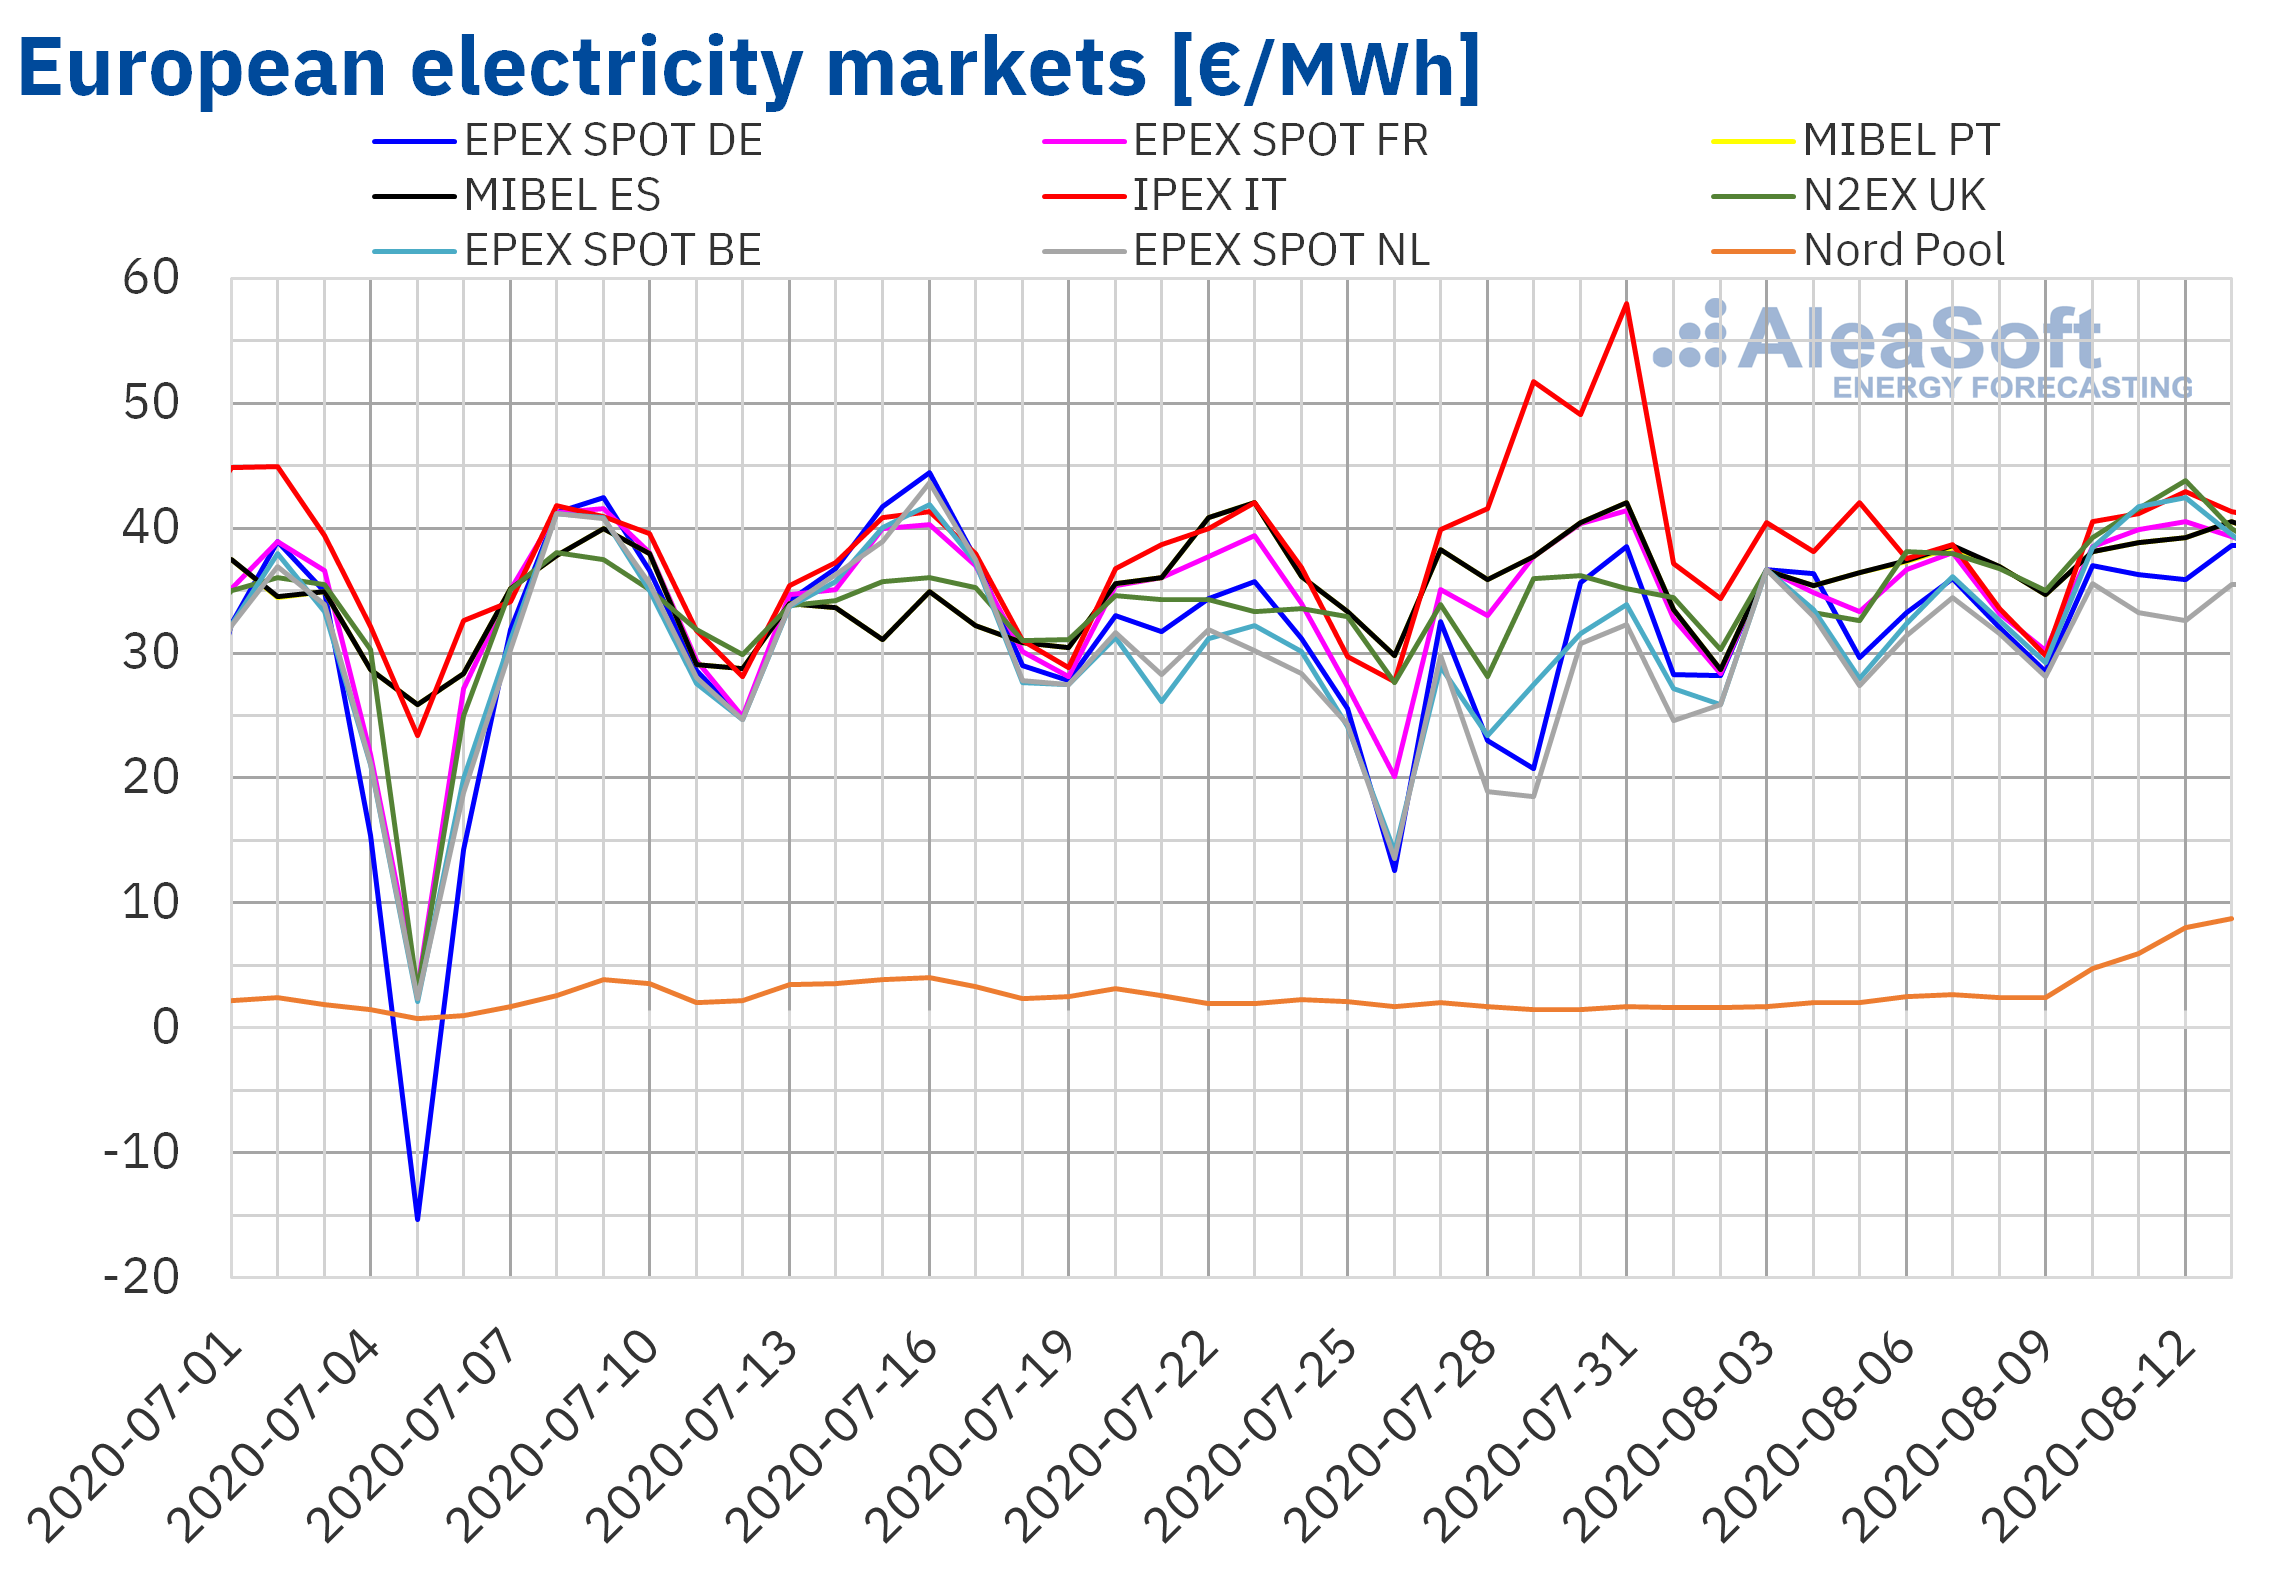
During the elapsed days of the week of August 10, the prices of the European electricity markets remained relatively stable. The vast majority converging around €40/MWh, except for the EPEX SPOT market in the Netherlands, which was around €6/MWh below the rest and the Nord Pool market in the Nordic countries, which is much unrelated with the rest of European markets in terms of prices. This last market in the last sessions presented a quite marked upward behaviour.
The prices of all the markets analysed at AleaSoft increased compared to those of the first week of August. The Nord Pool market increased its price by 233% compared to the same days of the week of August 3. With an average of €6.85/MWh for this period, the price in this market is still almost one sixth of its average price on the equivalent days of the second week of August 2019 and the lowest in Europe. At the other end of the price order is the IPEX market of Italy, which continued to be the European market with the highest price, with an average so far this week of €41.49/MWh although closely followed in this period by the N2EX market in Great Britain, which registered an average price of €41.12/MWh in the days of the week.
Although the rise compared to the week of August 3 was clear and general, the behaviour compared to the equivalent days of the second week of August 2019 was uneven. Most markets registered lower prices than last year, except for the EPEX SPOT market in France and Belgium, which registered increases of 30% and 27% respectively. The German market was the one with the smallest difference compared to 2019, with a drop of only 0.6%. In the rest of the markets, the decreases were between 7.3% and 11%. The Nord Pool market, despite its recent increase in prices, presented a variation with respect to the same week of the previous year of ‑81%.
 ource: Prepared by AleaSoft using data from OMIE, EPEX SPOT, N2EX, IPEX and Nord Pool.
These increases in prices during the first four days of the week have as fundamental causes the increase in electricity demand in most markets, due to the increase in temperatures due to the heat wave, and due to the reduction in production with renewable energies in part of the European countries.

The AleaSoft‘s price forecasting indicates that prices for this weekend will be lower than those of the previous weekend in most markets due to lower demand during the weekend and less warm temperatures, after ending the wave of hot weather. Even so, the average price for the week of August 10 will end up being higher than that of the first week of August.
Iberian market
In the past days in the second week of August, the MIBEL market in Spain and Portugal presented higher prices than those registered during the same days of the week of August 3. The increases were 7.5% in the case of Spain and 7.6% in the case of Portugal. In this market the price so far this week was €39.19/MWh for both countries, 0.9% lower than the French market price.
At AleaSoft, prices in this market are expected to fall for the rest of the week, presenting lower prices during the weekend than those of the same period of the week of August 3. However, in general the weekly price will end up being slightly higher.
Electricity futures
In the European electricity futures markets, prices registered an almost general decline for the product of the next quarter. The exception was the ICE market in the Nordic countries, which increased its price by 0.2%. In the rest of the markets, between the settlement of the sessions of August 7 and August 12, the decreases were between 1.1% of the NASDAQ market of the Nordic countries and 5.4% of the ICE market of Netherlands.
Regarding the futures of electricity for calendar year 2021, the markets behaviour was similar to that of the quarterly product. In this case, the price increase occurred both in the ICE market and in the NASDAQ market of the Nordic countries. The rest of the markets registered decreases of between 0.8% of the EEX market of Great Britain and 2.2% of the EEX markets of Germany and ICE of Belgium.

Brent, fuels and CO2
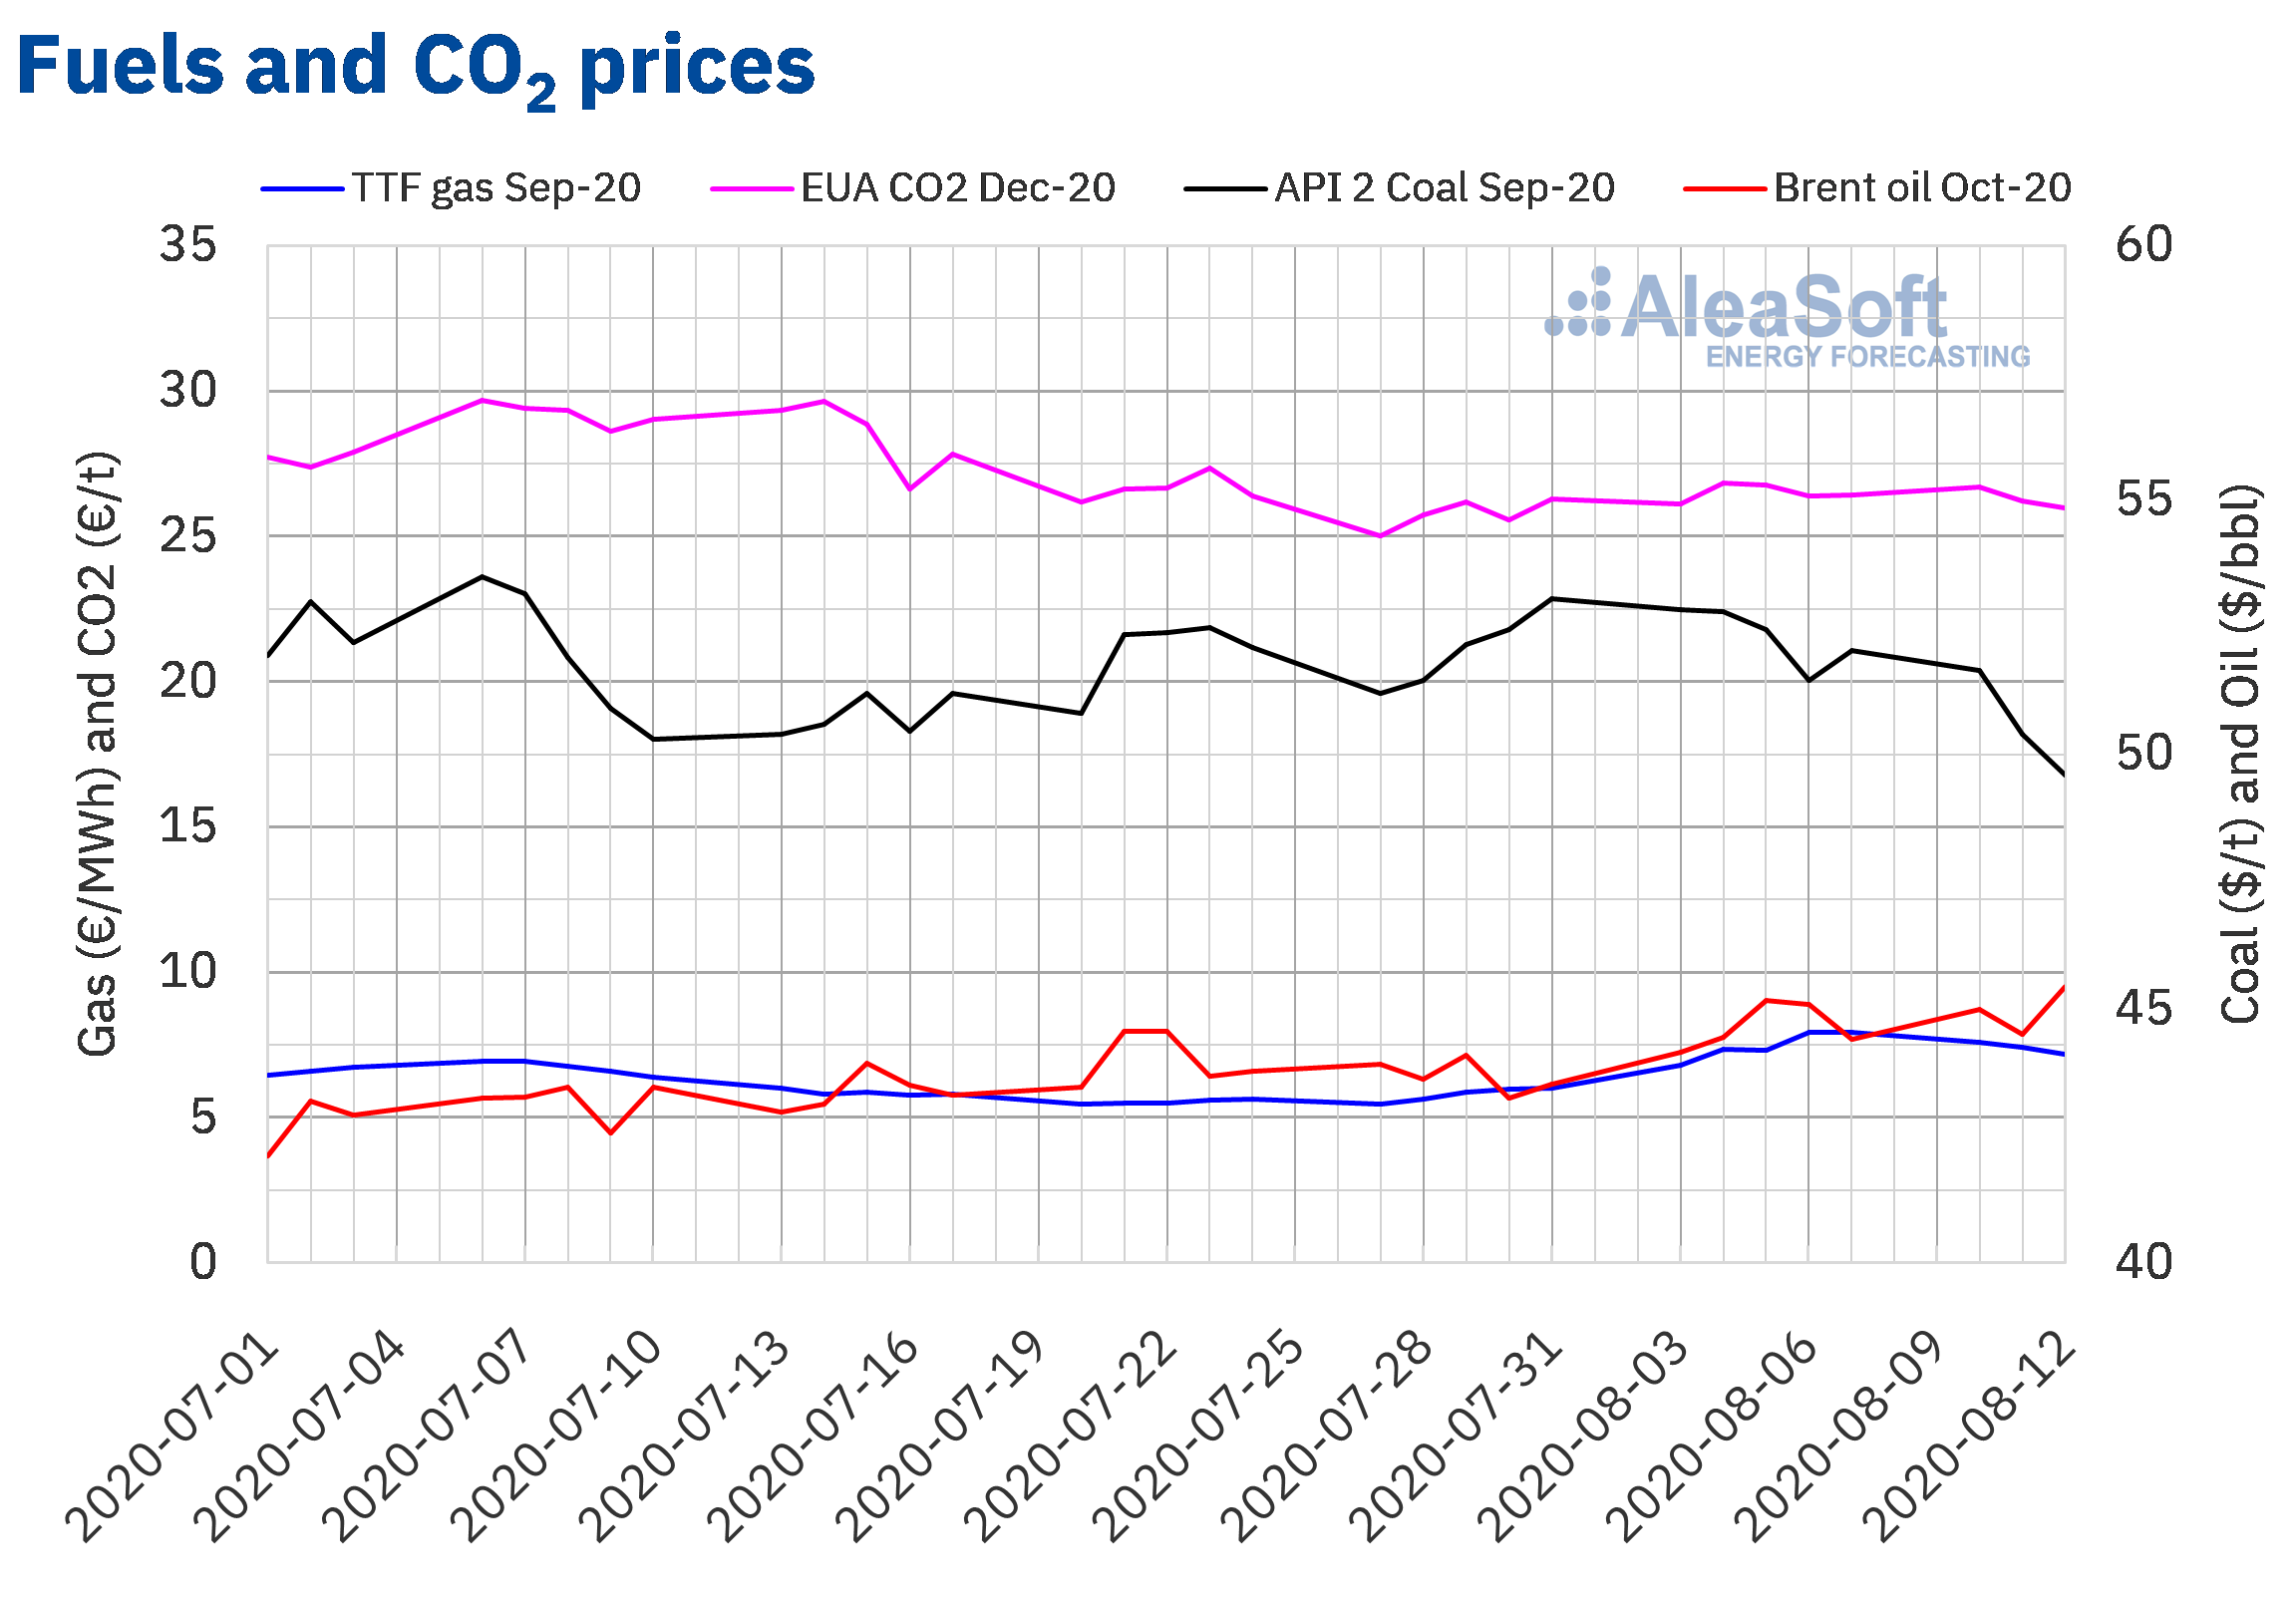
The prices of the Brent oil futures for the month of October 2020 in the ICE market remained above $44/bbl during the first three days of the 33rd week of 2020. During this period, prices were higher than the same days of the first week of August. On Monday, August 10, a price of $44.99/bbl was reached, 1.9% higher than that of August 3. Subsequently, on Tuesday it fell 1.1% compared to the previous day, reaching $44.50/bbl, however, it continued to be 0.2% higher than the August 4 price. Already on Wednesday, August 12, prices increased again by 2.1% until reaching the maximum so far this week of $45.43/bbl.
This increase in price was related to the announcement that the oil reserves of the United States had decreased at the end of the first week of August. However, concerns about the negotiations for the economic stimulus package in the United States, along with the uncertainty in the recovery of demand due to the increase in COVID‑19 infections around the world, continued to weigh on the market, limiting profits.
On the other hand, from Monday to Wednesday of the second week of August, the TTF gas futures in the ICE market for the month of September 2020 changed the trend that had been registered for two weeks. On Monday, August 10, prices fell to €7.59/MWh, 4.3% lower than those of Friday, August 7, although they continued to be 12% higher than those of August 3. On Tuesday, prices continued to fall compared to the previous day to €7.42/MWh, although they continued to be 0.8% higher than those of Tuesday of the first week of August. Subsequently, on Wednesday, August 12, the lowest price of the period of €7.17/MWh was reached, the levels were lower than those of August 5 by 2.0%. This decline in prices during the three days of the week is due to the return during the next week of more usual temperatures for these months, after the recent heat wave.
Regarding the prices of TTF gas in the spot market, the first two days of the second week of August had values above €7/MWh, to later fall below this amount. On Monday, August 10, a price of €7.23/MWh was reached, the highest since April 8. However, during the rest of the week, prices gradually fell to €6.39/MWh on Thursday, August 13. This price was lower than the previous day by 6.8% and the lowest since August 4.
Regarding the API 2 coal futures prices in the ICE market for the month of September 2020, they continued the downward trend that they had been registering since the first week of August and that was interrupted in the last session of the week of August 3, after increasing 1.2% compared to the previous day. On Monday, August 10, a price of $51.65/t was reached, the highest of the first three days of the week and 0.8% lower than that of Friday, August 7. In the two following days, the downward trend continued with prices below $51/t. On Wednesday, August 12, the minimum price of the period of $49.60/t was reached, 1.6% lower than the previous day and the lowest since June 22. Competitive gas prices, coupled with larger coal stocks and lower demand is what continues to push coal prices down.
The CO2 emission rights futures in the EEX market for the December 2020 reference contract remained above €26/t during the first two days of the week. On Monday, August 3, they reached a closing price of €26.70/t, the maximum for the period and 2.2% higher than on Monday, August 3. But on Tuesday and Wednesday they showed a downward trend, reaching a price of €25.97/t on August 12, 3.0% lower than on Wednesday, August 5 and the lowest since July 30.
 Source: Prepared by AleaSoft using data from ICE and EEX.
AleaSoft analysis on the energy markets recovery from the economic crisis
The uncertainty caused by the fear of the massive appearance of new outbreaks of COVID‑19 when the new school year arrives and the reopening of schools is conditioning the forecasts for the recovery of energy markets in the medium term. AleaSoft has organised a series of webinars on “The energy markets in the end of the economic crisis” that consists, for the moment, of two parts: the first on September 17 and the second on October 29. Speakers from Deloitte, Engie, Banco Sabadell and AleaSoft have confirmed their presence for these two parts. During the webinars, the evolution and perspectives of the energy markets will be analysed and will include analysis on the state of renewable energy projects financing in a situation of significant uncertainty regarding the evolution of markets and prices in the medium term, and the importance of the forecasting in the audits and in the portfolio valuation.
At AleaSoft, the long‑term price curves of the European electricity markets have been updated with the most recent recovery scenarios from the coronacrisis after the publication of the results of the European economies during the second quarter.
The evolution of the European electricity, fuel and CO2 emission rights markets can be tracked in AleaSoft‘s observatories. In them you will find data that is updated daily and that can be viewed in a comparison with the previous weeks, to see its evolution.
Source: AleaSoft Energy Forecasting.
