AleaSoft, April 1, 2019. AleaSoft analyses the evolution of the markets of fuels, CO2 emission rights and electricity in March, a month in which the general downward trend of the prices in the European markets of this year continued due to the descent of the fuel prices, lower electricity demand and above all a considerable increase in renewable photovoltaic and wind energy production.
Brent, fuels and CO2
The prices of Brent oil futures for May 2019 in the ICE market closed the month of March at 68.39 $/bbl, a value reached on Friday 29. At the end of last year, the minimum price of 51.31 $/bbl was reached, so the rise in just over three months was 17 $/bbl, which represents a rise of more than 30%. The curve of rising prices was stable during the first quarter that ends, setting an asymptotic value at 70 $/bbl that will not be easy to reach unless the conditions in the international situation deteriorate, for example, in the case of Venezuela.

The TTF gas futures in the ICE market for May, as in the previous months, continue with a downward trend since the beginning of October 2018. On Friday 29 they settled at 14.21 €/MWh, breaking the minimum record of March 25, when prices settled at 14.23 €/MWh. At the beginning of October prices up to 25.36 €/MWh were reached, so the fall was of more than 11 €/MWh. Although the speed of the fall seems to have slowed down, from AleaSoft it is considered that they do not seem to stabilize until 14 €/MWh is reached.
The prices of API 2 coal futures for the month of April in the ICE market ended the month of March with a continuous fall. The settlement price of Friday 29 was 61.95 $/t, breaking the barrier of 62 $/t, which did not happen since May 2017. Because of the slope of falling prices, it seems that it will fall below 60 $/t in the next few days, as we are close to the minimum values of two years ago. At the beginning of October, the price reached 100.65 $/t.
The evolution of gas and coal in these two years has been quite similar. Since April 2017 with relatively low stable values in both cases, prices went up to reach maximum values in October 2018 and since then fell by 40% to return to values similar to those of two years ago.
The prices of the futures of CO2 emission rights for the December 2019 reference contract in the EEX market settled on Friday, March 29, at 21.55 €/t, which is a similar price to that of the beginning of March and it can be considered an average value since October 2018, because the prices ranged between 20 €/t and 22 €/t, with decreases down to 16 €/t and increases up to 25 €/t.
In an analysis of the influence of the CO2 emission rights prices on the prices of the different electricity markets, it is observed that the evolution has been directly conditioned in this last year. Two totally correlated stages can be seen. First with the rise in CO2 between April and October of 2018, and then with the stabilization until March of this year. These two stages correspond to the generalized rise in European prices in the period between April and October and the subsequent stabilization. At AleaSoft we consider that CO2 prices above 20 €/t lead to increases in electricity market prices that harm consumers, especially the electro-intensive industries.
European electricity markets
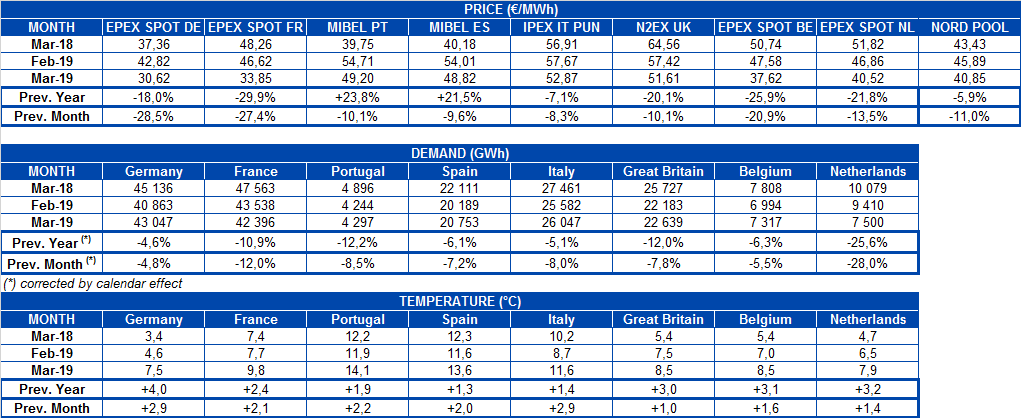
In a comparative analysis of the month of March with respect to February of this year, in all the European markets the spot prices dropped an average of 15% due to a decrease in the average demand, due to an average increase in the temperature of about 2 °C which corresponds to the beginning of spring, and also to the fall in the prices of gas and coal. Renewable energy production had a significant impact on the decrease in March prices, with an increase in wind energy production of 30% and solar energy production of 29% in the main European markets.
In the month of March, the prices of the European electricity markets are clearly differentiated in two groups. In the group with the highest prices are located the British market N2EX and the Italian market IPEX, together with the MIBEL market of Spain and Portugal, although it must be pointed out that the MIBEL market moved to the lower group in some occasions. The monthly average of these three markets was 51 €/MWh. For the month of April in AleaSoft it is considered that they could go down to 45 €/MWh, taking into account a lower electricity demand, lower gas and coal prices, and also a higher photovoltaic energy production due to more hours of sunshine. In the case of the Spanish market, in AleaSoft it is considered that there will be a price rebound in the first days of April, since the 7% electricity generation tax that had been suspended since October 1 goes into effect again.
The Nord Pool markets of the Nordic countries and the EPEX SPOT markets of Belgium, the Netherlands, France and Germany, with prices between 30 and 40 €/MWh are in the lowest price range. In the case of France and Germany, market prices were below 30 €/MWh in many days during the first half of March, due to a high wind energy production.
Electricity futures
During the month of March, there was a generalized decrease in the price of European electricity futures for the month of May, parallel to the drop of fuel prices, mainly gas and coal. The most important decreases were registered in the countries of Central-Western Europe, with magnitudes around 14%, while in the countries of the Mediterranean shore the falls were of less than 10%.
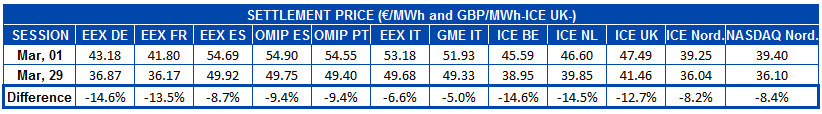
In the EEX market, the futures of Germany, France, Spain and Italy, as well as the futures of Spain and Portugal in the OMIP market during last March reached the historical minimum settlement price for the monthly product of May 2019.
Wind energy and solar energy production
During the month of March, the wind energy production had a considerable increase compared to February. The rise was of 30% in the global of the European markets. Compared to the month of March 2018, in France and Germany the increase in wind energy production was 50%, while in the Iberian Peninsula there was a fall of 39%, since in March of last year the historical record of monthly wind energy production in Spain was reached with more than 7.5 TWh.
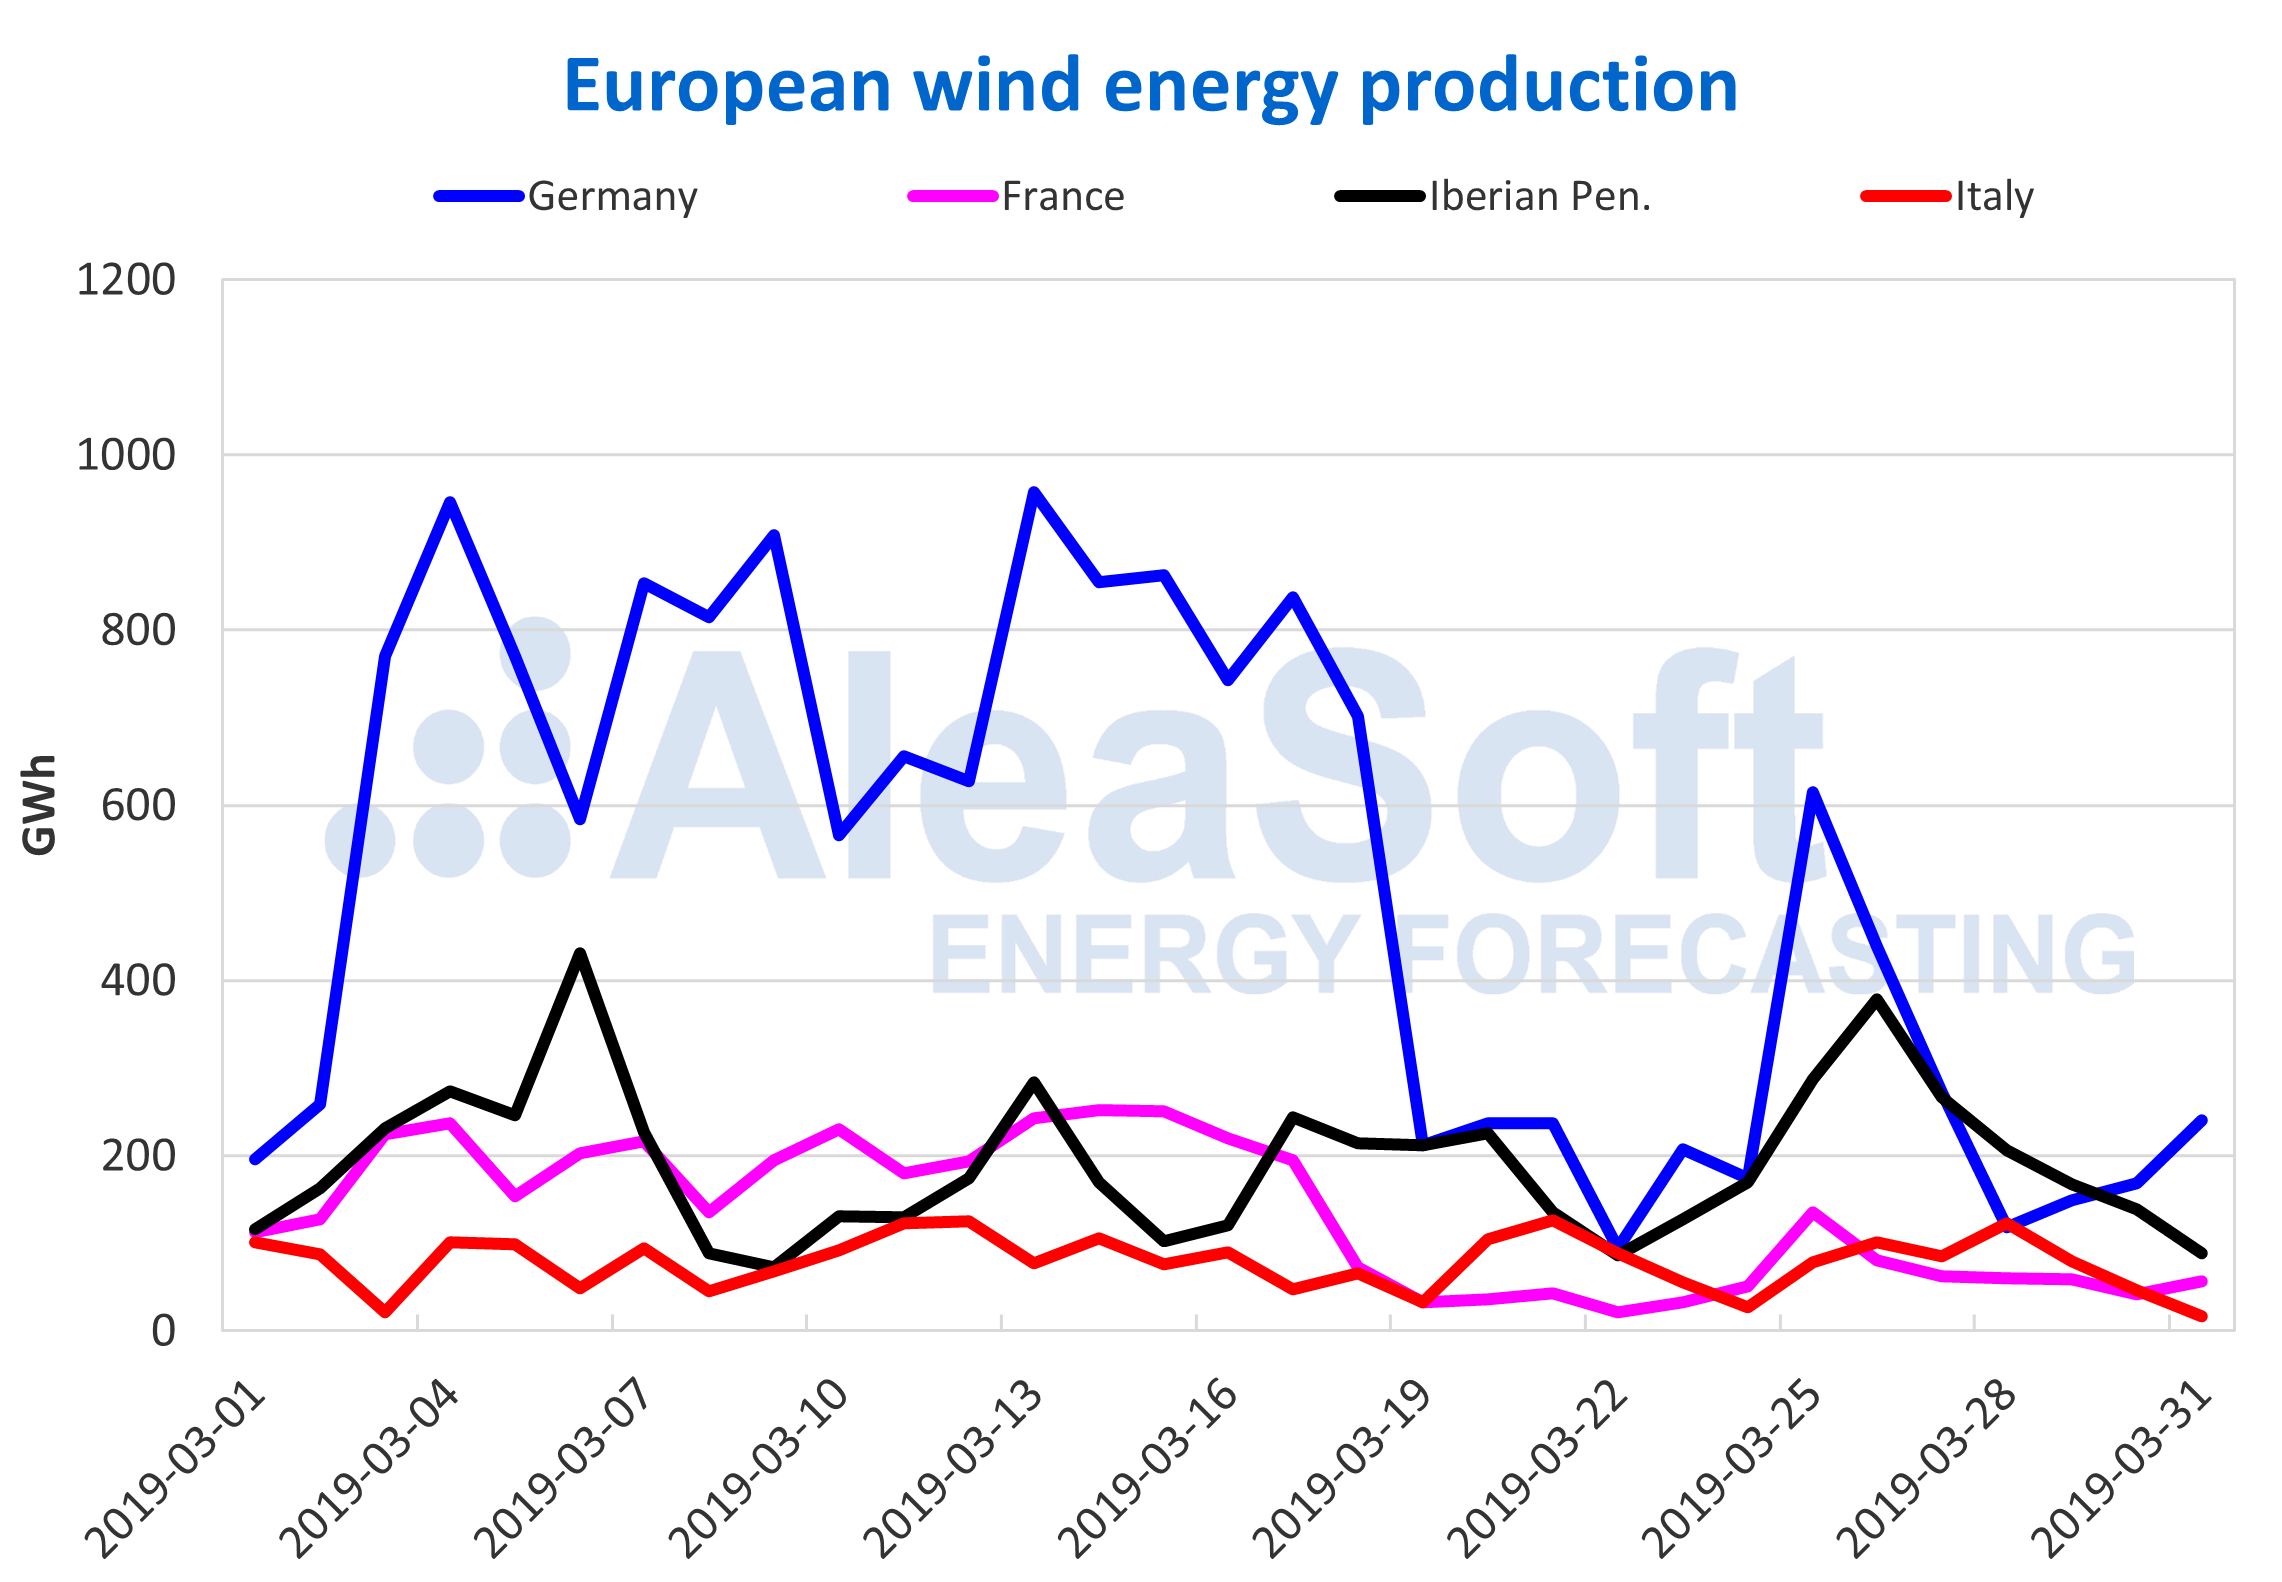
Sources: Prepared by AleaSoft with data from ENTSOE, RTE, REN, REE and TERNA.
In the case of the solar energy production, which includes both photovoltaic and solar thermal technologies, the increase compared to the month of February was close to 30% in each of the main producers: Germany, Italy and Spain. With more hours of sunshine each month until the summer, solar energy production will continue to increase.
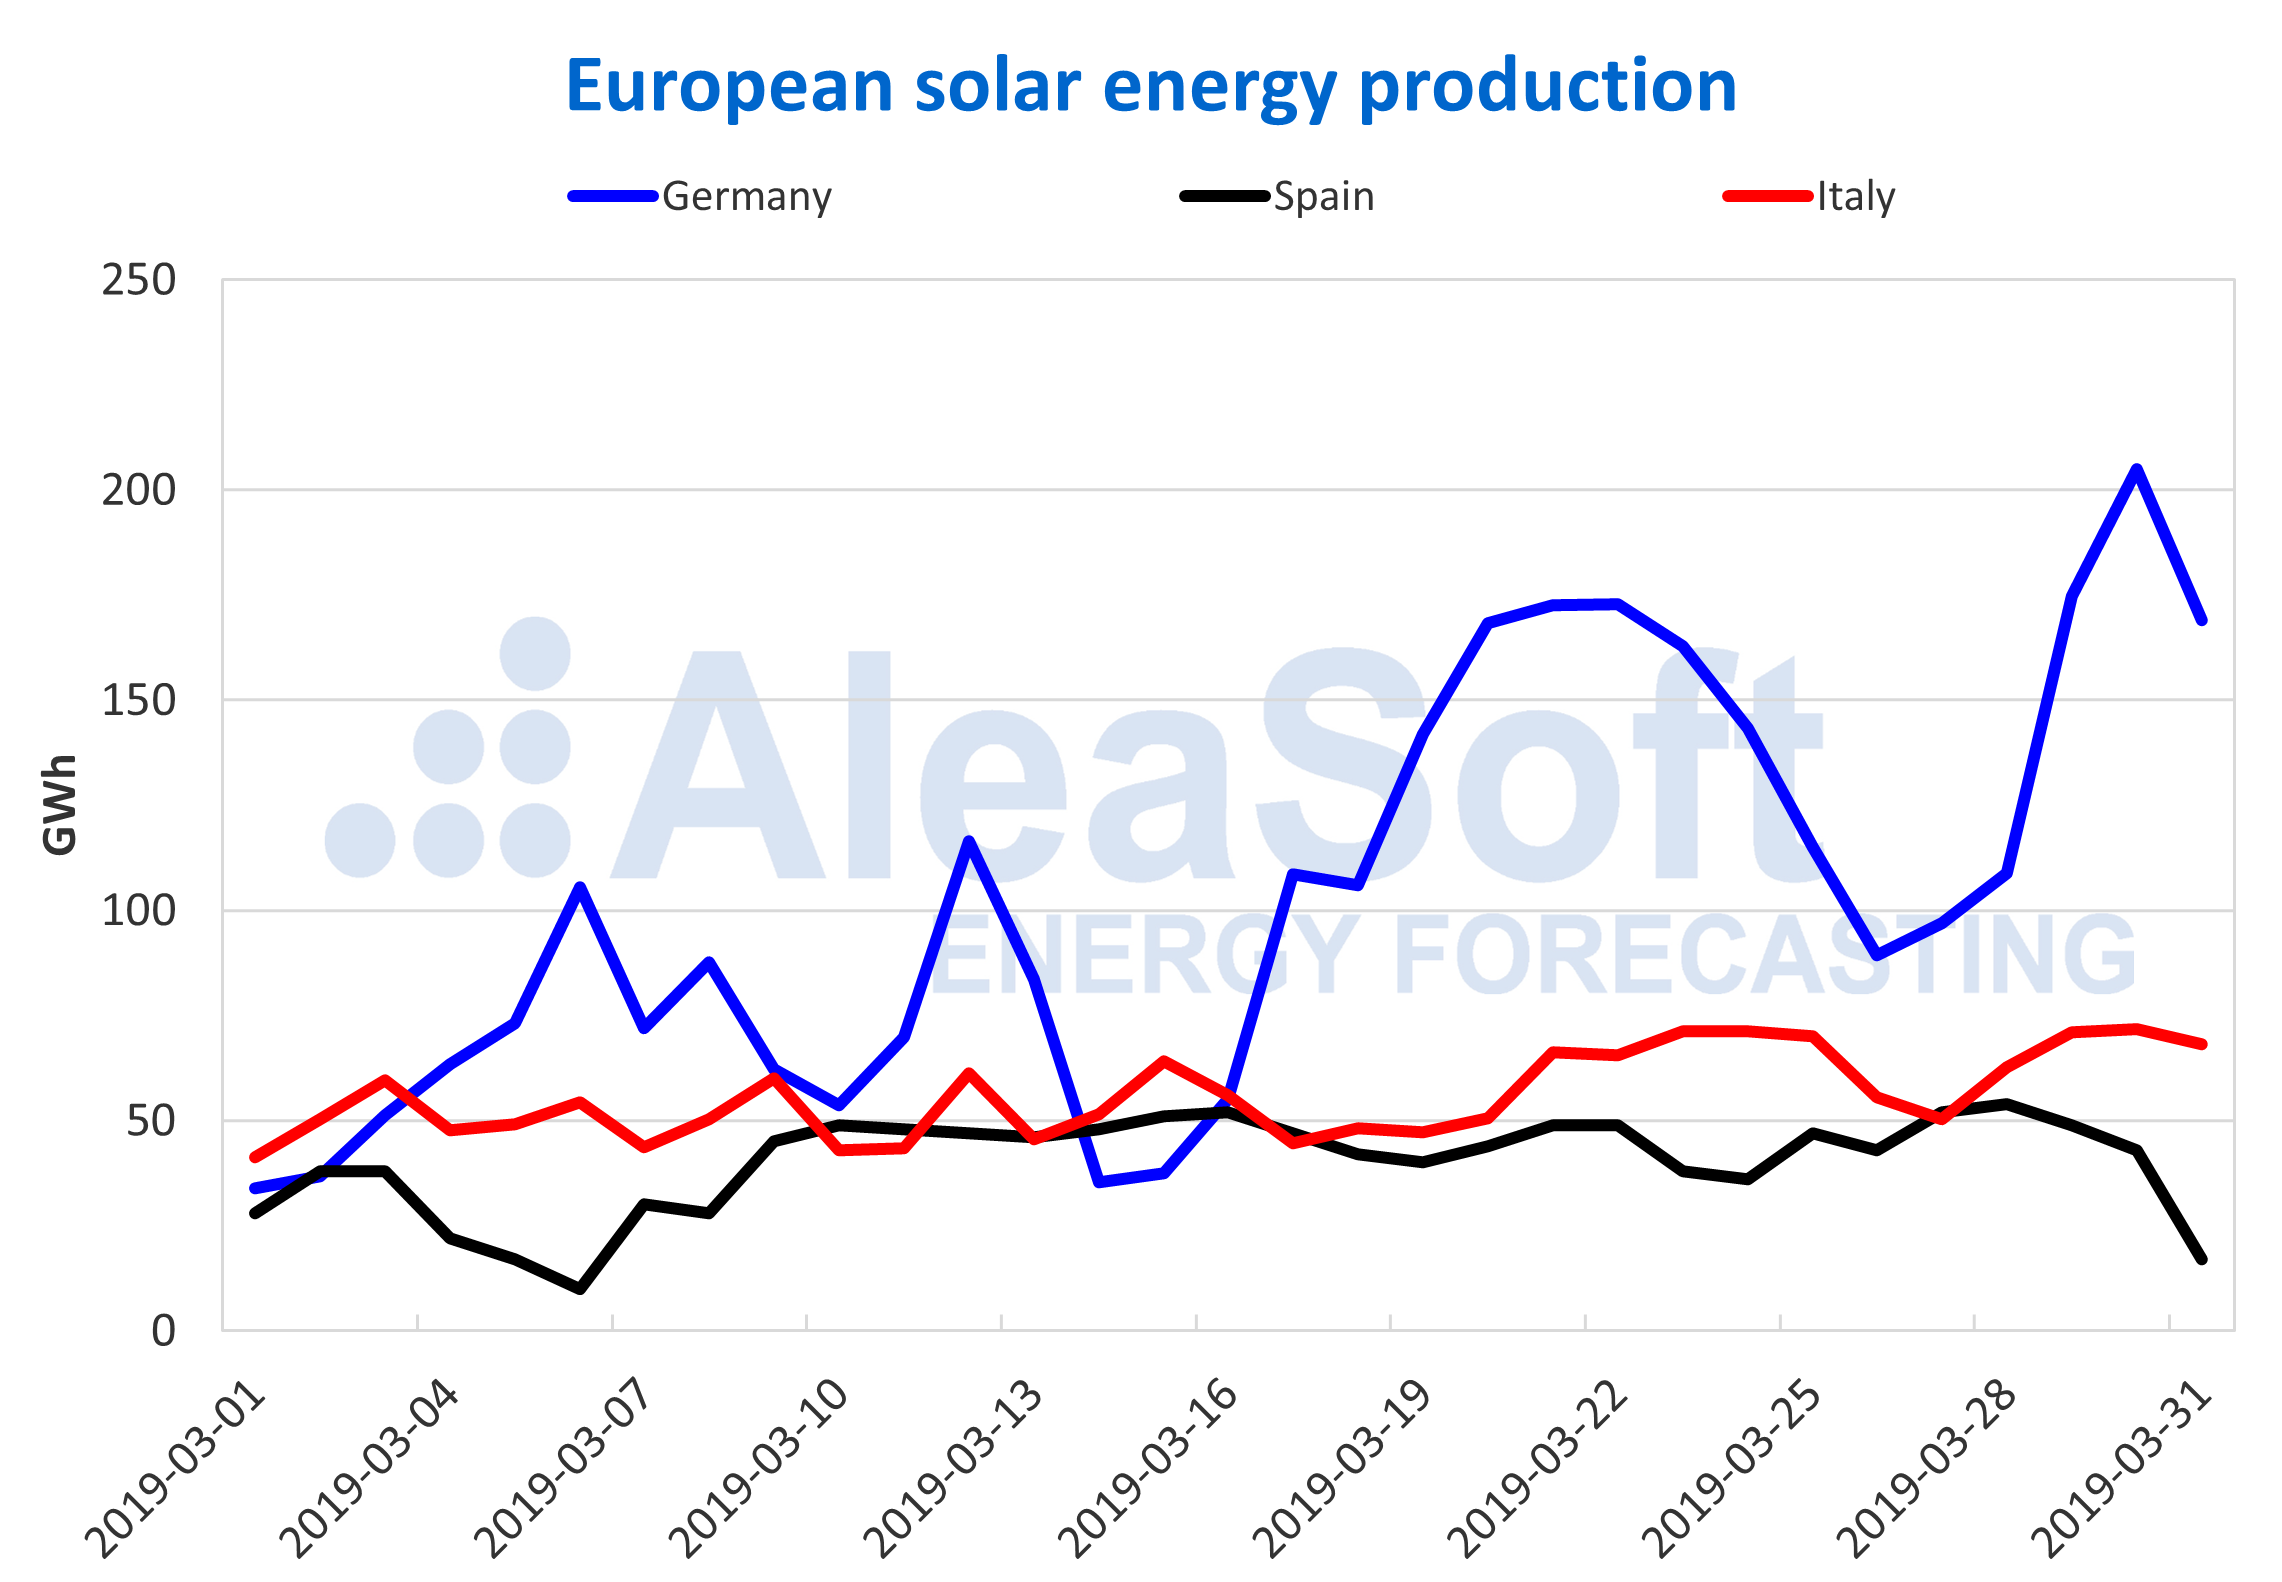
Sources: Prepared by AleaSoft with data from ENTSOE, REE and TERNA.
Source: AleaSoft Energy Forecasting