AleaSoft, June 1, 2020. In the month of May, the prices in most European electricity markets were higher than in April. However, all declined compared to May 2019. The electricity demand had a similar behaviour, with increases compared to April in most of the markets due to the advance of the de‑confinement, but lower than the same month of last year. The gas prices were at lows throughout the month. The wind and solar energy production as a whole rose compared to April and year‑on‑year.
Photovoltaic and solar thermal energy production and wind energy production
As a whole, the wind and solar renewable energy productions increased their contribution to the energy mix in some European markets last May compared to May 2019, mainly due to the growth in solar energy production. In France and Italy, the renewable energy production with these technologies covered a greater part of the demand than in May 2019, this time occupying 14% and 18% respectively. Germany and France registered segments above 30%, while in Spain it reached 22%.
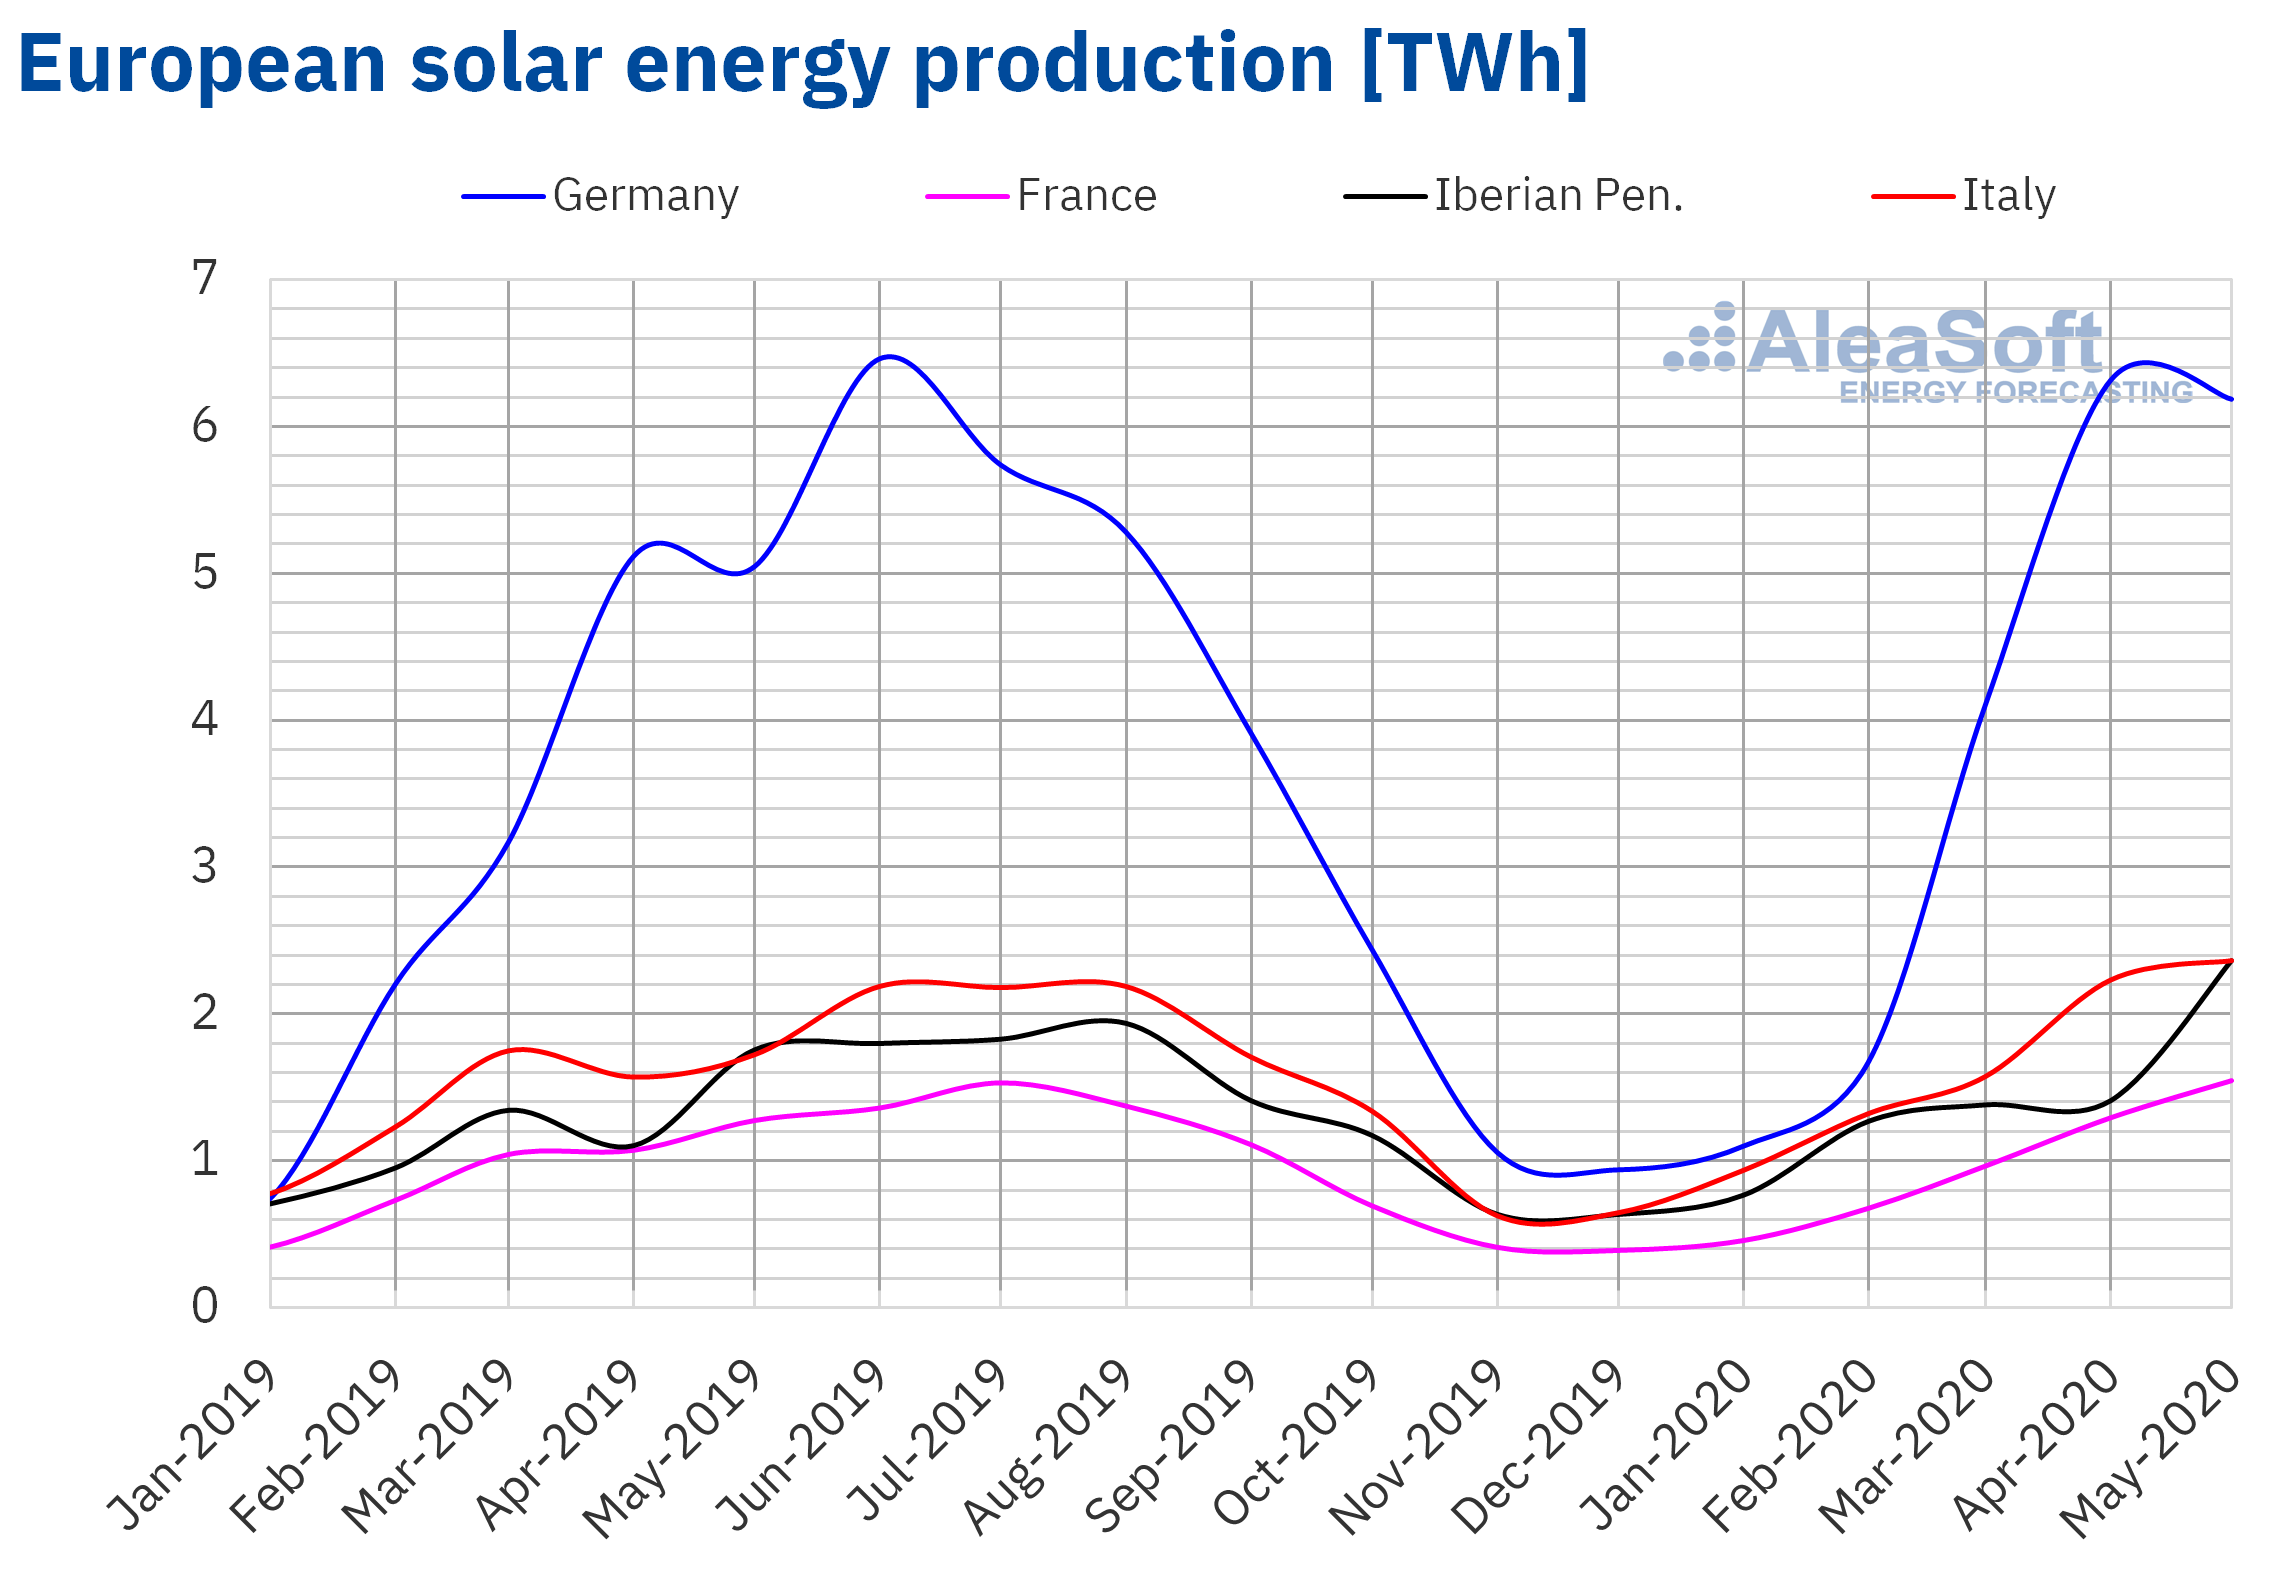
The solar energy production registered significant increases in most of the markets of Europe during the just ended month of May compared to the same month of 2019. In Spain and Italy the highest increases were reached, of 36% and 32% respectively. Similarly, in France and Germany the rises were 23% and 21% in that order. In Portugal there was an increase of 13%.
Compared to April of this year, the generation with solar technologies also increased in general, in correspondence with the increase in hours of sunlight. In Spain and Portugal there were increases of 58% and 34% respectively. Another market where the solar energy production increased was that of France, where there was an increase of 16%. However, the values in Germany and Italy lagged behind, declining 5.2% and 1.6% respectively.
 Source: Prepared by AleaSoft using data from ENTSO-E, RTE, REN, REE and TERNA.
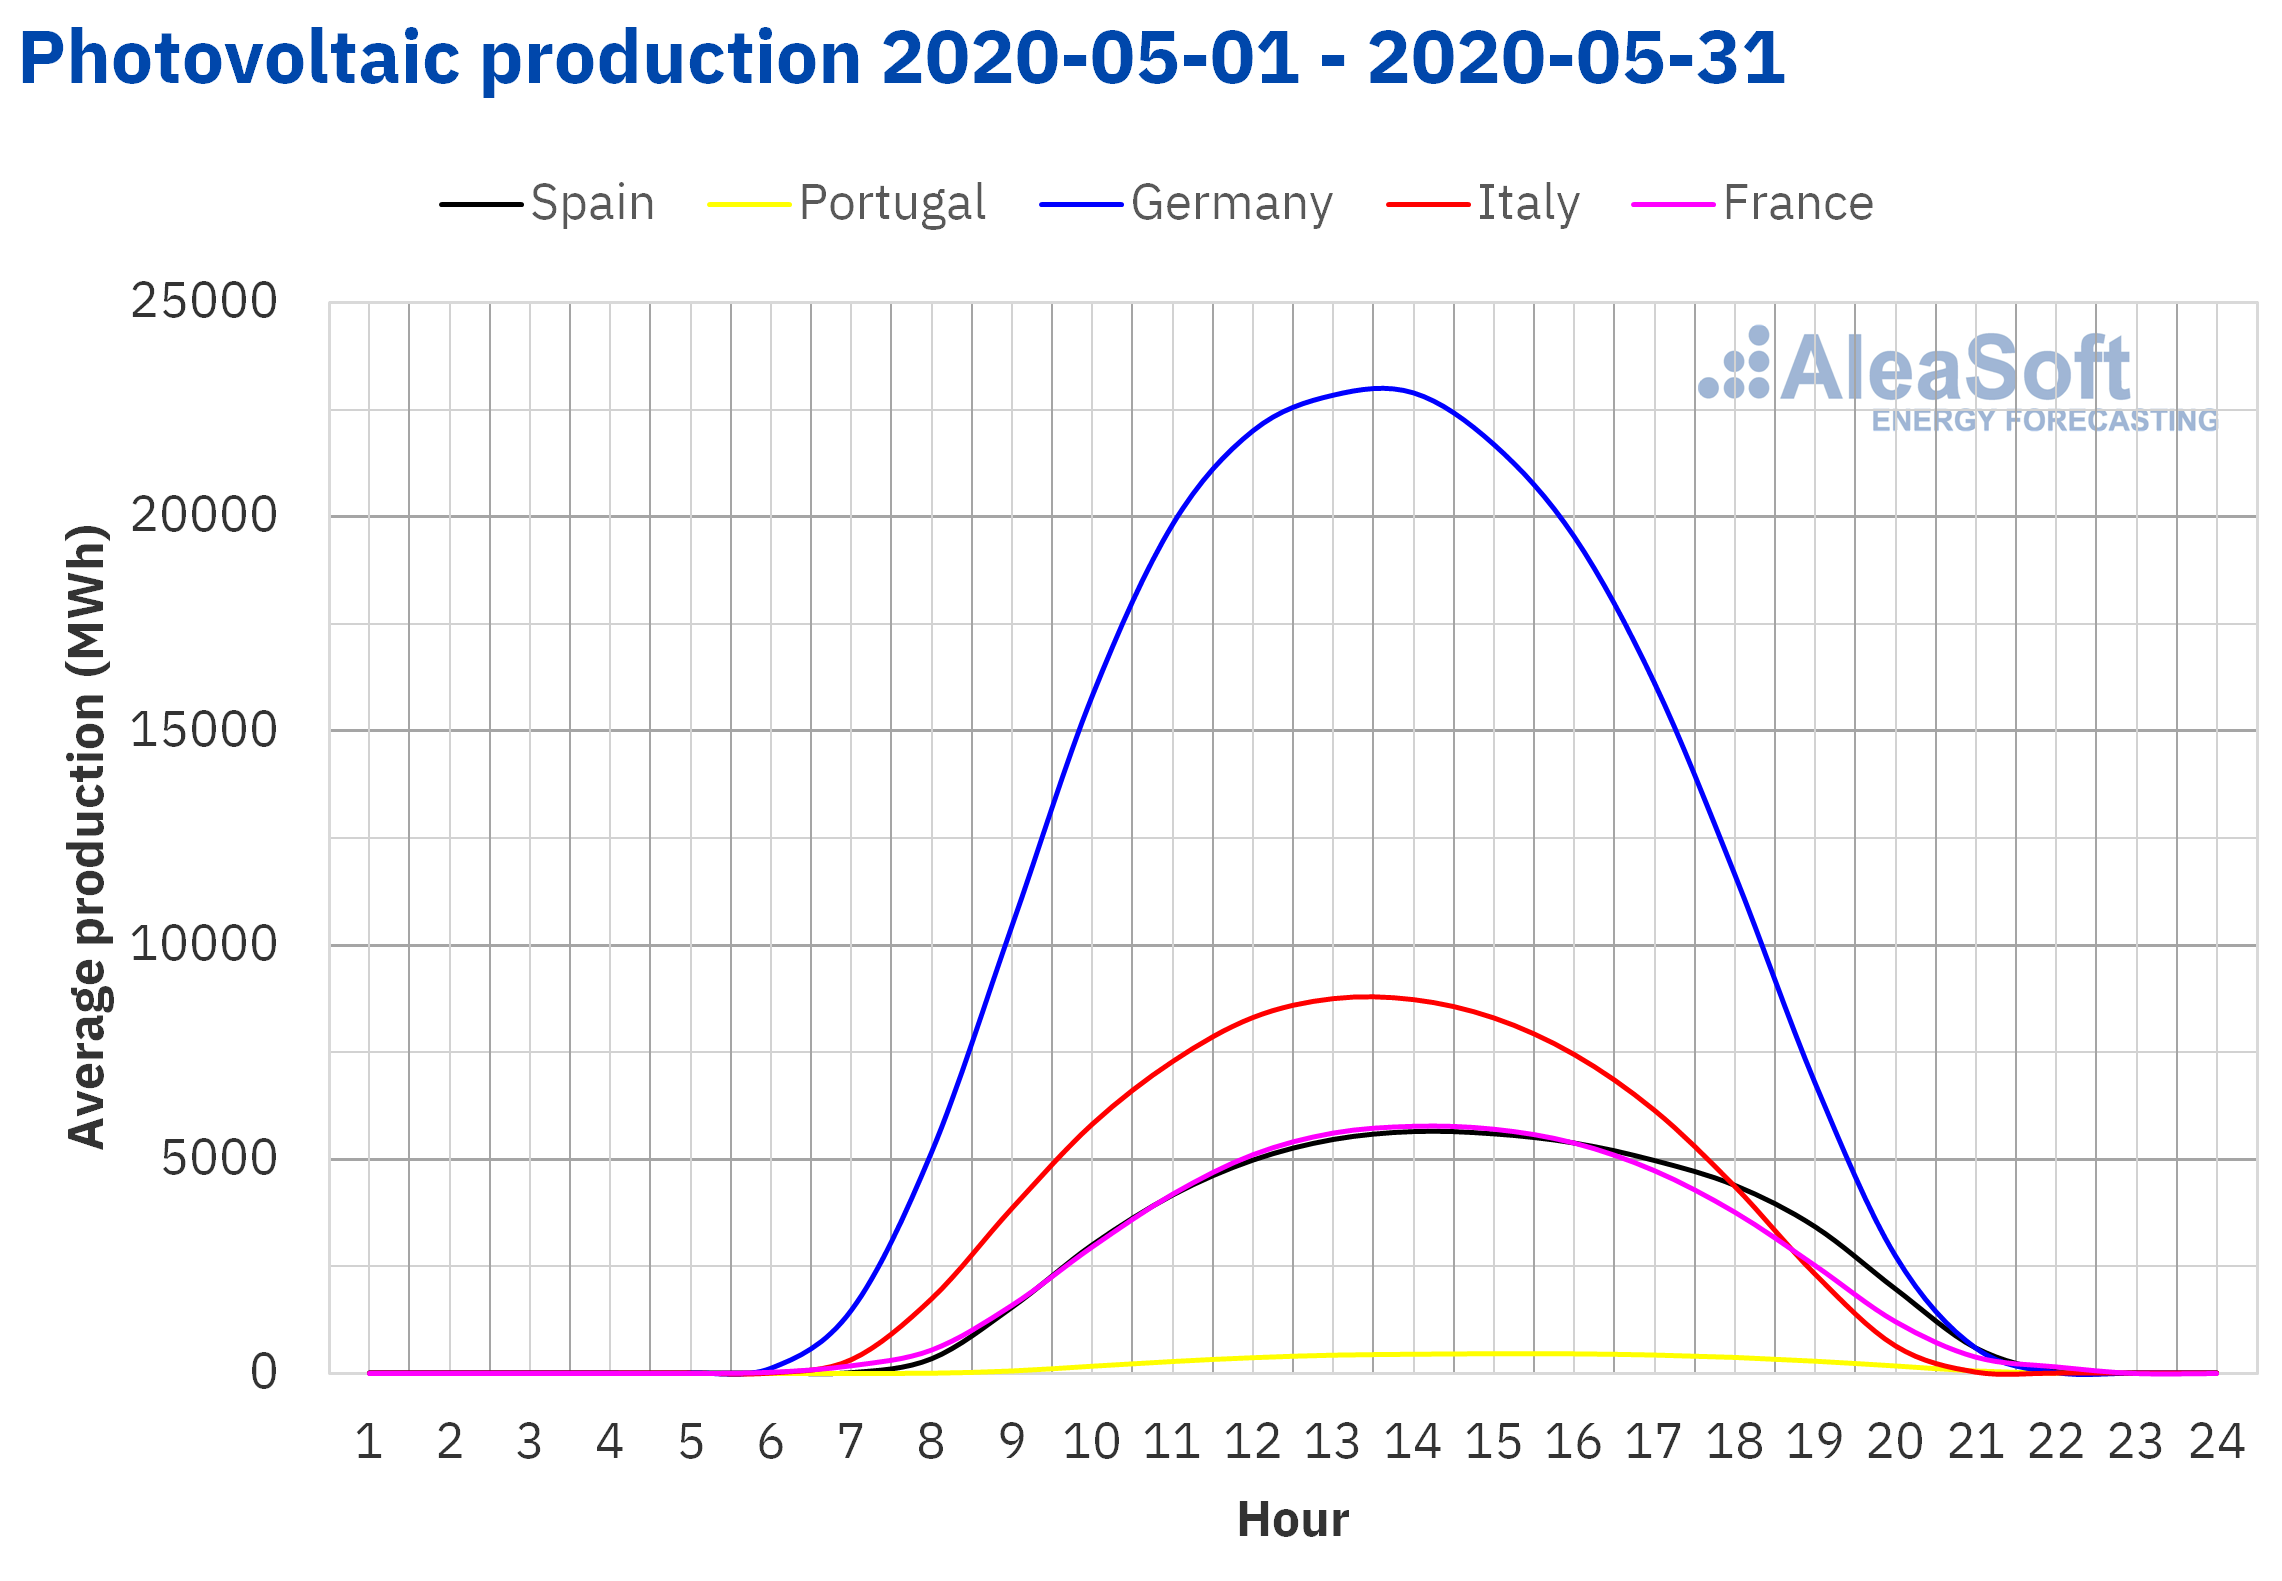 Source: Prepared by AleaSoft using data from ENTSO-E, RTE, REN, REE and TERNA.
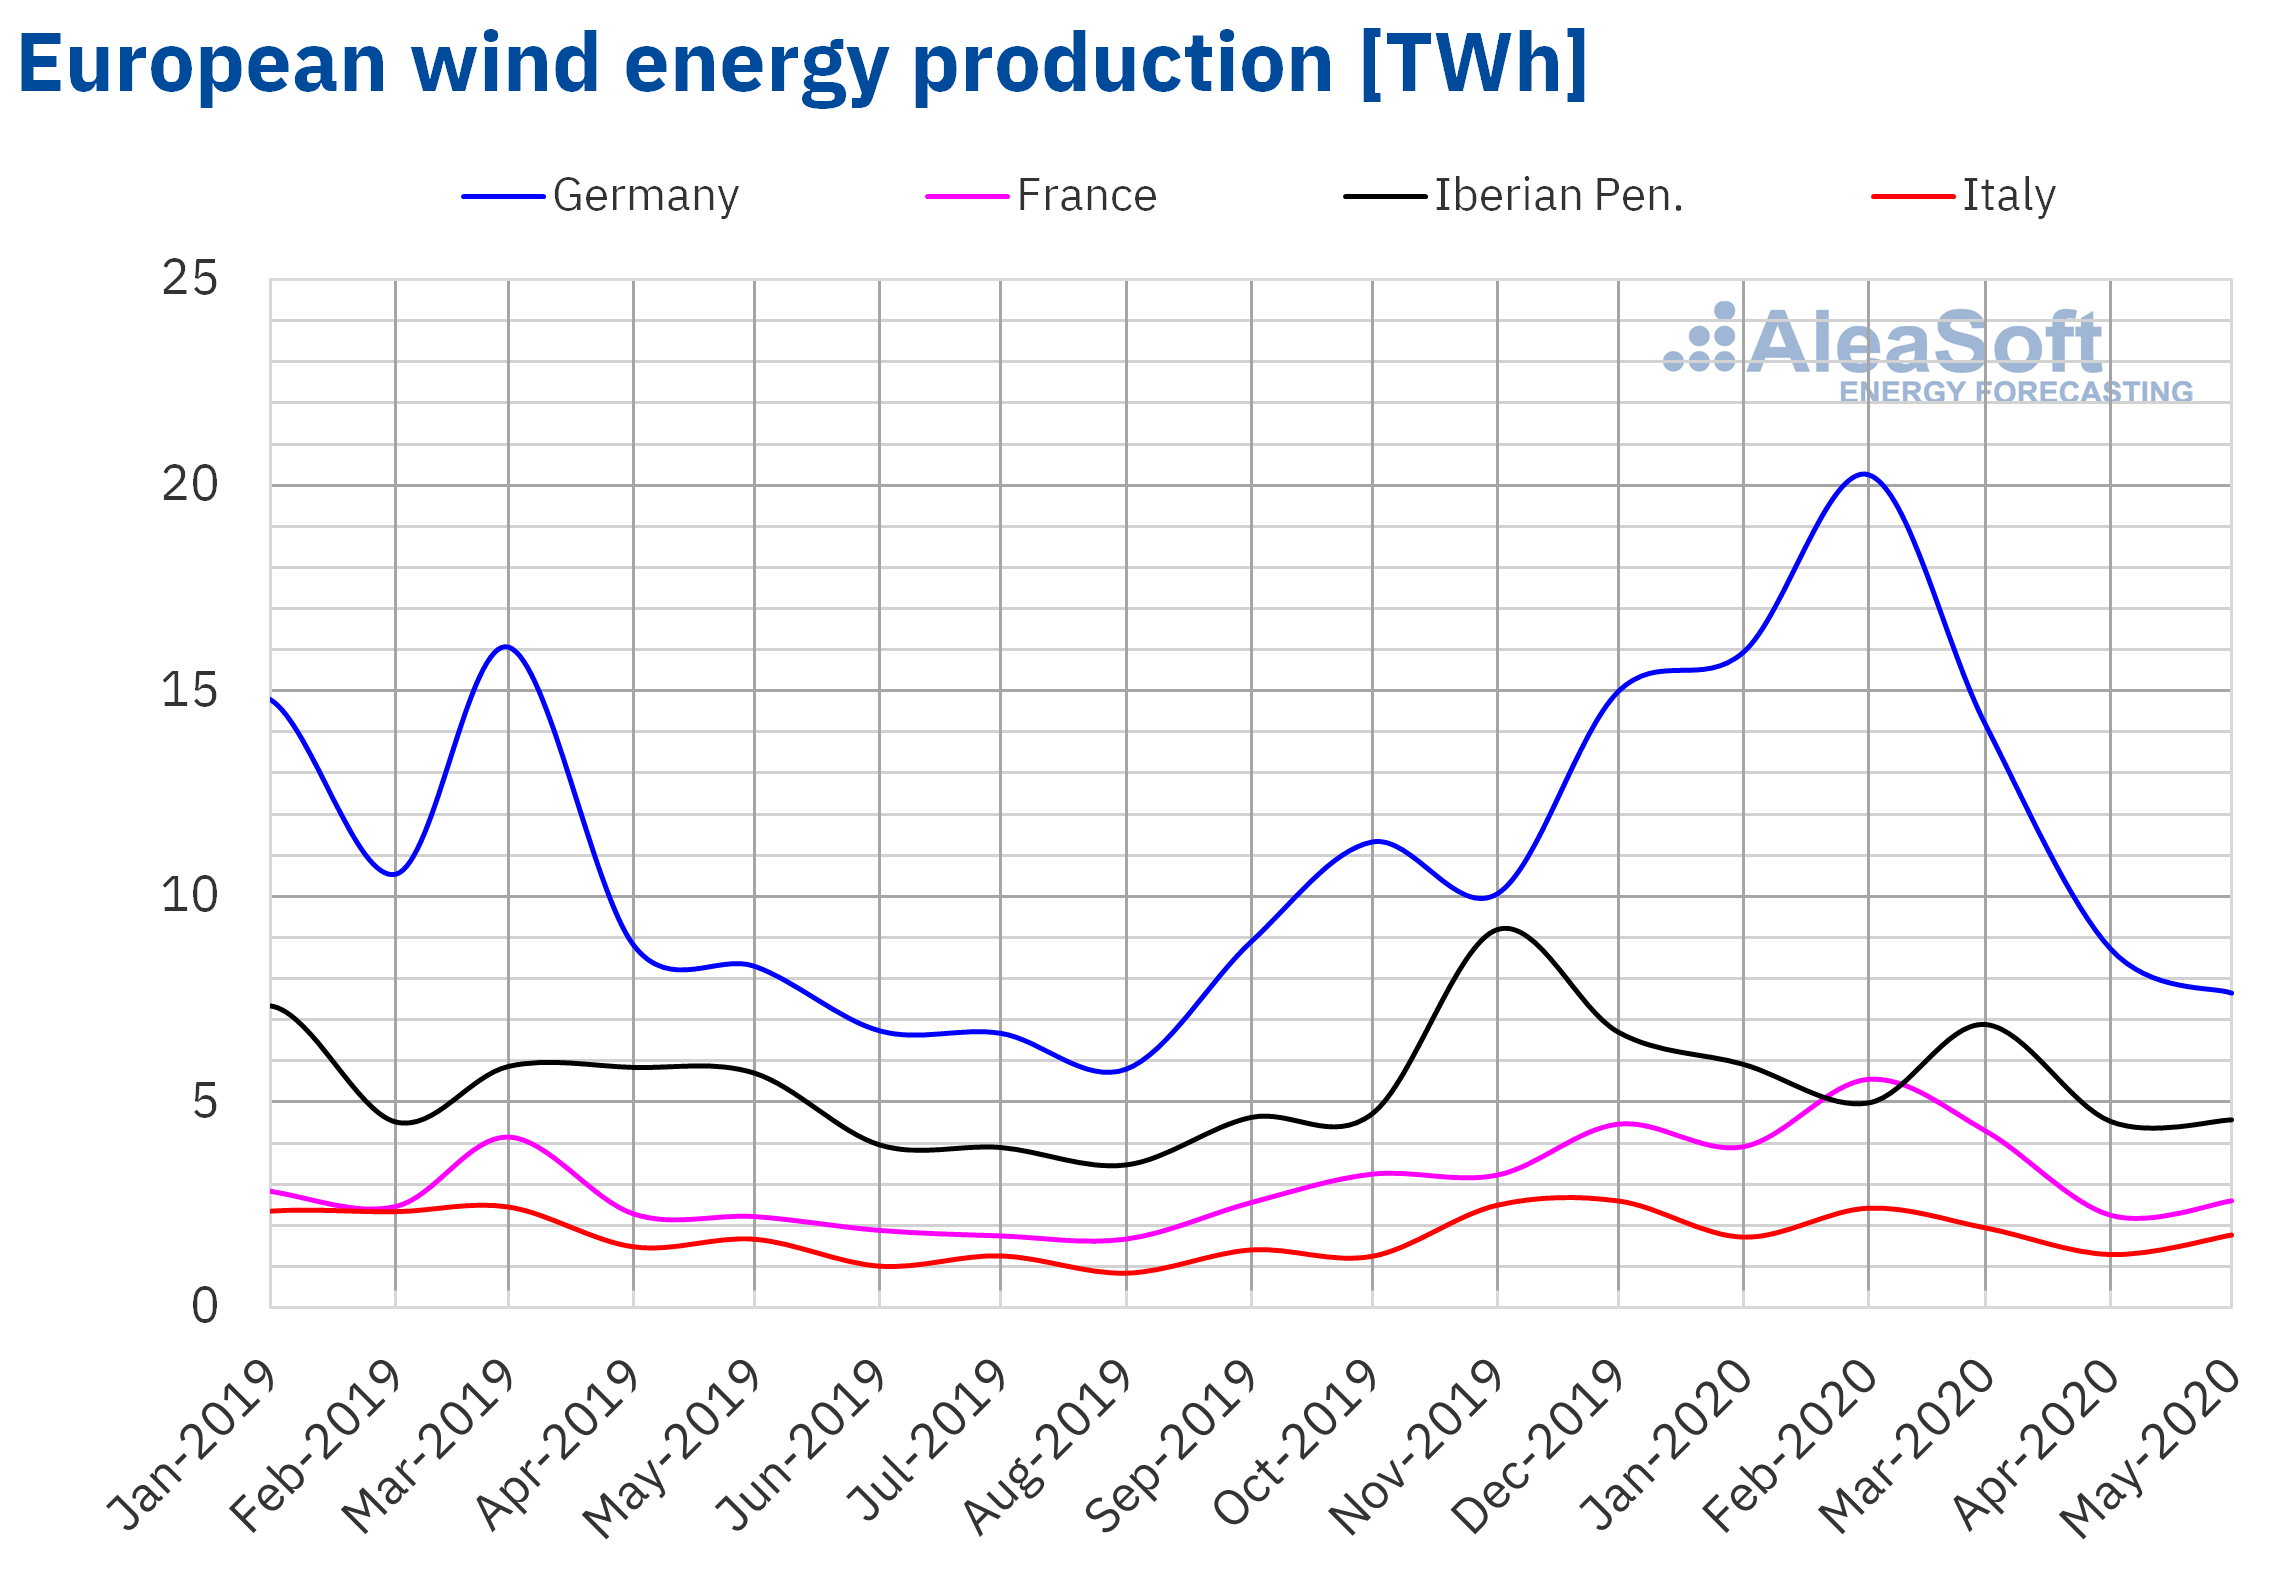
During the month of May, the wind energy production fell in most of the analysed electricity markets, in year‑on‑year terms. Particularly, the generation with wind energy in Germany was decreasing in the last two weeks of last month, registering a fall of 7.8% compared to May of 2019. In Portugal the decrease was a significant 41% and represented the fifth consecutive month with values lower than those of 2019. On the other hand, the drop in Spain reached a value of 15%. Some markets saw recoveries, as was the case of 17% in France, which performed above 2019 for the fourth time in the elapsed months of 2020. While in Italy there was an increase of 6.3%.
There were also some decreases compared to April 2020. Germany and Portugal also registered notable decreases in this section, with 15% and 26% respectively. Out of the markets where the wind energy production rose in May, 32% in Italy was the most prominent value. This result was followed by France and Spain with increases of 12% and 2.7% respectively.
 Source: Prepared by AleaSoft using data from ENTSO-E, RTE, REN, REE and TERNA.
Electricity demand
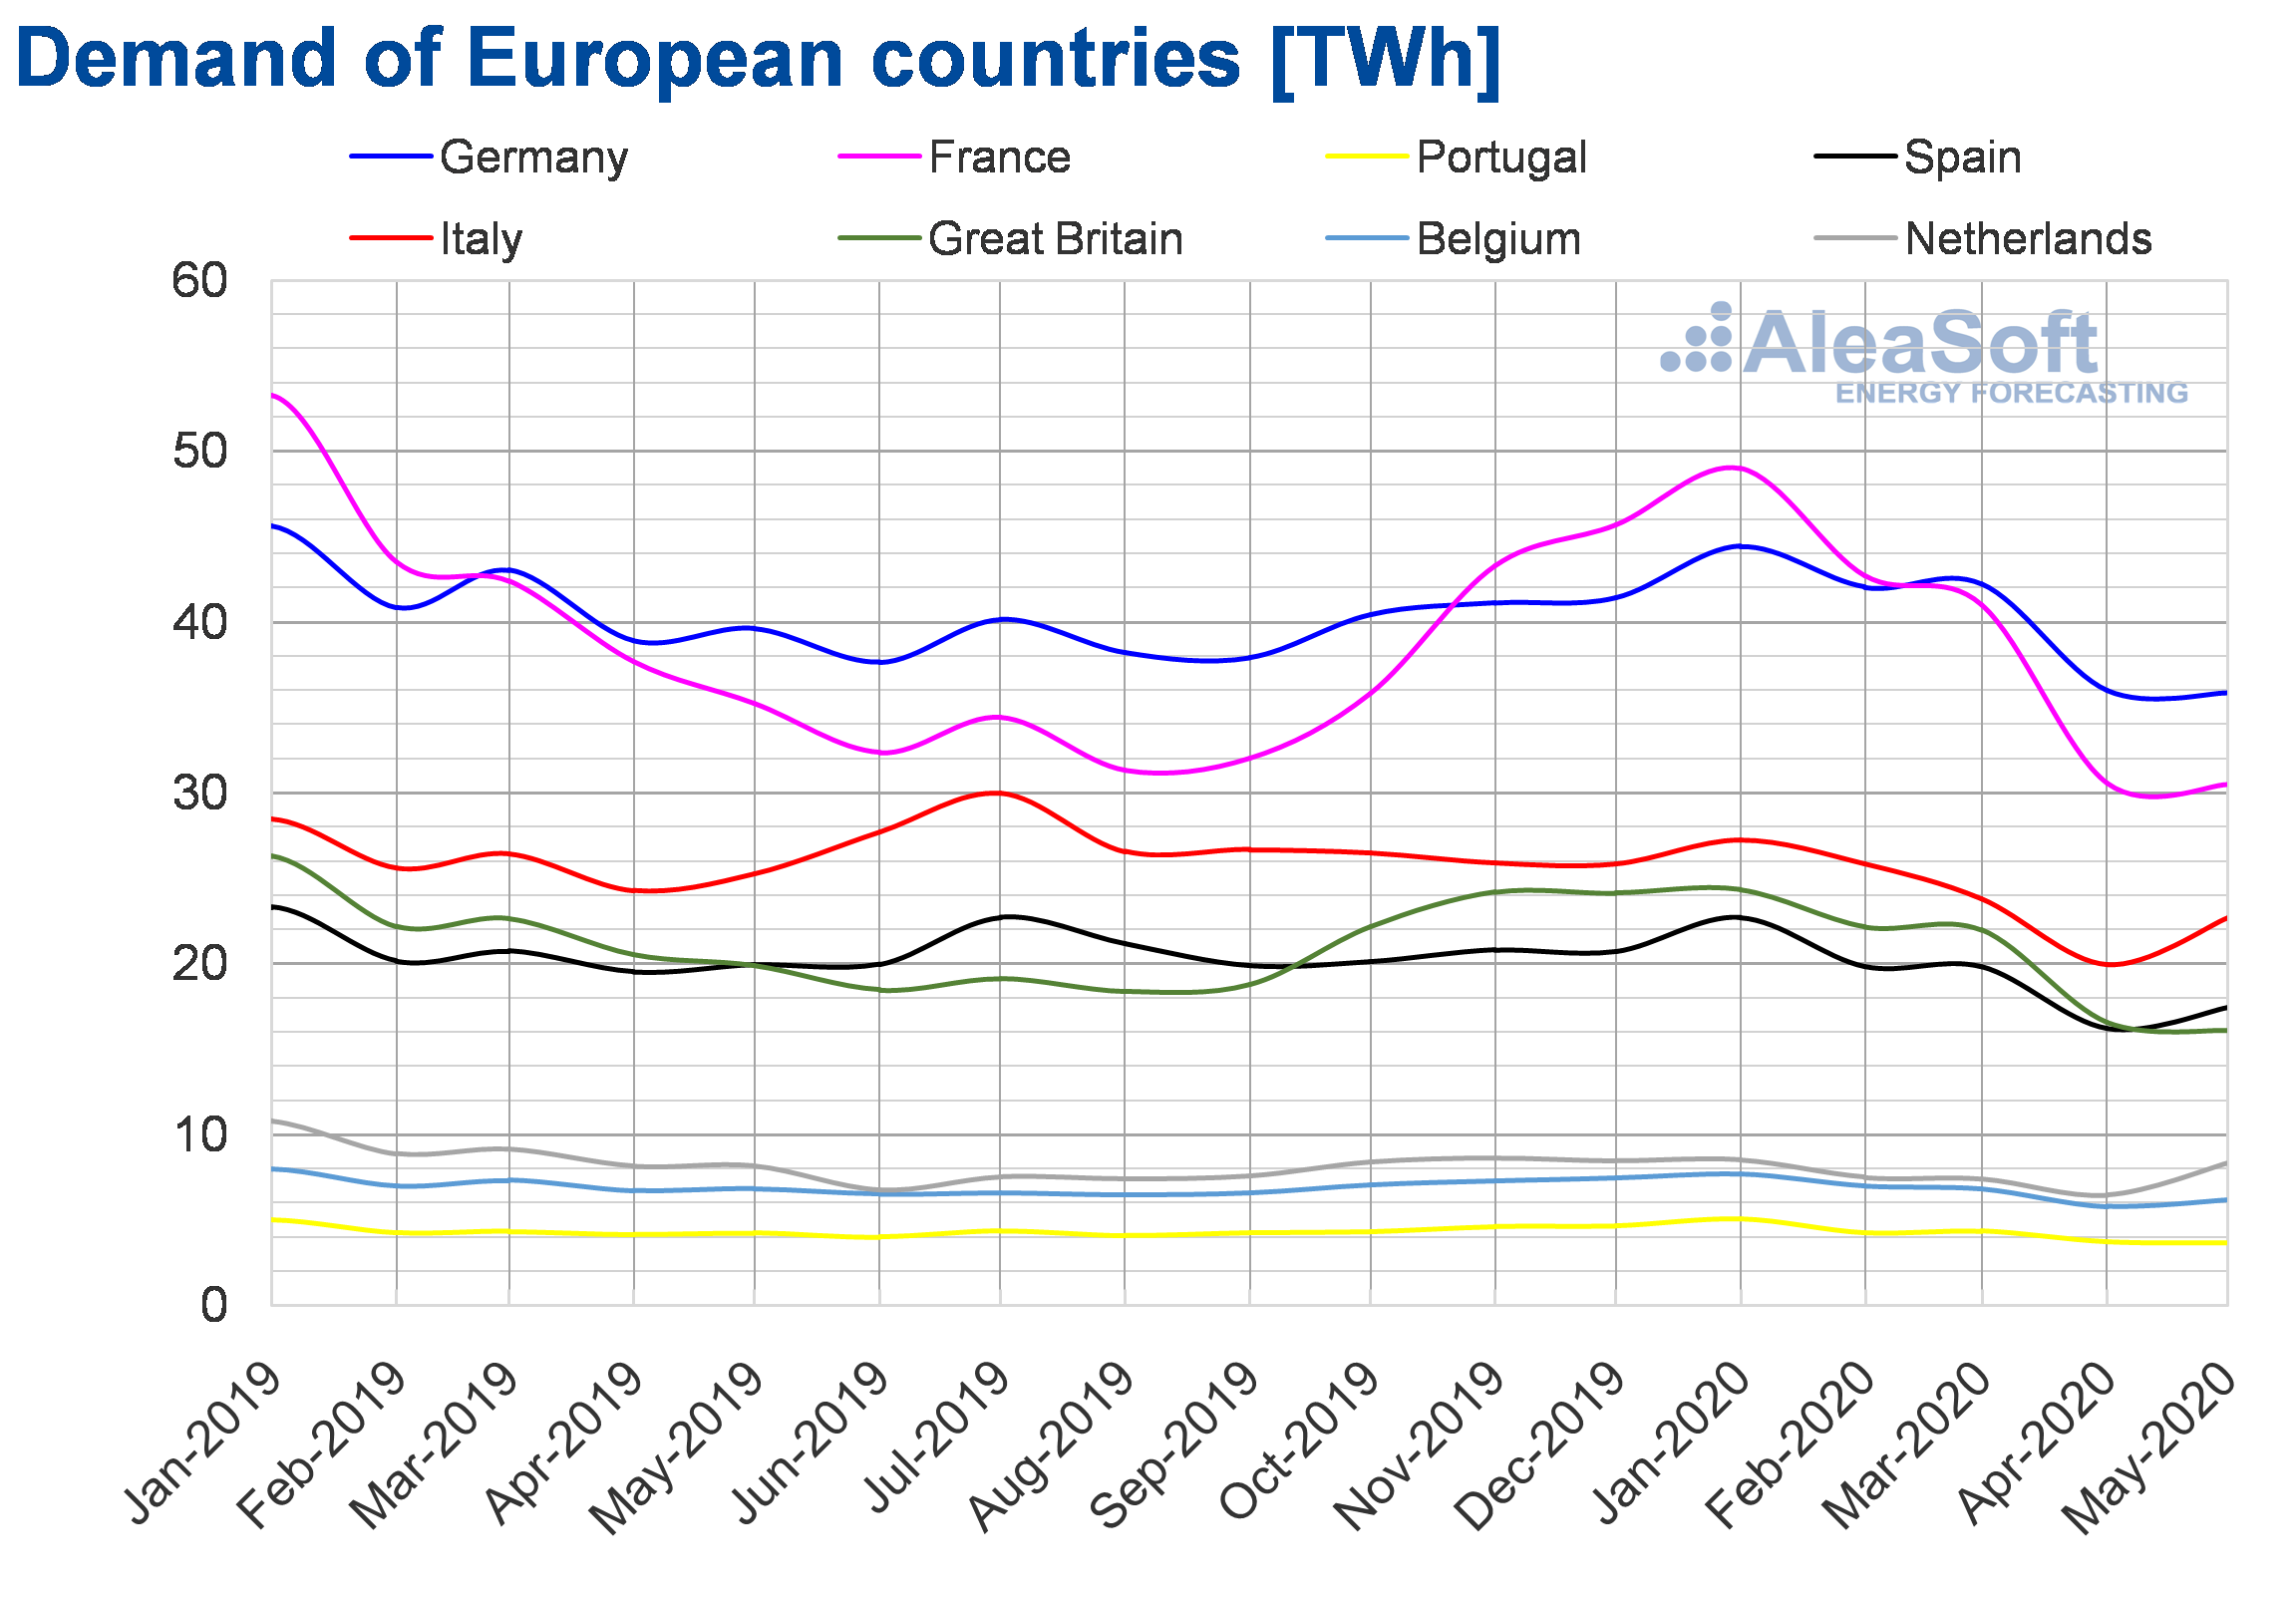
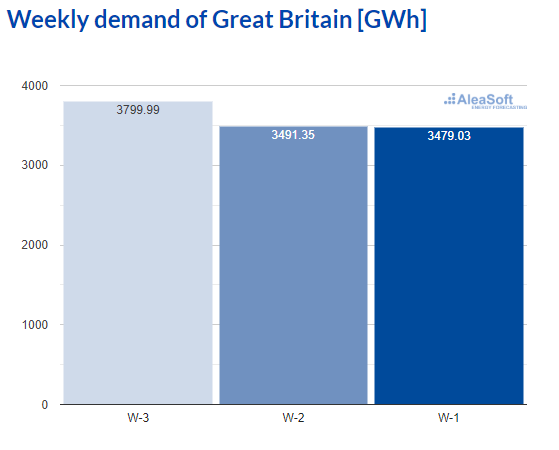
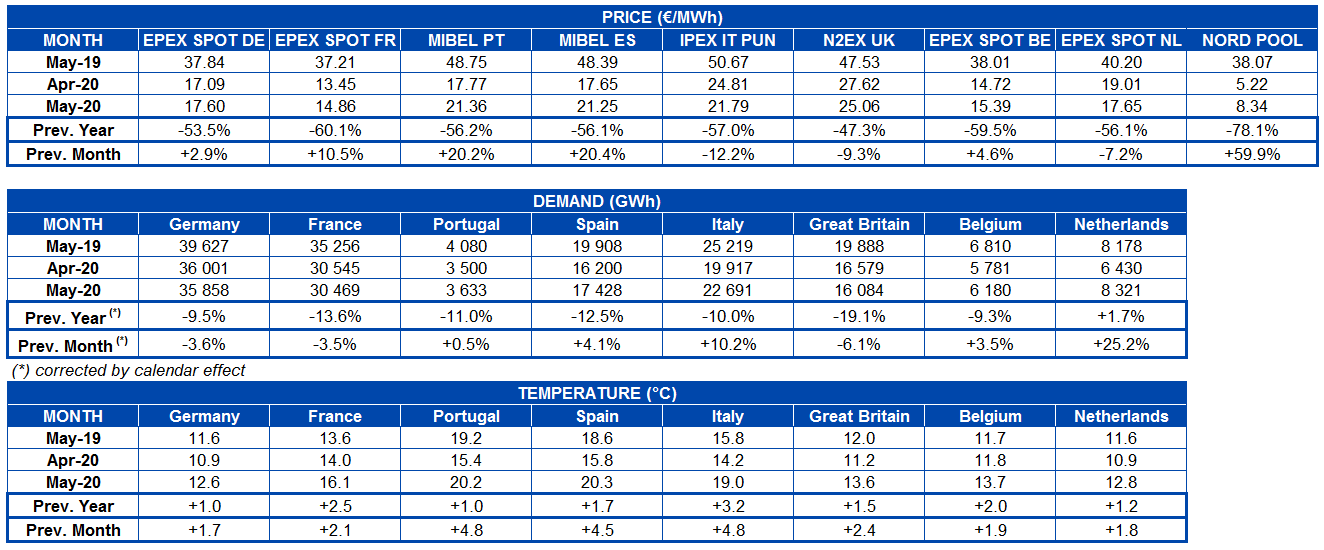
During the month of May, the European electricity demand continued its year‑on‑year drop in the vast majority of the electricity markets, where the effect of the confinement due to COVID‑19 was the main cause of these drops. The demand in Great Britain was the one with the highest year‑on‑year variation, with a decrease of 19% and a new historical low since April 2001 of 16 084 GWh. In the markets of Italy, Portugal and Spain the decreases in demand compared to May 2019 were between 10% and 12%. In the case of France and Germany, with falls of 14% and 9.5%, respectively, the demand continued at values close to those of August and September 2014, respectively. The Belgian market was the one with the lowest decline, of 9.3%. On the other hand, the demand in the market of the Netherlands was the only one that had a slight increase compared to May of last year, with a variation of 1.7%.
As for the comparison of the recently ended May with respect to April 2020, there was an increase in demand in most of the analysed European markets. This recovery was due to confinement de‑escalation measures that were being adopted in some of the European countries since the end of April and throughout May. In the Italian market, the demand increased by 10%. In the markets of Spain, Belgium and Portugal, the demand also recovered by 4.1%, 3.5% and 0.5% respectively. In contrast, in the markets of Great Britain, Germany and France the demand continued to decline. The British market was the one with the greatest decrease in demand, with a 6.1% drop, while in the German and the French the variations in demand were very similar, of ‑3.6% and ‑3.5% respectively.
 Source: Prepared by AleaSoft using data from ENTSO-E, RTE, REN, REE, TERNA, National Grid and ELIA.
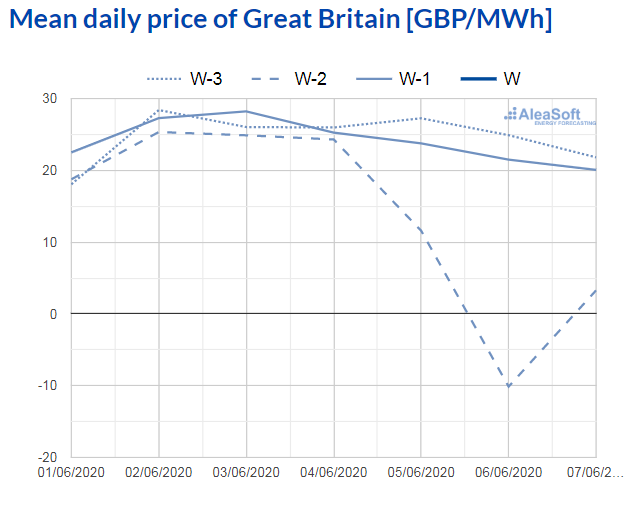
At the AleaSoft’s observatories it is possible to analyse the evolution of the demand in European electricity markets in recent weeks with daily updated data.
 Source: Prepared by AleaSoft using data from National Grid of Great Britain.
 European electricity markets
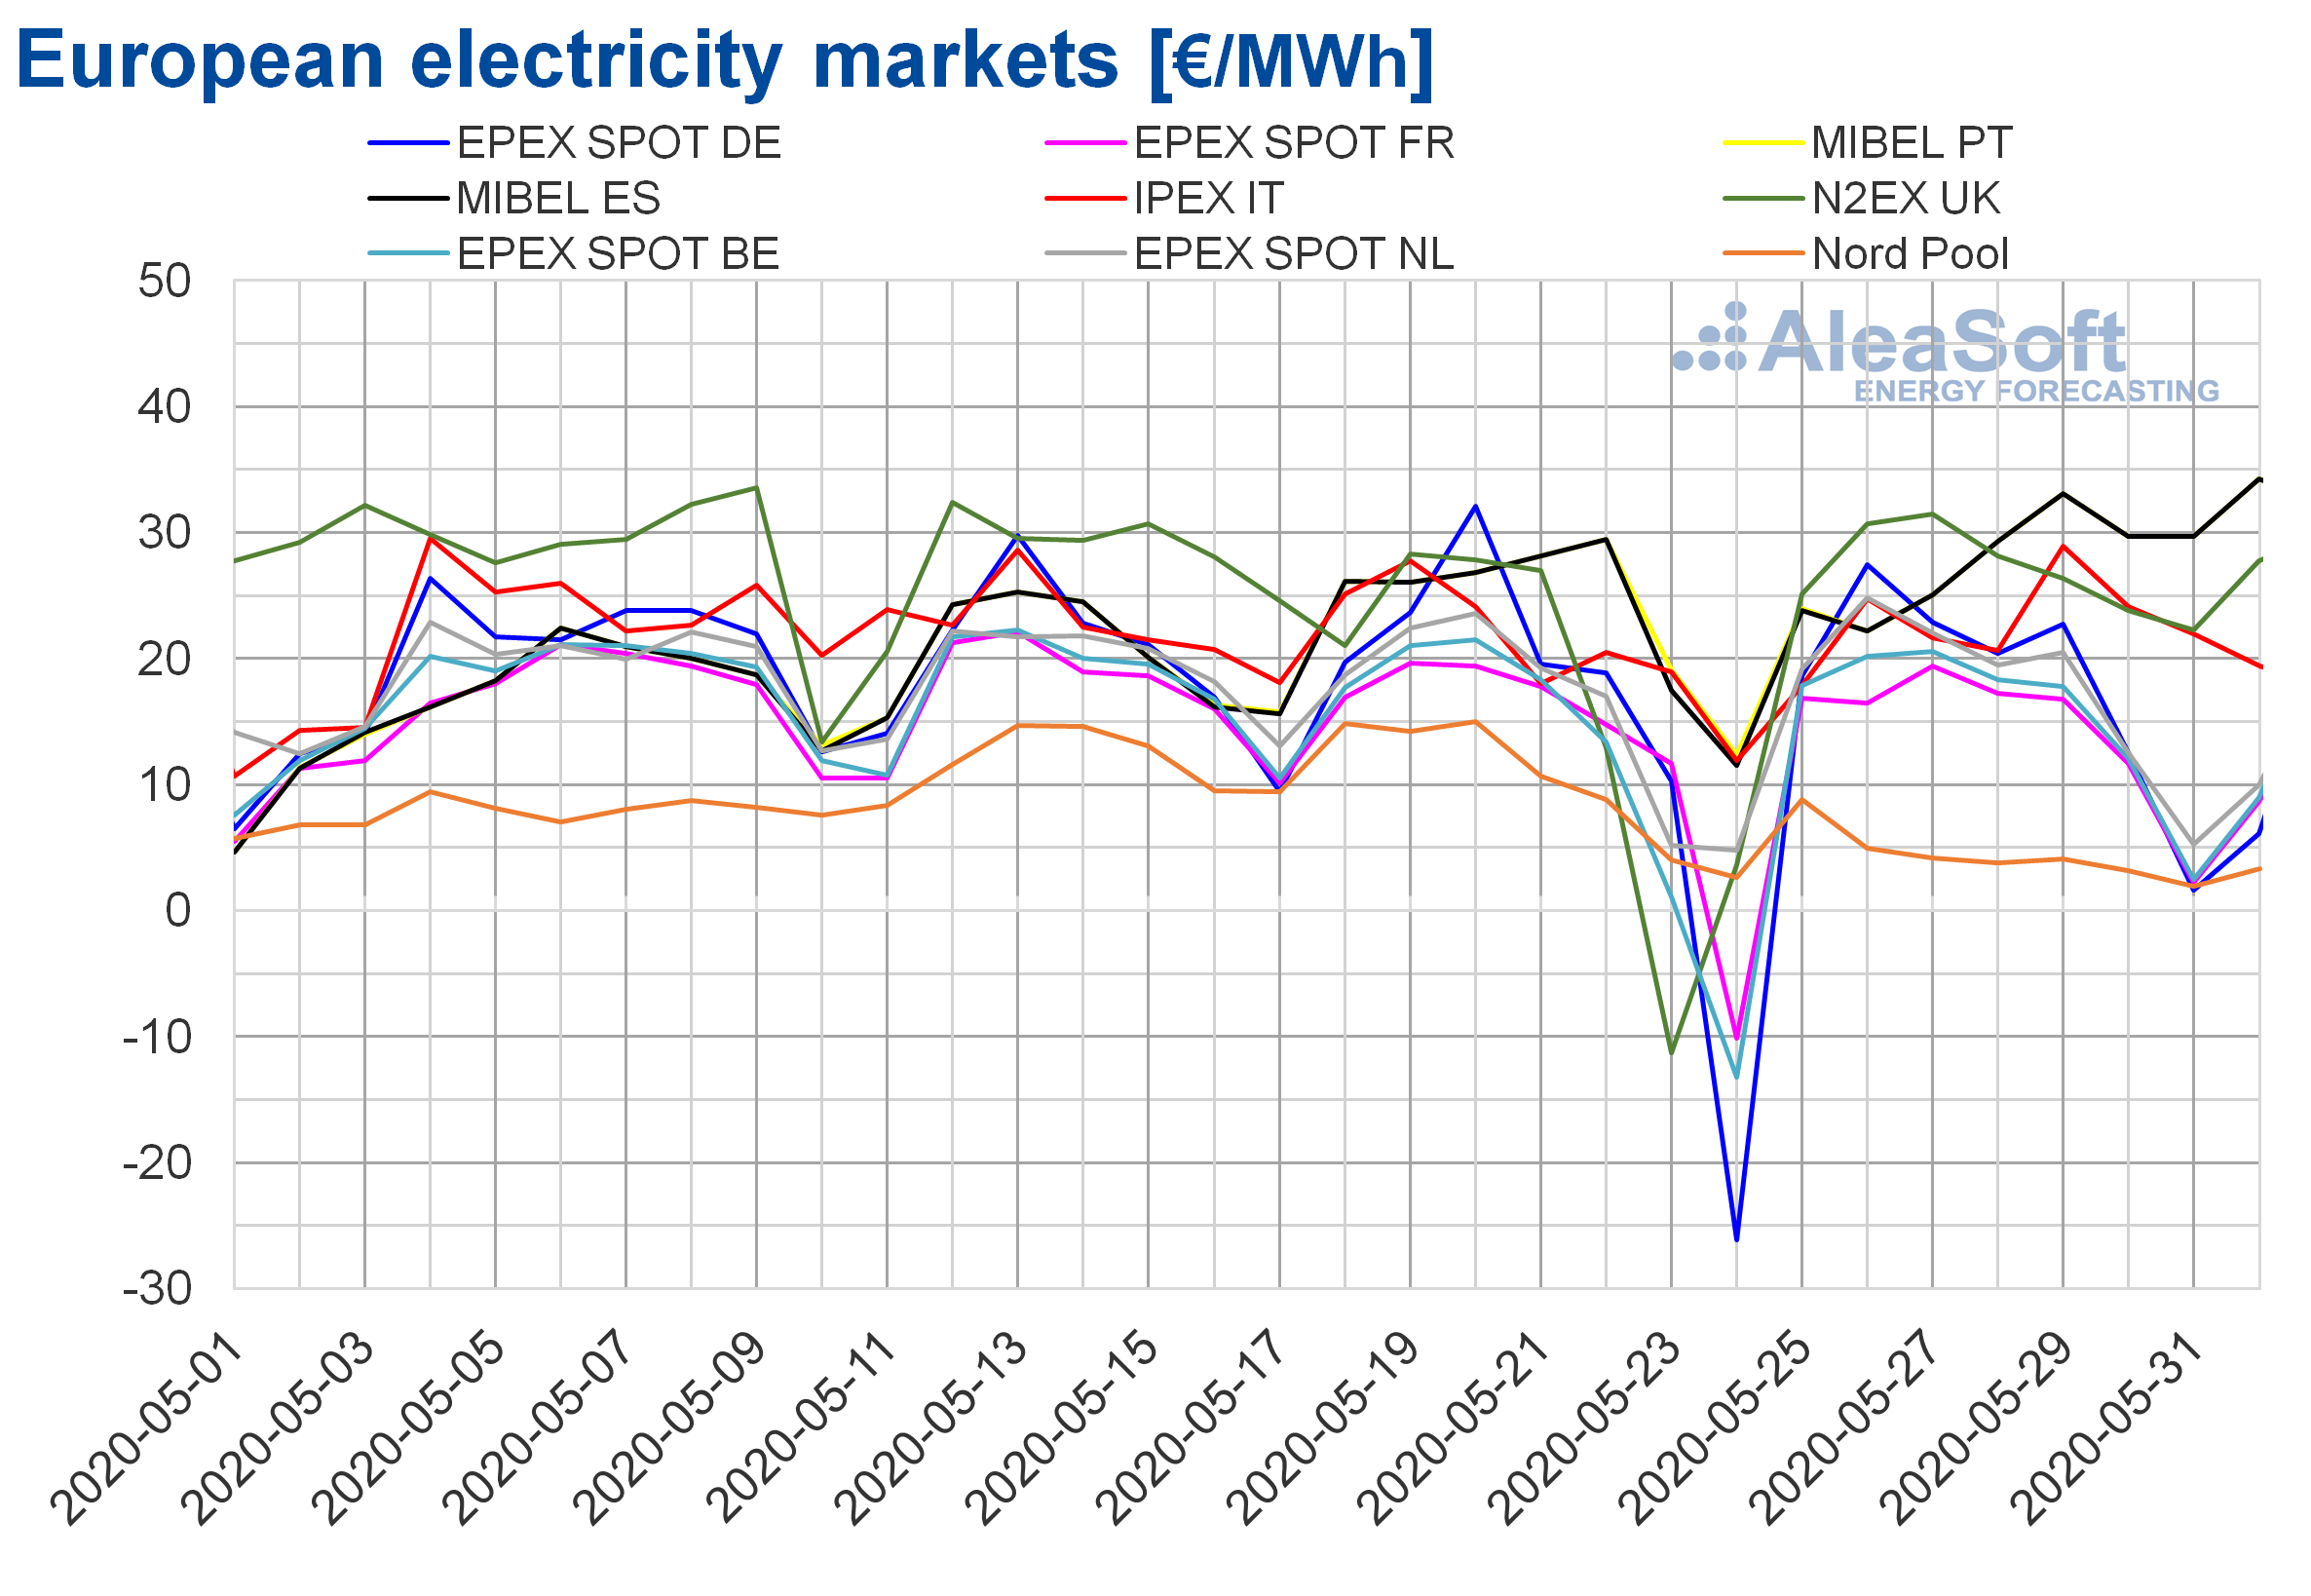
In May 2020, the monthly average price continued to be lower than €30/MWh in all the analysed European markets. The Nord Pool market of the Nordic countries registered the lowest average, of €8.34/MWh. Meanwhile, the market with the highest average, of €25.06/MWh, was the British N2EX.
Compared to April, the average prices of most of the European electricity markets analysed at AleaSoft increased. The exceptions were the IPEX market of Italy, the N2EX market of Great Britain and the EPEX SPOT market of the Netherlands, with declines of 12%, 9.3% and 7.2% respectively. Regarding the increases in the other analysed markets, the highest price increase, of 60%, was registered in the Nord Pool market. While the smallest increase, of 2.9%, was that of the EPEX SPOT market of Germany. In the rest of the markets, the increases were between 4.6% of the EPEX SPOT market of Belgium and 20% of the MIBEL market of Spain and Portugal.
Despite the fact that the gas and coal prices were 31% and 5.4% lower than those of April, respectively, in the month of May the renewable energy production decreased in Germany and the nuclear energy production decreased compared to the previous month in countries such as Germany, France or Spain, which allowed the recovery of the prices in most of the European electricity markets. Furthermore, in some countries the electricity demand increased due to the start of the de‑escalation of the confinement measures.
If the average prices of the past month of May are compared with those registered in the same month of 2019, there were significant decreases in all markets. The maximum decrease, of 78%, occurred in the Nord Pool market and the smallest, of 47%, in the N2EX market. In the rest of the markets, the price decreases were between 53% of the EPEX SPOT market of Germany and 60% of the EPEX SPOT market of France. The reasons for these price decreases are, on the one hand, the confinement measures to combat the COVID‑19 and higher temperatures than those of the same month of last year that caused a decrease in demand in most European electricity markets compared to that of May 2019. On the other hand, the gas, coal and CO2 prices were 66%, 29% and 22% lower than in May of the previous year, respectively, and the renewable energy production increased in countries like France and Italy.
On the other hand, during the month of May, negative hourly prices were registered in some European electricity markets. The N2EX market of Great Britain and the EPEX SPOT market of France and Belgium had negative hourly prices on May 11. On the 17th, the negative prices occurred in the EPEX SPOT market of Germany, Austria, Belgium, France and Switzerland and in the market of Denmark, which belongs to the Nord Pool. On Friday, May 22, the markets with negative hourly prices were the EPEX SPOT of Belgium and the N2EX of Great Britain. On Saturday, May 23, there were negative hourly prices in the markets of Germany, Belgium, Great Britain, Denmark, the Netherlands and Switzerland. On Sunday, the 24th, the French market was added to these markets. Finally, yesterday, May 31, the markets that presented negative hourly prices were those of Germany, Belgium, Denmark, France, the Netherlands and Switzerland.
 Source: Prepared by AleaSoft using data from OMIE, , N2EX, IPEX and Nord Pool.
However, there were negative daily prices only on May 23 and 24. On Saturday, May 23, the only one of the analysed electricity markets that presented a negative daily price, of ‑€11.31/MWh, was the British one. This was the first time that a negative daily price was reached in this market since January 1, 2010.
In contrast, on Sunday, May 24, the markets of Germany, Austria, Belgium, Denmark, France and Switzerland reached negative daily average prices. The lowest daily price was that of the German market, of ‑€26.13/MWh, which was the lowest registered in this market since June 2019.
 Source: Prepared by AleaSoft using data from N2EX
Iberian market
In May 2020, the average price in the MIBEL market of Spain and Portugal increased by 20% compared to the average of the previous month, which represented the second largest price increase in Europe after that registered in the Nord Pool market. In contrast, the prices decreased by 56% compared to May 2019.
The monthly average price of May was €21.25/MWh in the Spanish market and €21.36/MWh in the Portuguese market. Thus, in May, the Portuguese and the Spanish markets had the third and the fourth highest average prices, respectively, of those registered in the analysed European markets, after the British and the Italian markets.
In the MIBEL market, the deconfinement process allowed the demand to increase compared to April, especially in Spain, although it still remains below that of the same month of the previous year. In addition, the wind energy production decreased in the Iberian Peninsula in May. As a consequence, the prices started to recover compared to those of the previous month.
Electricity futures
The settlement prices of the electricity futures for the third quarter of 2020 of last Friday, May 29, were lower in most of the markets analysed at AleaSoft compared to the settlement prices of May 4. The exceptions were the ICE and NASDAQ markets of the Nordic countries, which rose by 5.3% and 4.0% respectively, although they continue to have the lowest prices of all European markets. The greatest variation was ‑11% and was registered in the EEX market of Italy. The rest of the markets ended the month with a decrease in prices of between 2.6% and 5.8% compared to May 4.
In the case of the electricity futures for the next year 2021, the behaviour of the markets was mostly upward during this period in the analysed markets. The only markets that registered a reduction in prices were those of the Iberian Peninsula that ended the period between €0.4/MWh and €0.5/MWh below the settlement price of May 4. The rest of the analysed markets registered increases of between 7.3% and 1.8%.

Brent, fuels and CO2
The Brent oil futures prices for July in the ICE market began last month registering the minimum monthly price, of $26.44/bbl, on May 1. During the month, the prices recovered until reaching a maximum price of $36.17/bbl on May 26. On the other hand, the monthly average price was $32.41/bbl. This value is 17% higher than that reached by the futures for the month M+2 in April 2020, of $27.71/bbl, but still 54% lower than that corresponding to the M+2 futures traded in May of 2019, of $70.30/bbl.
The production cuts agreed by OPEC+ began in May. In addition, in some countries, the confinement measures to curb the coronavirus pandemic began to relax, allowing the demand to begin to increase. This favoured the recovery of the prices with respect to the historical lows of April. However, the demand was still low in the month of May and the reserves remained at high levels. In addition, after reaching the monthly maximum price, on May 27 the price fell as a result of the news that Russia was considering the possibility of reducing the production cuts from July and on the intention of the US government to impose new sanctions to China in the case of reducing Hong Kong’s autonomy.
In June, the Brent oil futures prices are expected to be influenced, mainly, by the meeting that the OPEC+ holds in the second week of the month. The development of the conflict between China and the United States, as well as the internal instabilities in these two countries can also exert their influence on the prices.
The TTF gas futures in the ICE market for the month of June 2020 reached their monthly maximum price of €5.85/MWh on May 7 and the monthly minimum of €3.51/MWh on May 28, which was the lowest in the last two years. The average value registered during the month was €4.96/MWh. Compared to the futures for the month M+1 traded in the month of April 2020, this decreased by 27%. Compared to M+1 futures traded in May 2019, when the average price was €13.24/MWh, the decrease was 63%.
In the case of the spot market, last month the TTF gas prices reached their maximum index price of €5.68/MWh on May 1. The monthly minimum index price, of €2.76/MWh, was registered on May 23, 24 and 25 and was the lowest index price since October 2008. On the other hand, the average price for this month of May was €4.51/MWh, 31% lower than that of April 2020, of €6.57/MWh, and 67% lower than that of May 2019, of €13.57/MWh.
The API 2 coal futures in the ICE market for the month of June 2020, last month, registered the monthly maximum price of $43.15/t on May 6 and on May 21 the monthly minimum of $41.40/t was reached. The monthly average price in May was $42.02/t, 5.4% lower than the average price of the API 2 coal futures for the month M+1 of April 2020, of $44.43/t, and 29% lower than that of May 2019, of $59.05/t.
The CO2 emission rights futures in the EEX market for the reference contract of December 2020 on May 12 registered the monthly minimum price of €18.52/t. In contrast, the last month’s maximum price, of €21.60/t, was reached on May 26. The average price in May was €20.10/t, just 0.05% higher than that of April, of €20.09/t. When compared to the average of May 2019 for the same product, of €25.84/t, the average of May 2020 is 22% lower.
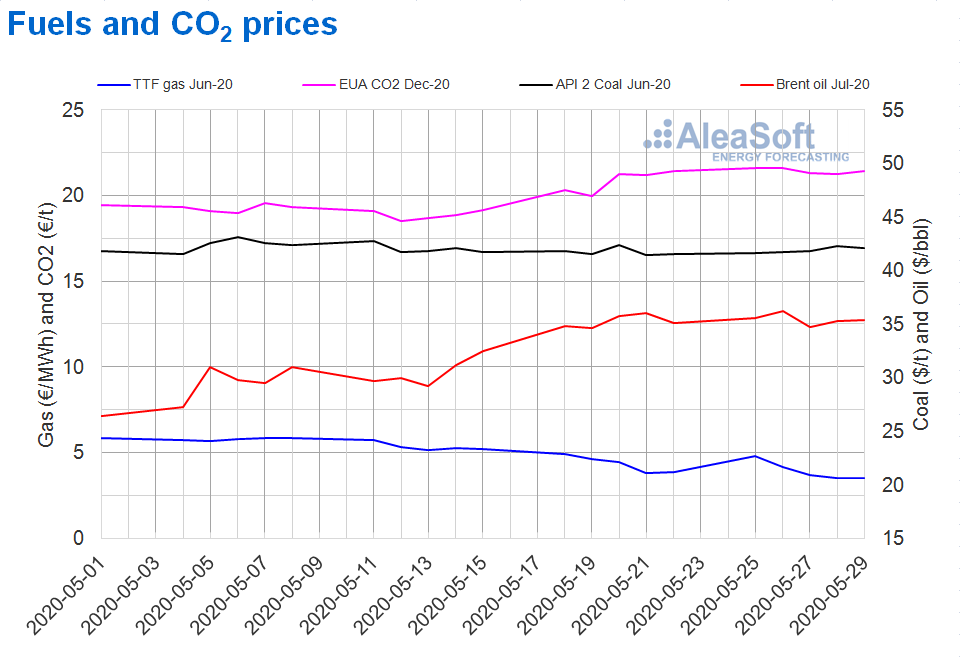 Source: Prepared by AleaSoft using data from ICE and EEX.
AleaSoft analysis on the effects on the electricity markets due to the coronavirus crisis
At the AleaSoft’s energy markets observatory, it is possible to see how the electricity demand is gradually recovering in the different European markets as the measures taken to curb the spread of COVID‑19 are being relaxed. The evolution of the prices and other variables of the energy markets can also be analysed.
The evolution of the European energy markets will also be analysed by Oriol Saltò i Bauzà, Manager of Data Analysis and Modelling of AleaSoft, during the webinar “Influence of coronavirus on electricity demand and the European electricity markets (III)” which will be held on June 25. In addition, the topic of the financing of the renewable energy projects will be addressed, this time with Pablo Otin, CEO & co‑founder at Powertis, as speaker.
Source: AleaSoft Energy Forecasting.