AleaSoft, August 5, 2019. In July there was a general year-on-year increase in wind energy production in Europe, which led to the decrease of the electricity market prices in the continent. This decrease also contributed to a 40% year-on-year decrease in the gas price and a 70% increase in the CO2 emissions price, which caused coal energy production to be reduced to a minimum.
Brent, fuels and CO2
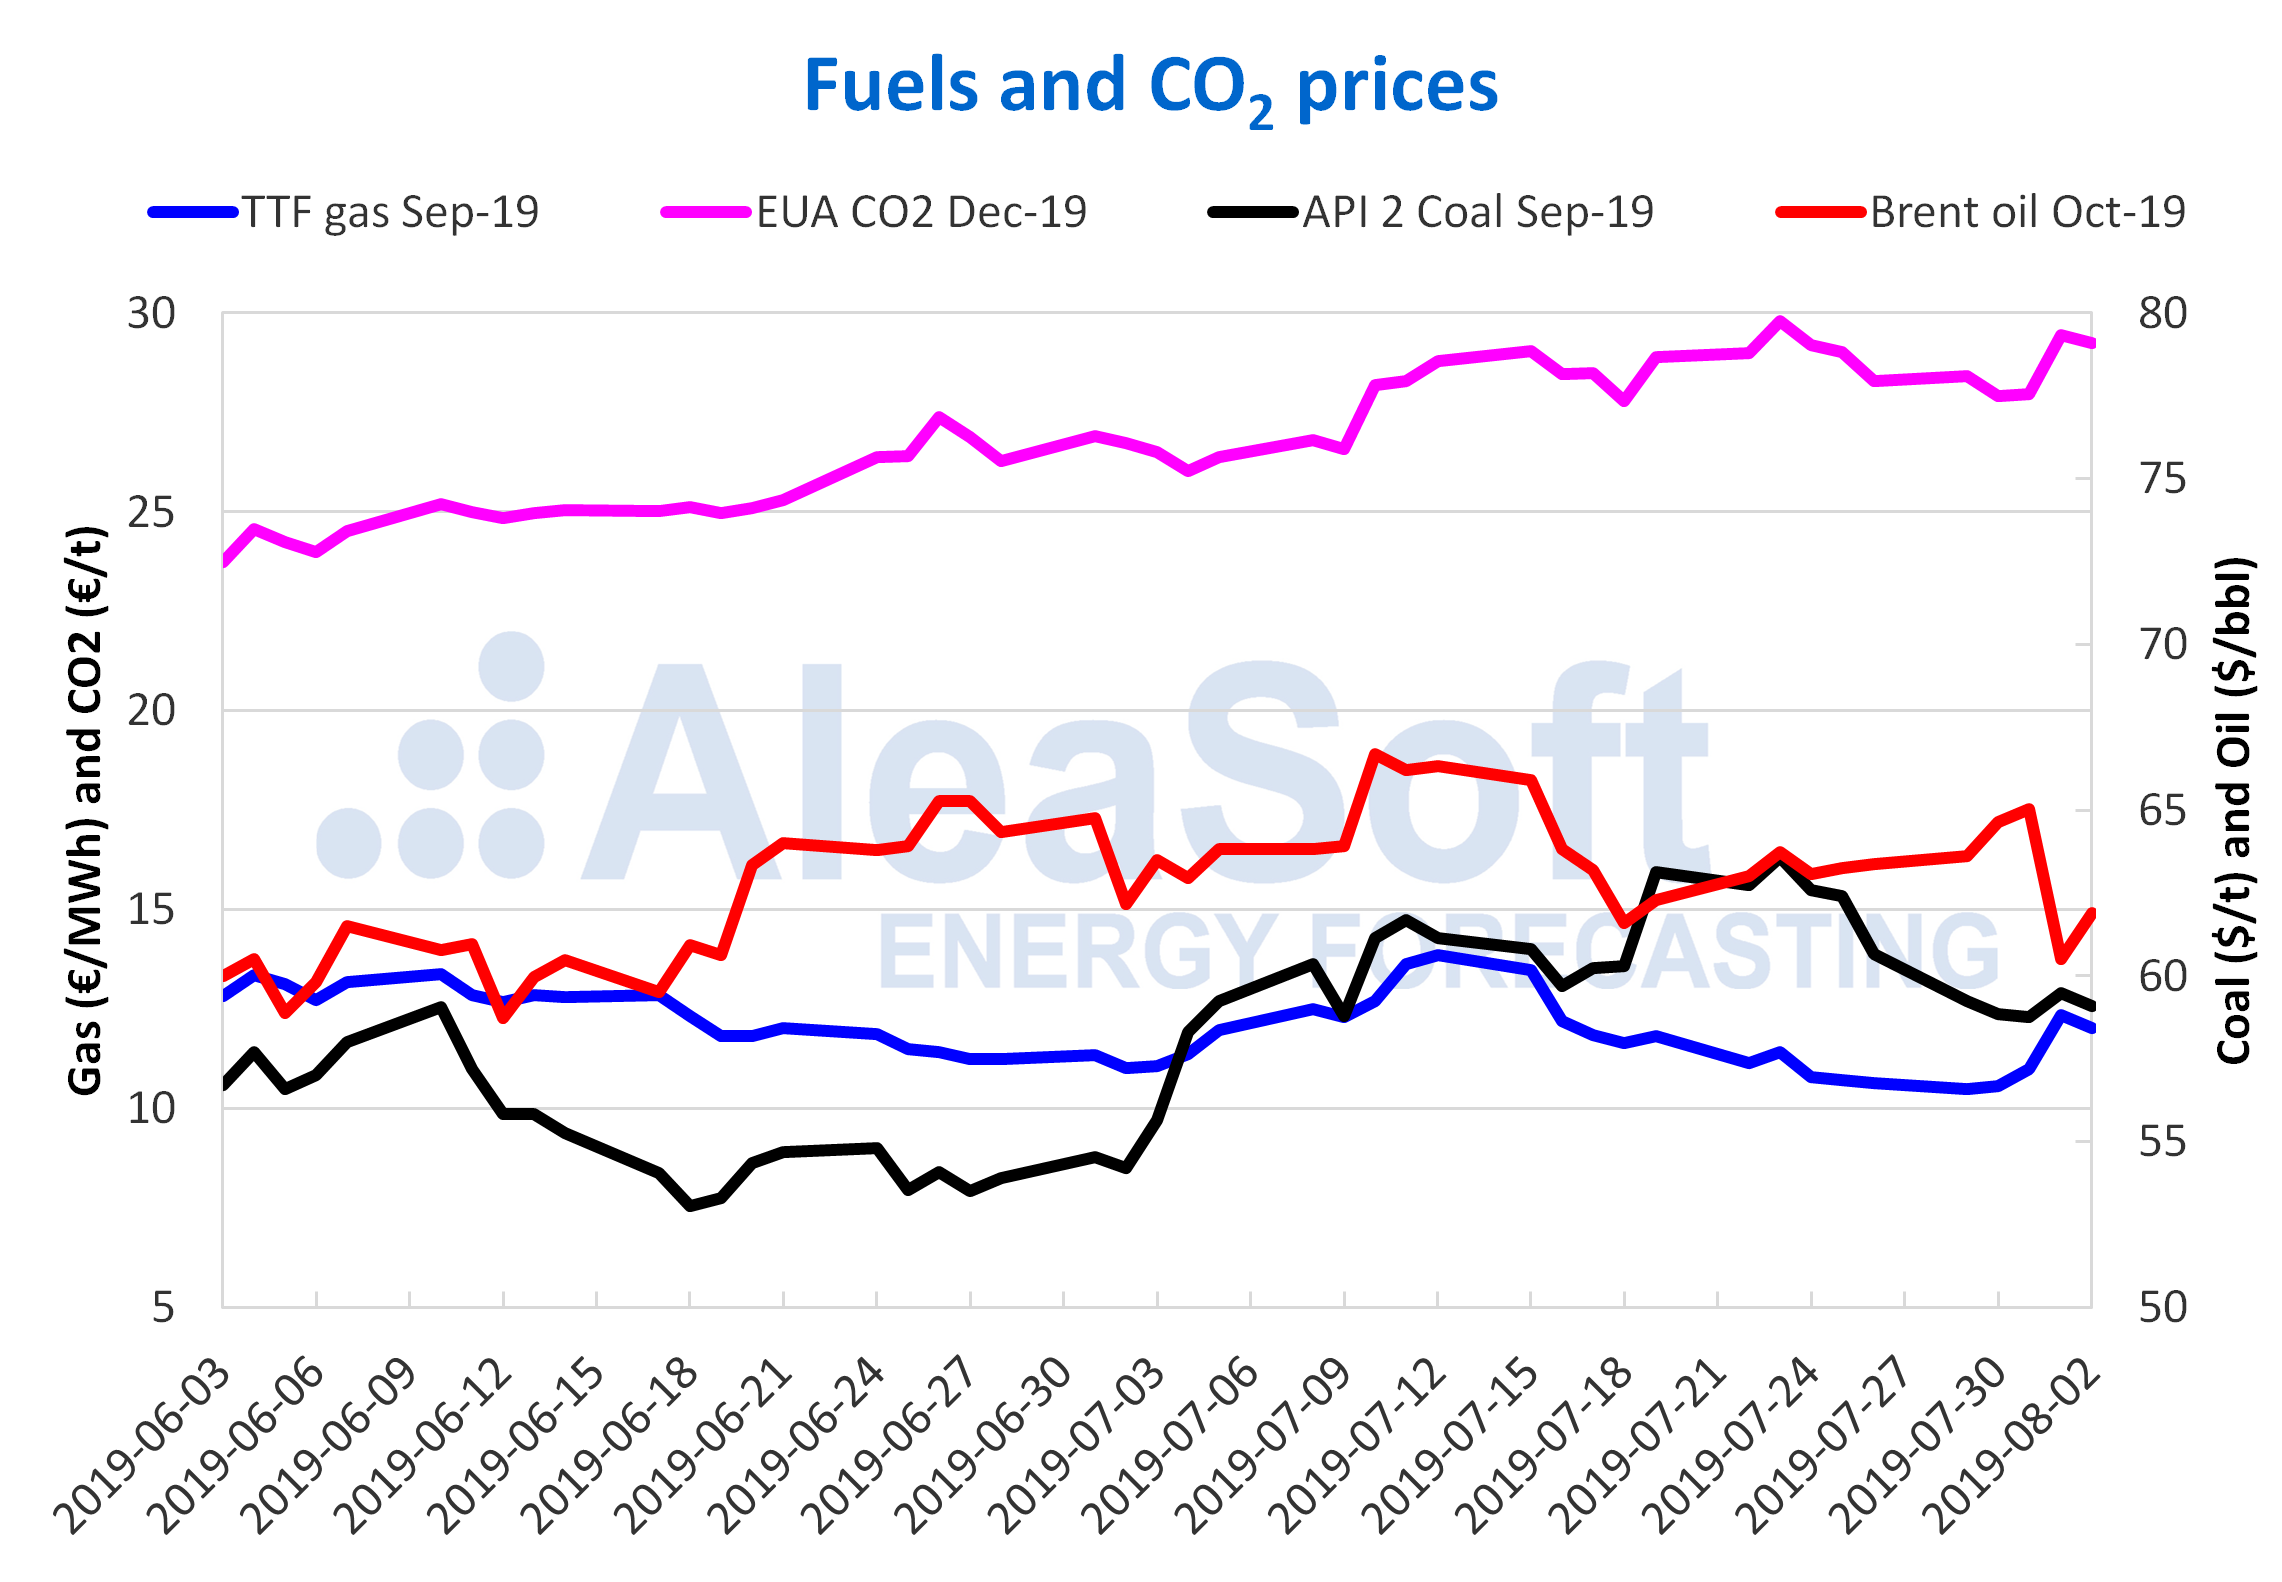
The Brent oil futures prices for the month of October in the ICE market stood throughout the month of July between $61.59/bbl and $66.69/bbl, reaching a monthly average of $63.95/bbl, value well below the $72.23/bbl of July 2018. This market was conditioned throughout the month of July by multiple factors that acted both upward and downward. The interruptions caused by Hurricane Barry, the production cuts established by OPEC+ and a new escalation in tensions between the West and Iran after a failed attack on a British tanker, weighed on the offer side. While in the demand side continued to weigh the risk of a global economy weakening due to the trade war between the United States and China. At the end of last week there was an increase in tensions between the United States and China after the announcement of the imposition of a 10% tariff as of September 1 on Chinese products by the United States. This event led to a sharp fall of $4.55/bbl on Thursday, August 1, compared to the previous day, reaching $60.50/bbl, the lowest value of this product since June 18.
The TTF gas futures in the ICE market for the month of September were traded with a strong upward trend during the first days of July settling on Friday, July 12, at €13.87/MWh, their highest settlement value since May. However, since the middle of last month, prices returned to the downward trend that they have been experiencing since October 2018. In July just finished, the prices of this product were much lower than those of July 2018, with a difference of €8.23/MWh in the comparison of the average of both periods.
The API 2 coal futures prices in the ICE market for the month of September showed an upward trend during the first part of July reaching $63.60/t on Tuesday, July 23, but these values stood much lower than those registered during the month of July, 2018, with a difference in the average value of $27.41/t between both periods. After the rise recorded last month, they fell back below $59/t on the last two days of the month of July, although they stood above the beginning of the month. It should also be noted that this sudden rise occurred after a prolonged downward trend and was completed with an increase of more than $9/t in less than 30 days.
The CO2 emission rights futures prices in the EEX market for the December 2019 reference contract were traded above €26/t throughout the month of July and settled on Tuesday, July 23, at a record high of €29.80/t. This product experienced a strong increase in its settlement prices when compared to the values recorded in July 2018 with a difference of €11.35/t between the averages of both periods.
This combination of the gas price decrease and the CO2 emission rights price increase makes it possible for gas energy production to replace coal energy production in markets where both technologies coexist. This circumstance causes the market price to decrease and CO2 emissions to be reduced.
Sources: Prepared by AleaSoft using data from ICE and EEX.
European electricity markets
In the main European electricity markets, prices receded during the past week, from July 29 to August 4, following the fall in electricity demand, which was led by the withdrawal of the heat wave and by the holiday season. Price reductions were between -16% of the EPEX SPOT market of France and -1.5% of the German market. The only and outstanding exception was the Nord Pool market of the Nordic countries that registered a 4.6% increase in the last week. This behaviour of the Nordic market caused it to cease to be, at least during this week, the market with the lowest price in Europe and with €39.78/MWh it was located above the EPEX SPOT markets of France and Belgium.

Sources: Prepared by AleaSoft using data from OMIE, , N2EX, IPEX and Nord Pool.
Analysing the whole of the month just finished, prices rose during the month of July with respect to the previous month. The markets in which prices increased the most are the markets usually more sensitive to temperatures: the EPEX SPOT market of Belgium, with a price increase of 37%, the EPEX SPOT of France, with 29%, and the Nord Pool of the Nordic countries with a 26% increase. Below is the EPEX SPOT market of Germany with a price increase of 22%. The rest of the markets were around 9% price growth rates, but the N2EX market of Great Britain stands out with the smallest increase of all markets, below 3%.
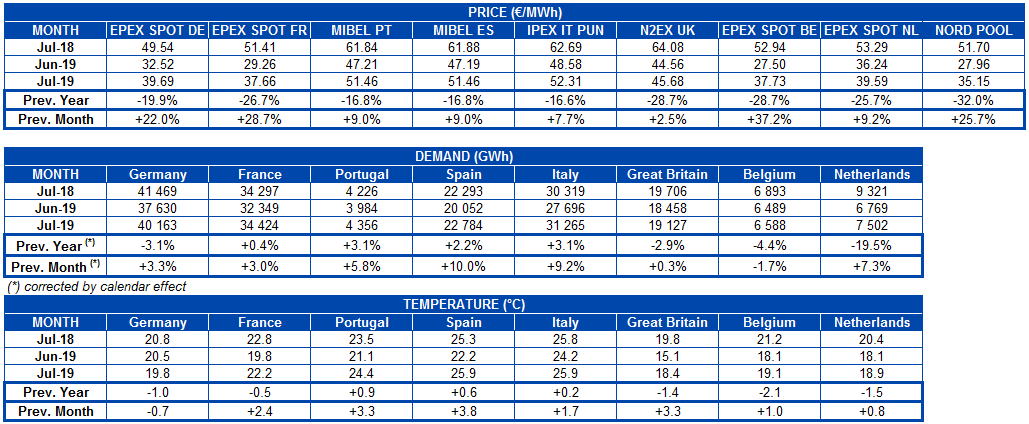
The price increase in European electricity markets during this month of July followed the same trend as the increase in the price of CO2 emission rights, which rose by 11% compared to the average price in June. But the prices of the electricity markets have basically responded to the behaviour of temperatures, hence the most prominent price increases were recorded in the most weather-sensitive markets. Although at the end of last June there was also a heat wave on the continent, during the heat wave of the second half of July recorded slightly higher temperatures and the situation worsened with the unavailability of nuclear power plants in France, due to environmental restrictions to its refrigeration. On average, between June and July, the temperature increase was 2 °C.
The situation of the prices of the electricity markets is clearly different when compared this month of July with the month of July 2018. In this case, the fall in prices was noticeable in all markets. The reduction was between 17% of the MIBEL market of Spain and Portugal and 32% of the Nord Pool market, and responds to the change in the gas and coal prices scenario, which in July 2018 were in full bull run towards the maximums recorded in September, while in 2019 the trend is clearly downward with several historical lows recorded in the last month.
Coinciding with the fall in fuel prices, wind energy production this July was clearly higher than in July of the previous year. According to AleaSoft’s estimates, in the set of the main European markets, the year-on-year increase in wind energy production in July is around 39%.
Regarding the average price level during this month of July, the EPEX SPOT markets were around €39/MWh, while the Nord Pool market again registered the lowest price with €35.15/MWh. The British N2EX market continued halfway with an average price of €45.68/MWh and the other traditionally more expensive markets of Spain, Portugal and Italy were around €52/MWh.

Renewable energies captured price: wind and solar energy
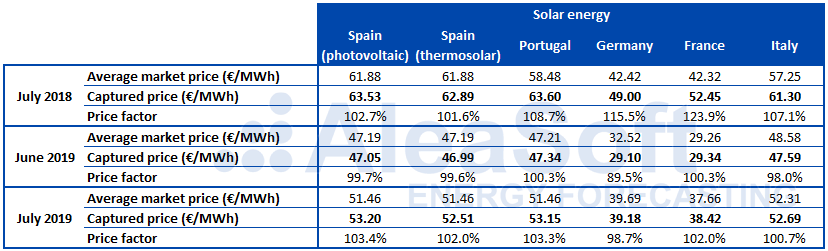
The price captured by solar energy clearly increased with respect to the values obtained in June in the main European electricity markets, and its price factor also increased with respect to the average market price. In the electricity market of Spain, both photovoltaic and solar thermal, and in Italy, the price factor exceeded 100% after it fell below in June. In the case of Portugal and France, in June they were above 100%, but in July they rose to 103% and 102%, respectively. And in Germany, although it remained at 99%, it clearly increased from the 90% obtained in June.
On the contrary, the situation compared to the month of July 2018 is the opposite: the prices captured by the solar energy dropped and so did the price factor. In this case, the exception is Spain, where, although the price captured by both photovoltaic and solar thermal decreased, its price factor slightly increased.
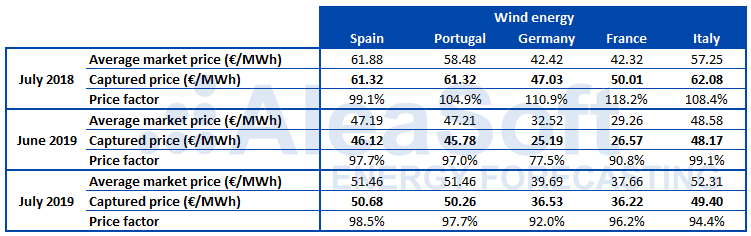
For wind energy, the situation was completely analogous: increases compared to last month and decreases compared to July 2018, but with their traditionally lower price factor values than for solar energy. In this case, wind power in Spain followed the same trend as the rest of the European markets analysed.
Electricity futures
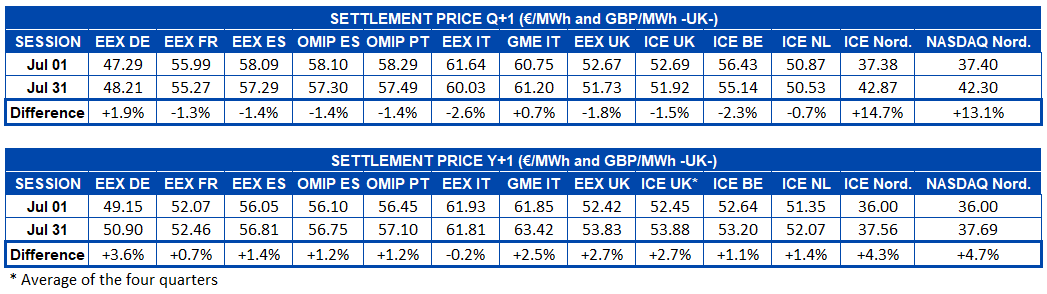
The European electricity futures prices for the fourth quarter of 2019 ended the month of July with falls in most markets with respect to the first day of the month between 0.7% and 2.6%. The exceptions were the Nordic markets at ICE and NASDAQ that stand out for an increase of 14.7% and 13.1%, respectively. The MTE market operated by GME and the German market in EEX also increased by 1.9% and 0.7% respectively.
In the case of European electricity futures for the year 2020, they ended the month of July with generalised increases of between 4.7% and 0.7%. Only the GME-operated MTE market fell, settling 0.2% lower than the first day of the month.
Wind and solar energy production
During July, wind energy production had a considerable increase in the main European markets compared to July 2018. The global increase was almost 40%, with Germany and France being the countries with the highest increases, 57% and 51% respectively.
Compared to the previous month, production with this technology only rose in Italy, 23%. On the other hand, in Portugal there was a decrease of 11% and in France of 10%, while in the rest of the main producers the fall was close to 4%.
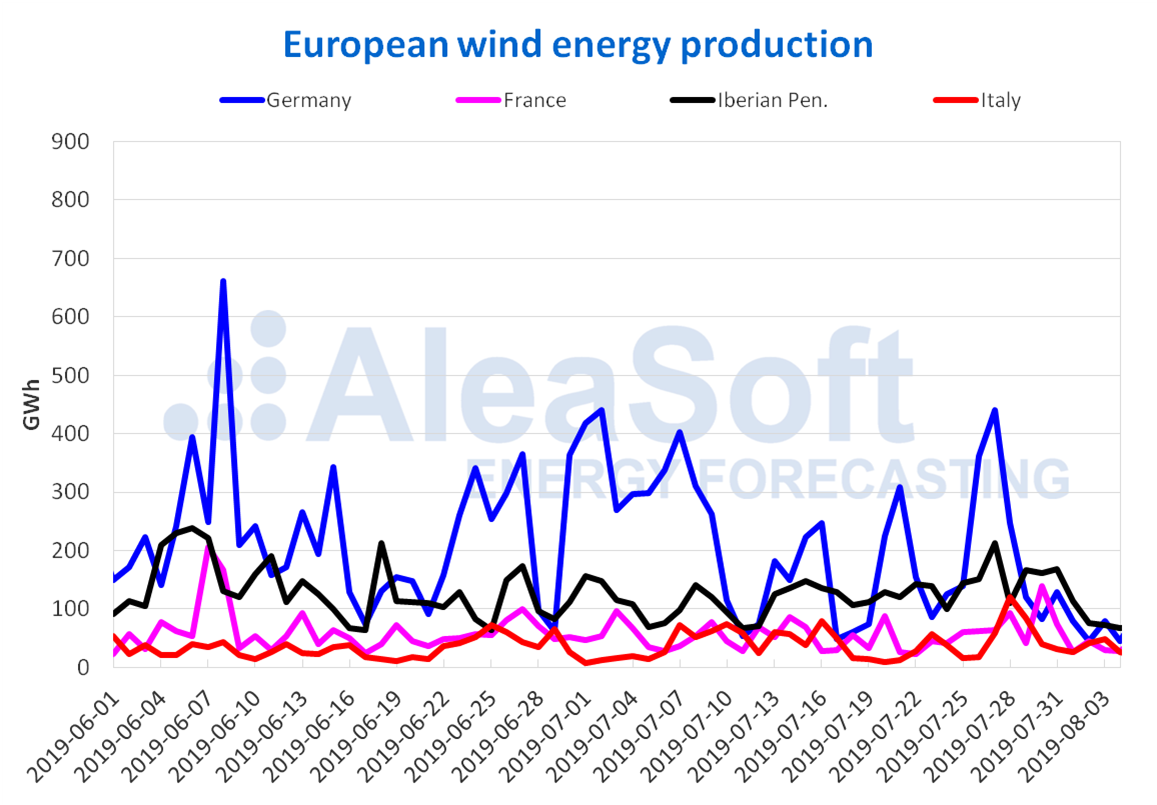
Sources: Prepared by AleaSoft using data from ENTSO-E, RTE, REN, REE and TERNA.
Regarding solar energy production, which includes both photovoltaic and solar thermal technology, there was a general decrease in year-on-year terms last July. The decreases were 7.0% in Germany, 4.1% in Spain and 1.0% in Italy. In turn, there was a drop in production from this renewable source in these three countries in July compared to the previous month, where Germany, with 14%, suffered the biggest decline. Among the relevant events of the month were the records in Spain of instantaneous photovoltaic energy production of more than 4 GWh and monthly of 948 GWh.
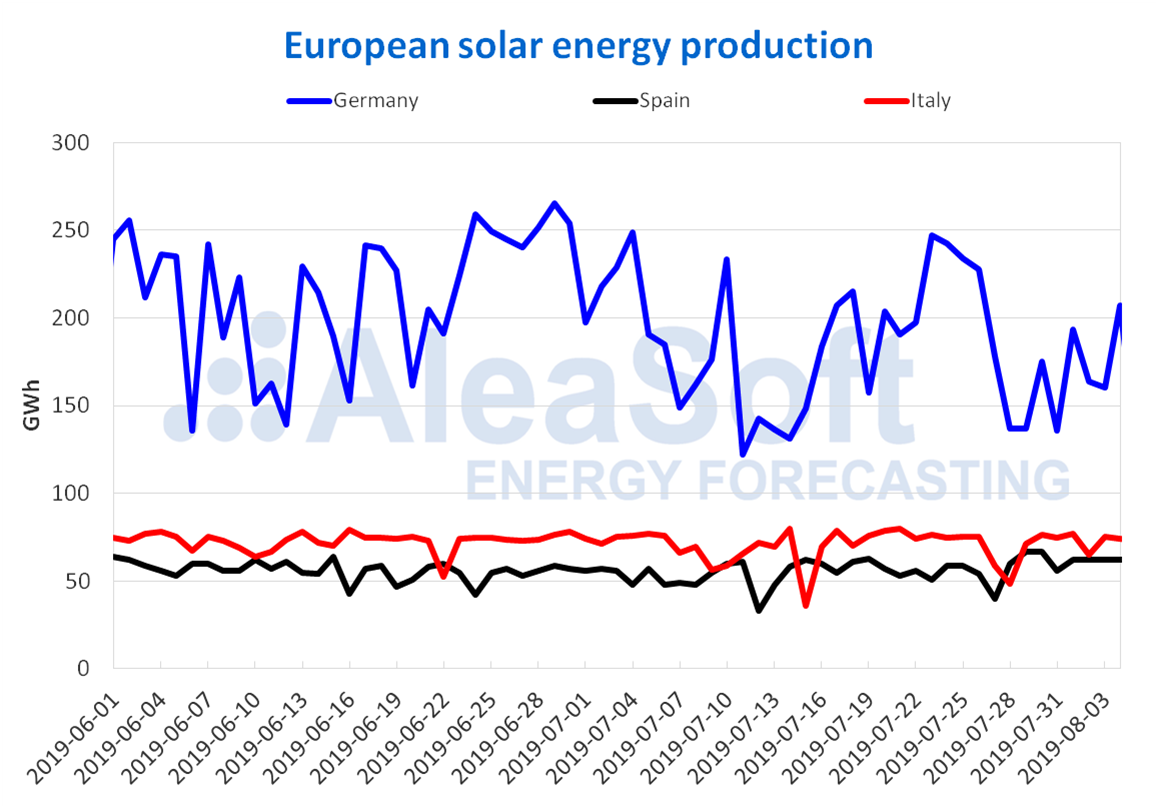
Sources: Prepared by AleaSoft using data from ENTSO-E, REE and TERNA.
Source: AleaSoft Energy Forecasting.