AleaSoft, October 23, 2019. AleaSoft analyses the Spanish electricity market in its second period, from the beginning of the economic crisis at the end of 2008 to the first signs of recovery in 2014, as a follow-up of a series of articles on the market that the consultant is publishing to celebrate 20 years as a leader in the field of forecasting in the energy sector. This period was characterised by the fall of the electricity demand and the entry of more renewable energy, both wind and solar energy, displacing the energy production with more polluting technologies.
AleaSoft celebrates the 20th anniversary of its foundation as a leader company in the field of the forecasts for the energy sector, carrying out an analysis on the history of the Spanish electricity market. In an article published a few days ago, AleaSoft analyses the first years of the market, from its foundation in 1998 until the beginning of the economic crisis in 2008.
This second period of the electricity market, which goes from the beginning of the economic crisis at the end of 2008 to the first signs of recovery in 2014, is characterised by the fall in the electricity demand until 2005 levels. In general, during this period it is possible to appreciate the entry into the market of more renewable energy, both wind and solar energy, displacing the most polluting technologies, fuel, gas and coal.
Spanish electricity market prices
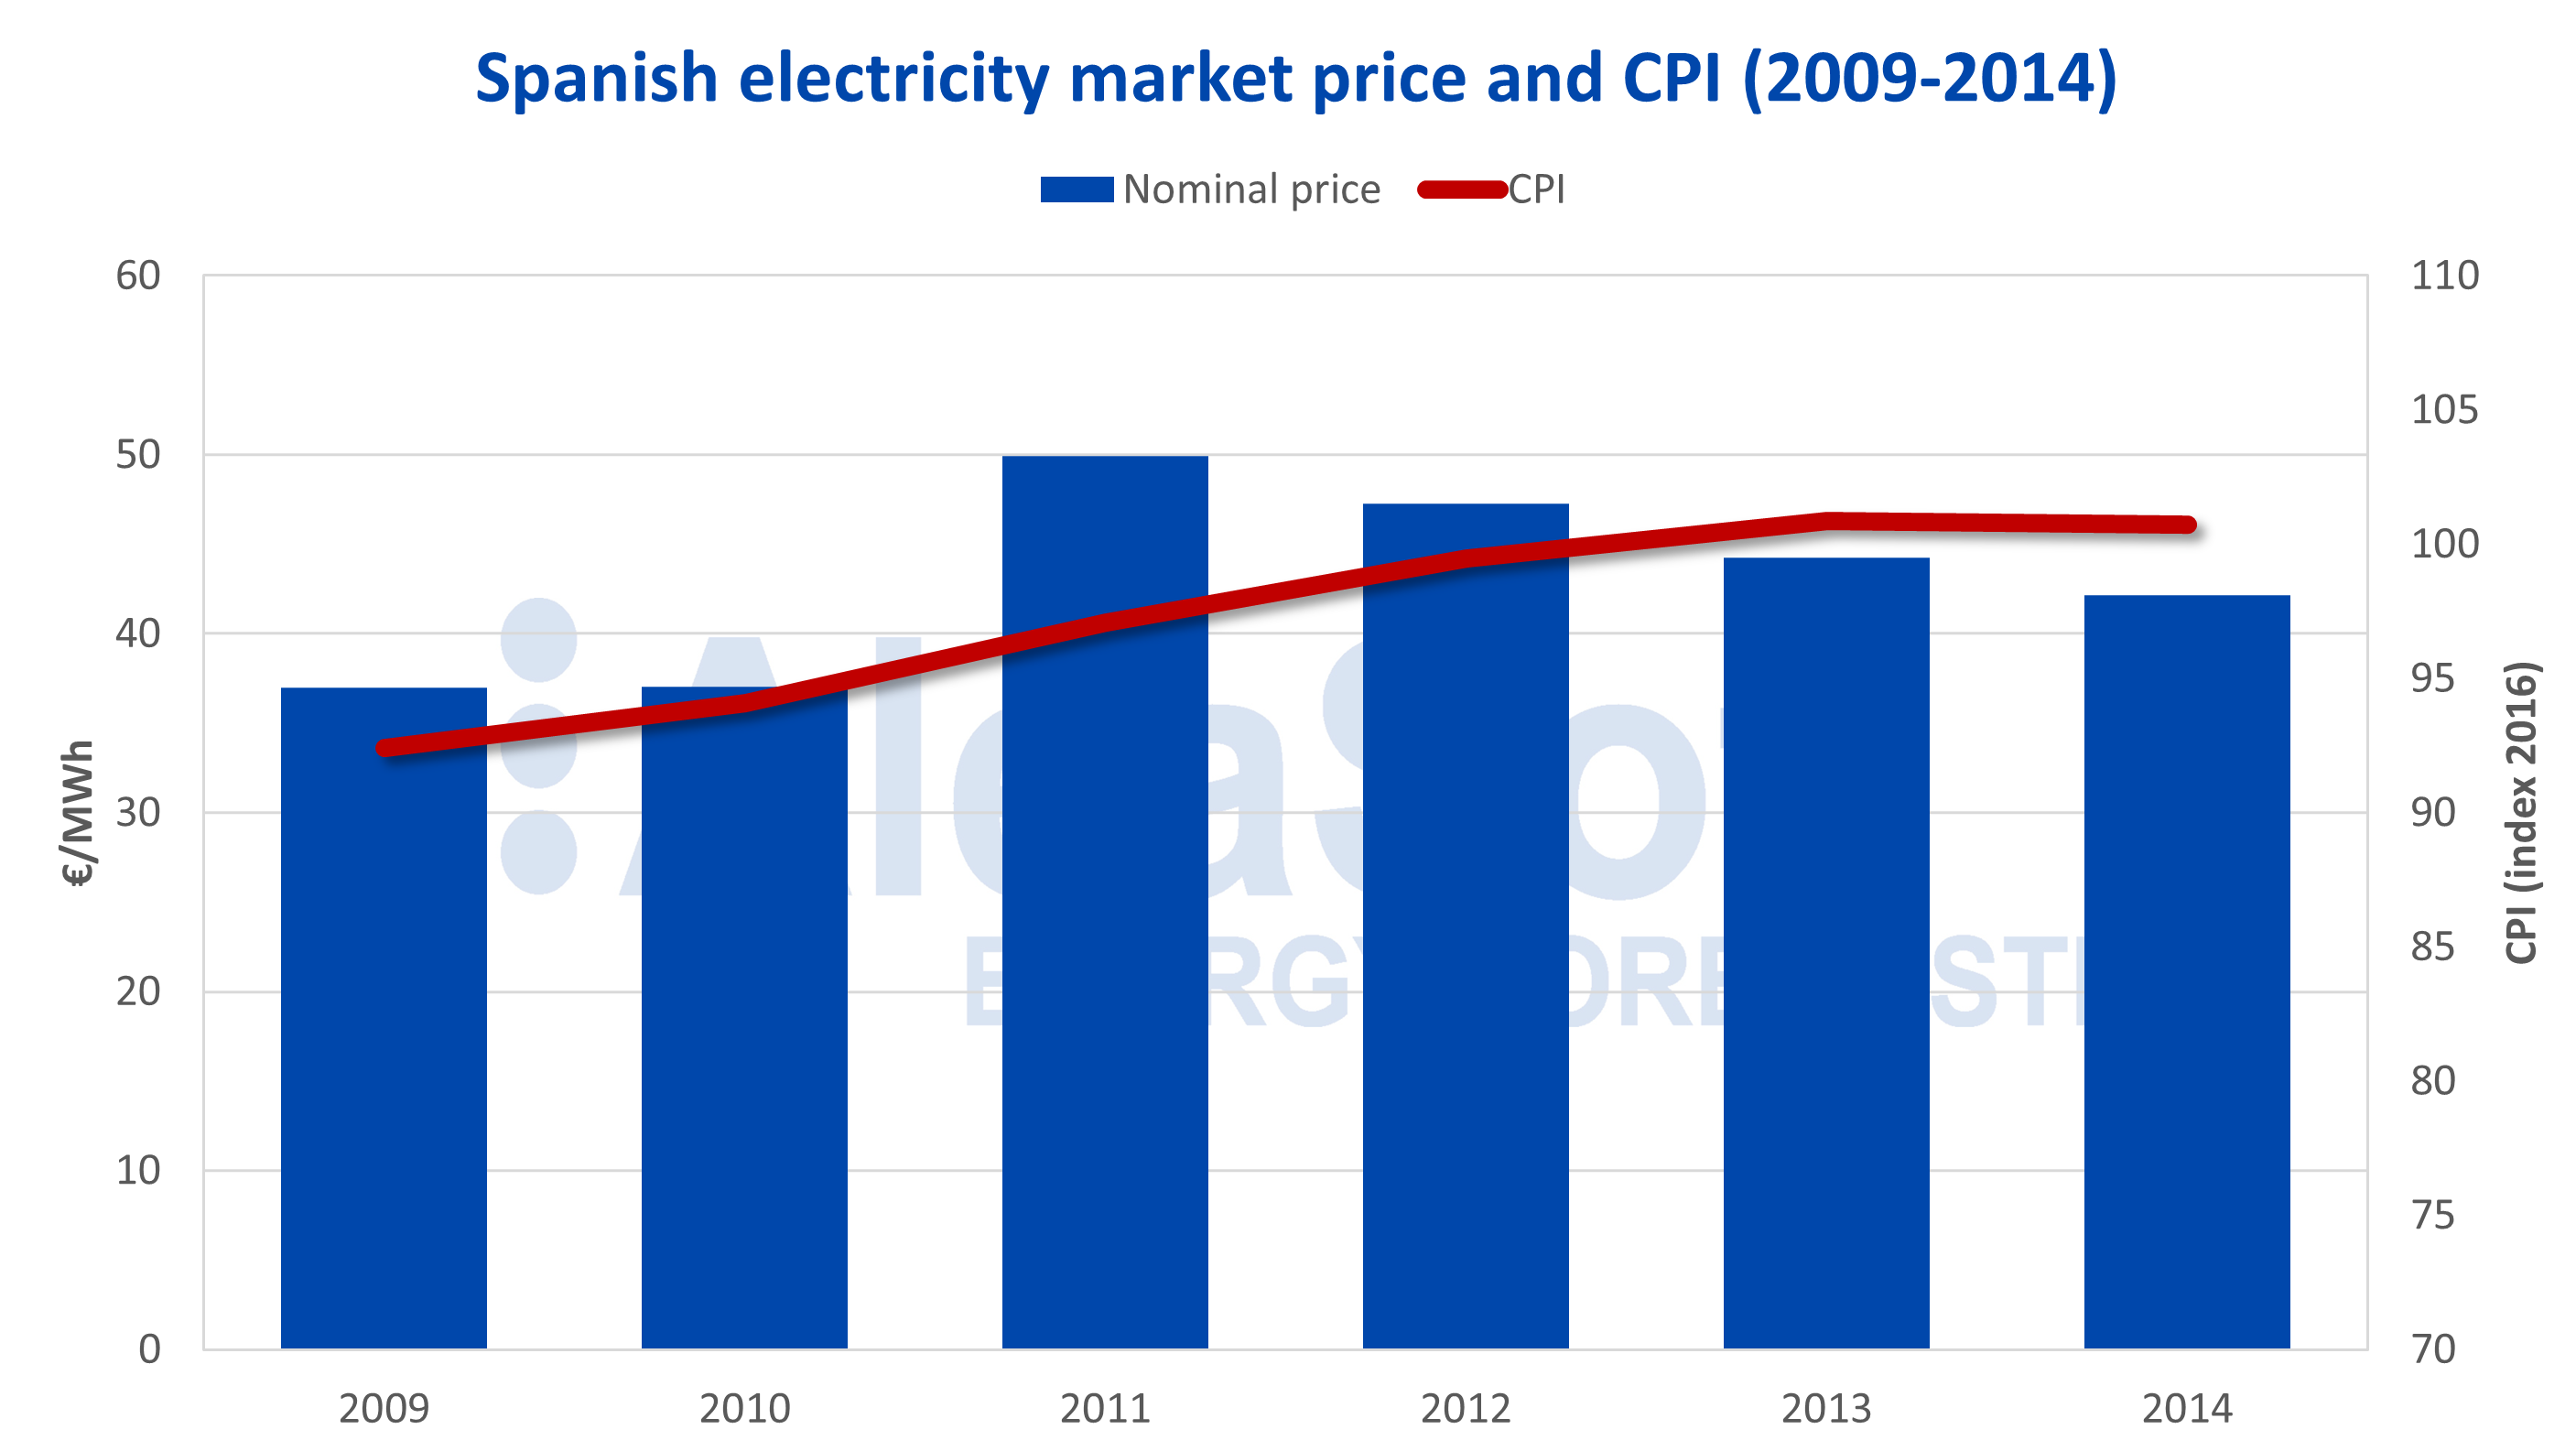
Compared to the rising price trend during the first ten years of the liberalised electricity market, the following period, from 2009 to 2014, can be considered relatively flat in terms of price trends. During these years, the annual average price fluctuates around €43/MWh, between €36.96/MWh in 2009 and €49.96/MWh in 2011.
At the beginning of the crisis, all prices fell. The price of the electricity market starts falling by 43%, from €64.43/MWh in 2008, the highest price of the history, to €36.96/MWh in 2009. The prices of fossil fuels for electricity generation, gas and coal, as well as Brent oil and CO2 emission rights fell that same year in magnitudes very similar to that of the electricity market.
During the following years, as of 2010, the gas and coal prices recover, but the electricity demand continues to fall, which prevents the market price from rising and recovering growth rates prior to 2008. The result is a relatively stable electricity price with variations due to the behaviour of the renewable energy production and the fluctuations in the fuel prices.

Source: Prepared by AleaSoft using data from OMIE.
Between January 1, 2009 and December 31, 2014, 1077 hours with a price of €0/MWh were recorded. Throughout the history of the market, this is the period with more hours with price equal to zero, where 2% of all hours registered a null price. These hours are grouped mainly around times of low electricity demand such as dawn, weekends and holidays, where a peak of wind energy production can easily make virtually disappear the thermal gap and sink the price.
It is also in this six-year interval when the only two days to date with 24 hours with zero prices are recorded and, therefore, days with a daily base price of €0/MWh. Both days belong to the Holy Week of 2013. The first is Good Friday, March 29, and the other, Easter Monday, April 1.
But to maintain the market equilibrium, and for the generation to be profitable, when many hours are recorded with zero price, higher price peaks are also recorded. It is precisely in this period with more hours at zero prices where the highest hourly price to date was recorded. On Saint Stephen’s Day in 2010, being a post-holiday of Christmas, the highest price in the market history was registered between 9:00 p.m. and 10:00 p.m., of €145.00/MWh.
With regard to the price relationship between the electricity systems in Spain and Portugal, this period is characterised by a much higher coupling than the years before the crisis. The annual coupling increased from 38% registered in 2008 to 74% in 2009 and 96% in 2010, the latter being the year with the highest coupling between the markets of the period. In general, between 2009 and 2014 the electricity price in the MIBEL market for Spain and Portugal was the same 89% of the hours.
From a joint project of the operators of the electricity system of France, Spain and Portugal: RTE, REE and REN, and of the operators of the Iberian and French markets, OMIE and , the daily markets of the southwest of Europe coupled their price officially at the end of this period, on May 13, 2014.
Electricity market price and inflation
During the toughest years of the global economic crisis, the inflation growth in Spain slowed. After rising 39% between 1998 and 2008, the consumer price index (CPI) grew only 8.7% between 2008 and 2014, even registering setbacks in some specific years such as 2009, ‑0.3%, and 2014, ‑0.2%.
Source: Prepared by AleaSoft using data from OMIE and INE.
In the period analysed in this article, from 2009 to 2014, the price of the Spanish electricity market increased by 14%. If this increase is corrected taking into account inflation, the electricity market price increase stands at 4.6%.
The price increase from the entry into operation of the market in 1998 to 2014 was 68%. Taking into account that during this time interval the growth of the CPI was 51%, the real growth of the price of the electricity market corrected with inflation drops to 12%.
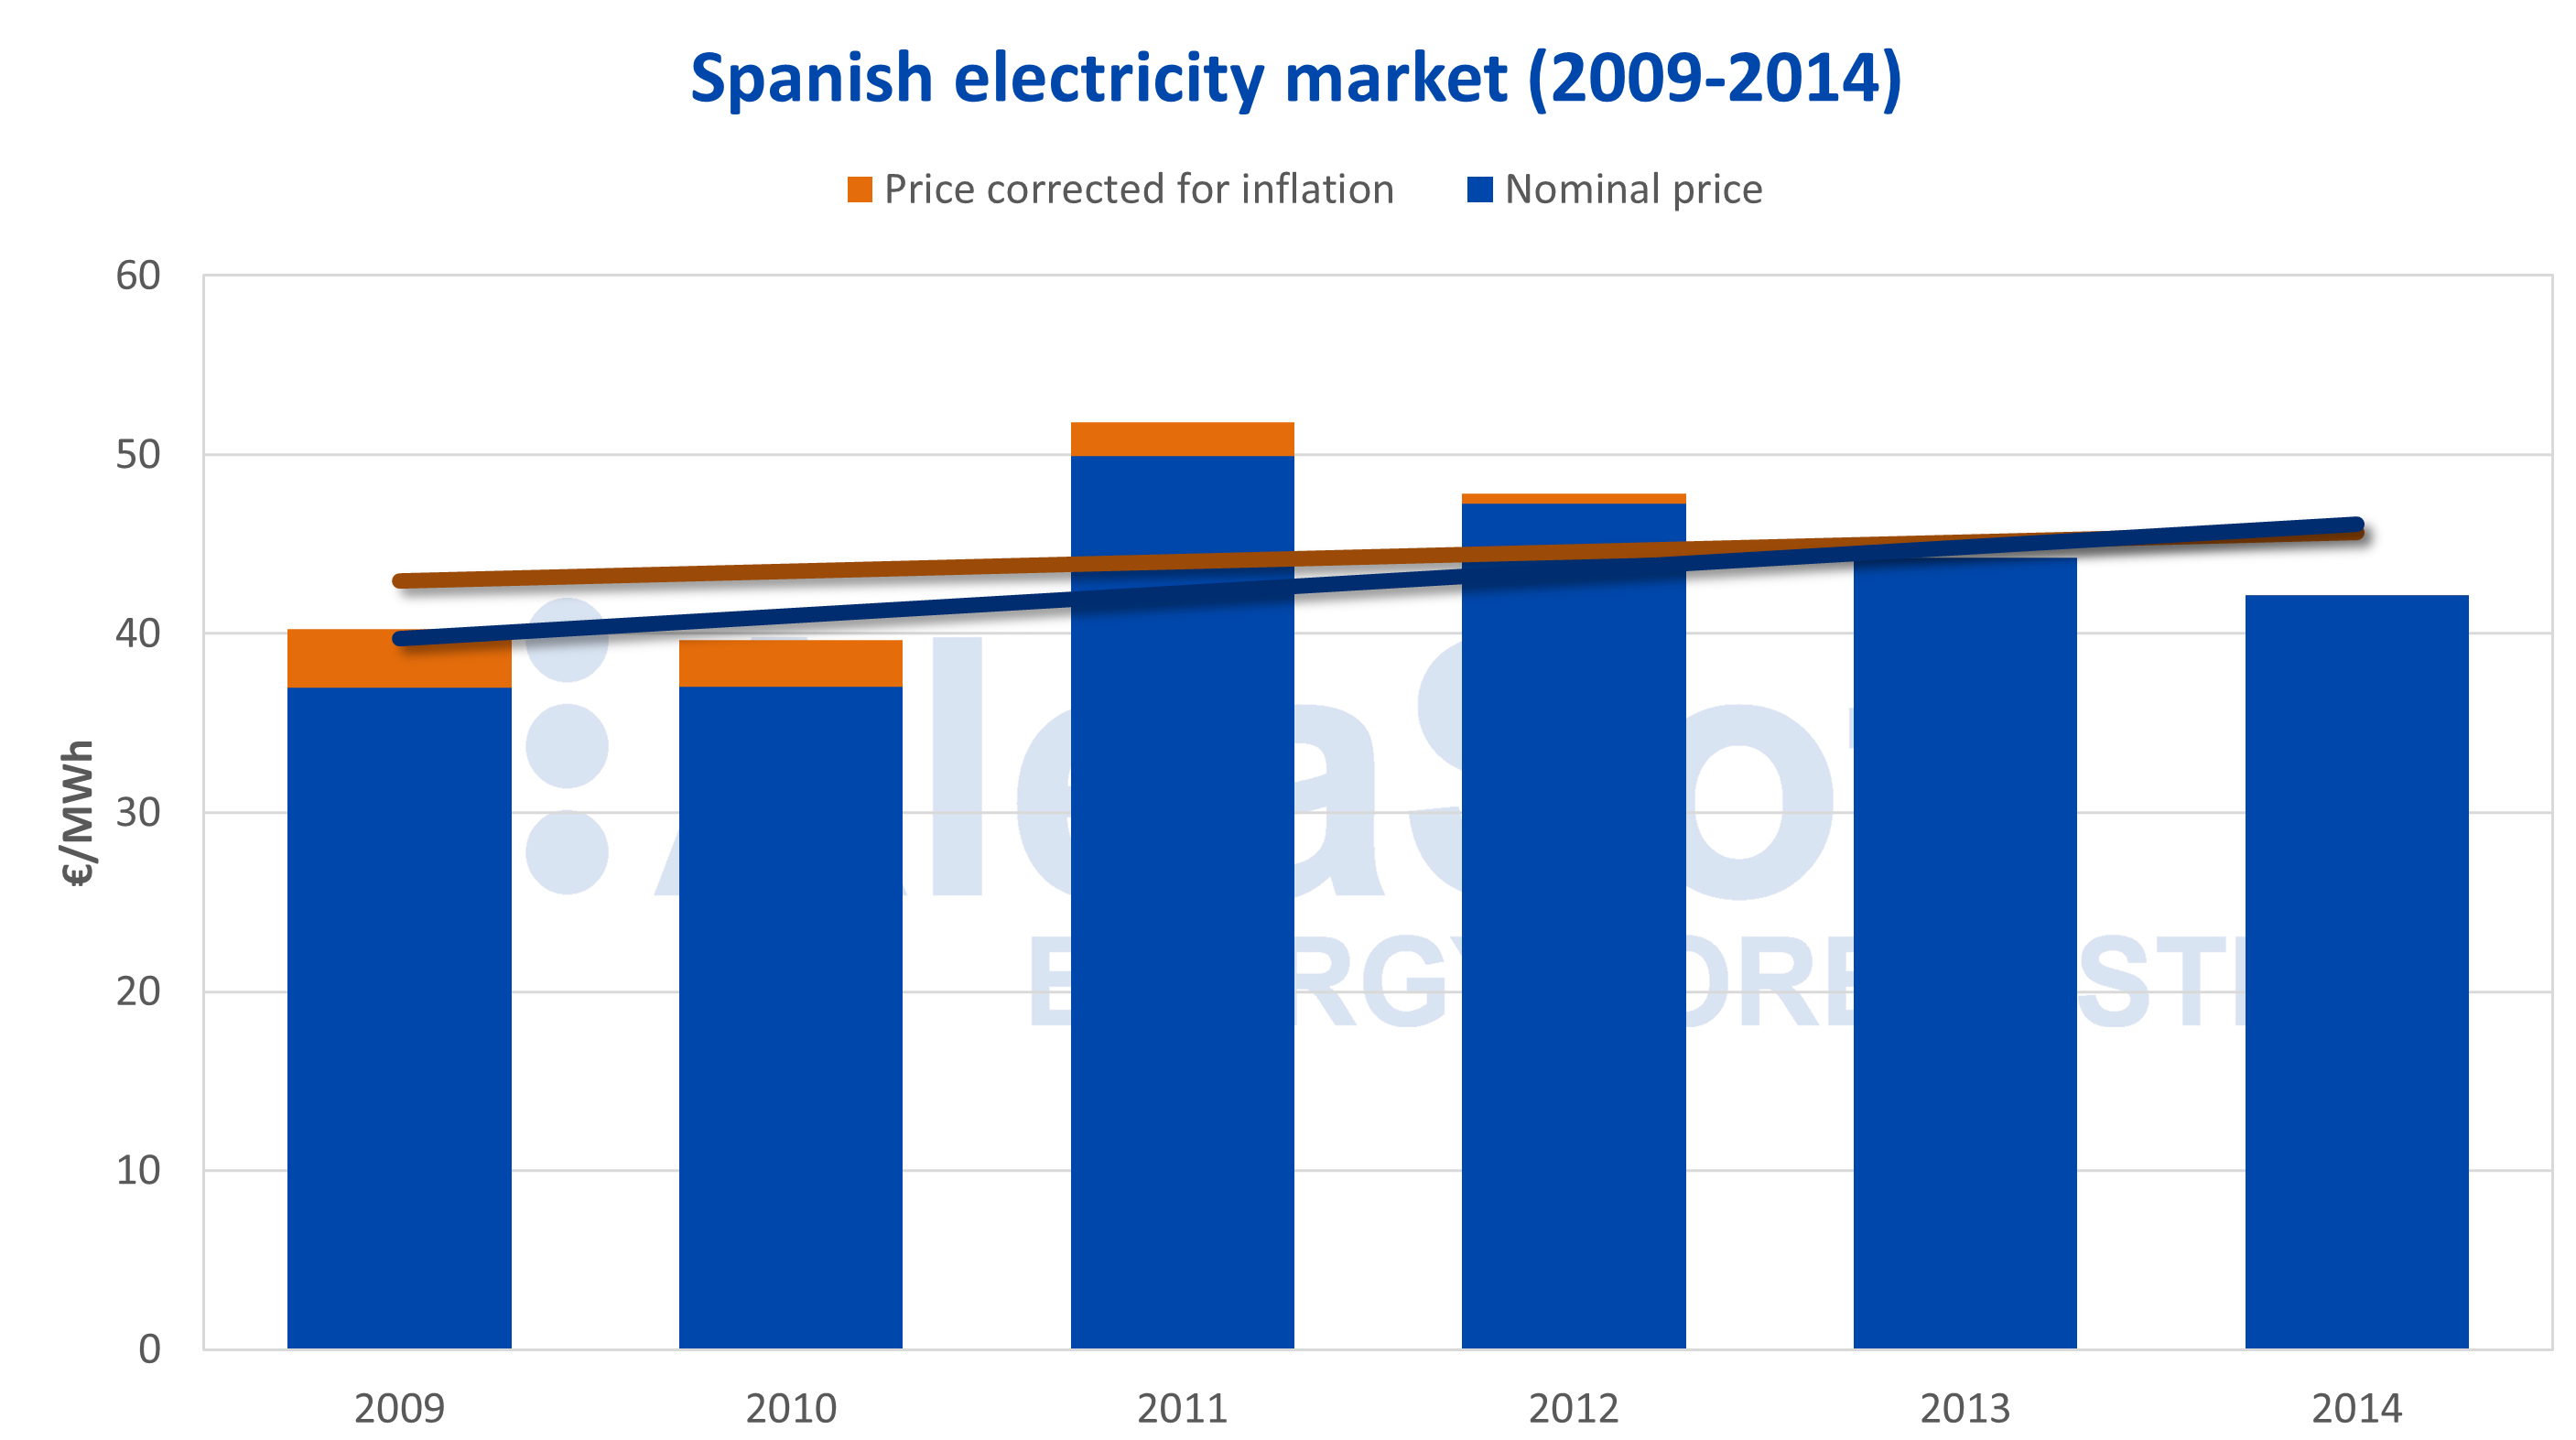
Source: Prepared by AleaSoft using data from OMIE and INE.
Electricity demand of Mainland Spain
With the arrival of the economic crisis, the electricity demand of Mainland Spain stopped the growth trend that it maintained since the electricity market began in 1998 and it started to decline since the last quarter of 2008, similar to the trend maintained by the GDP in this period.
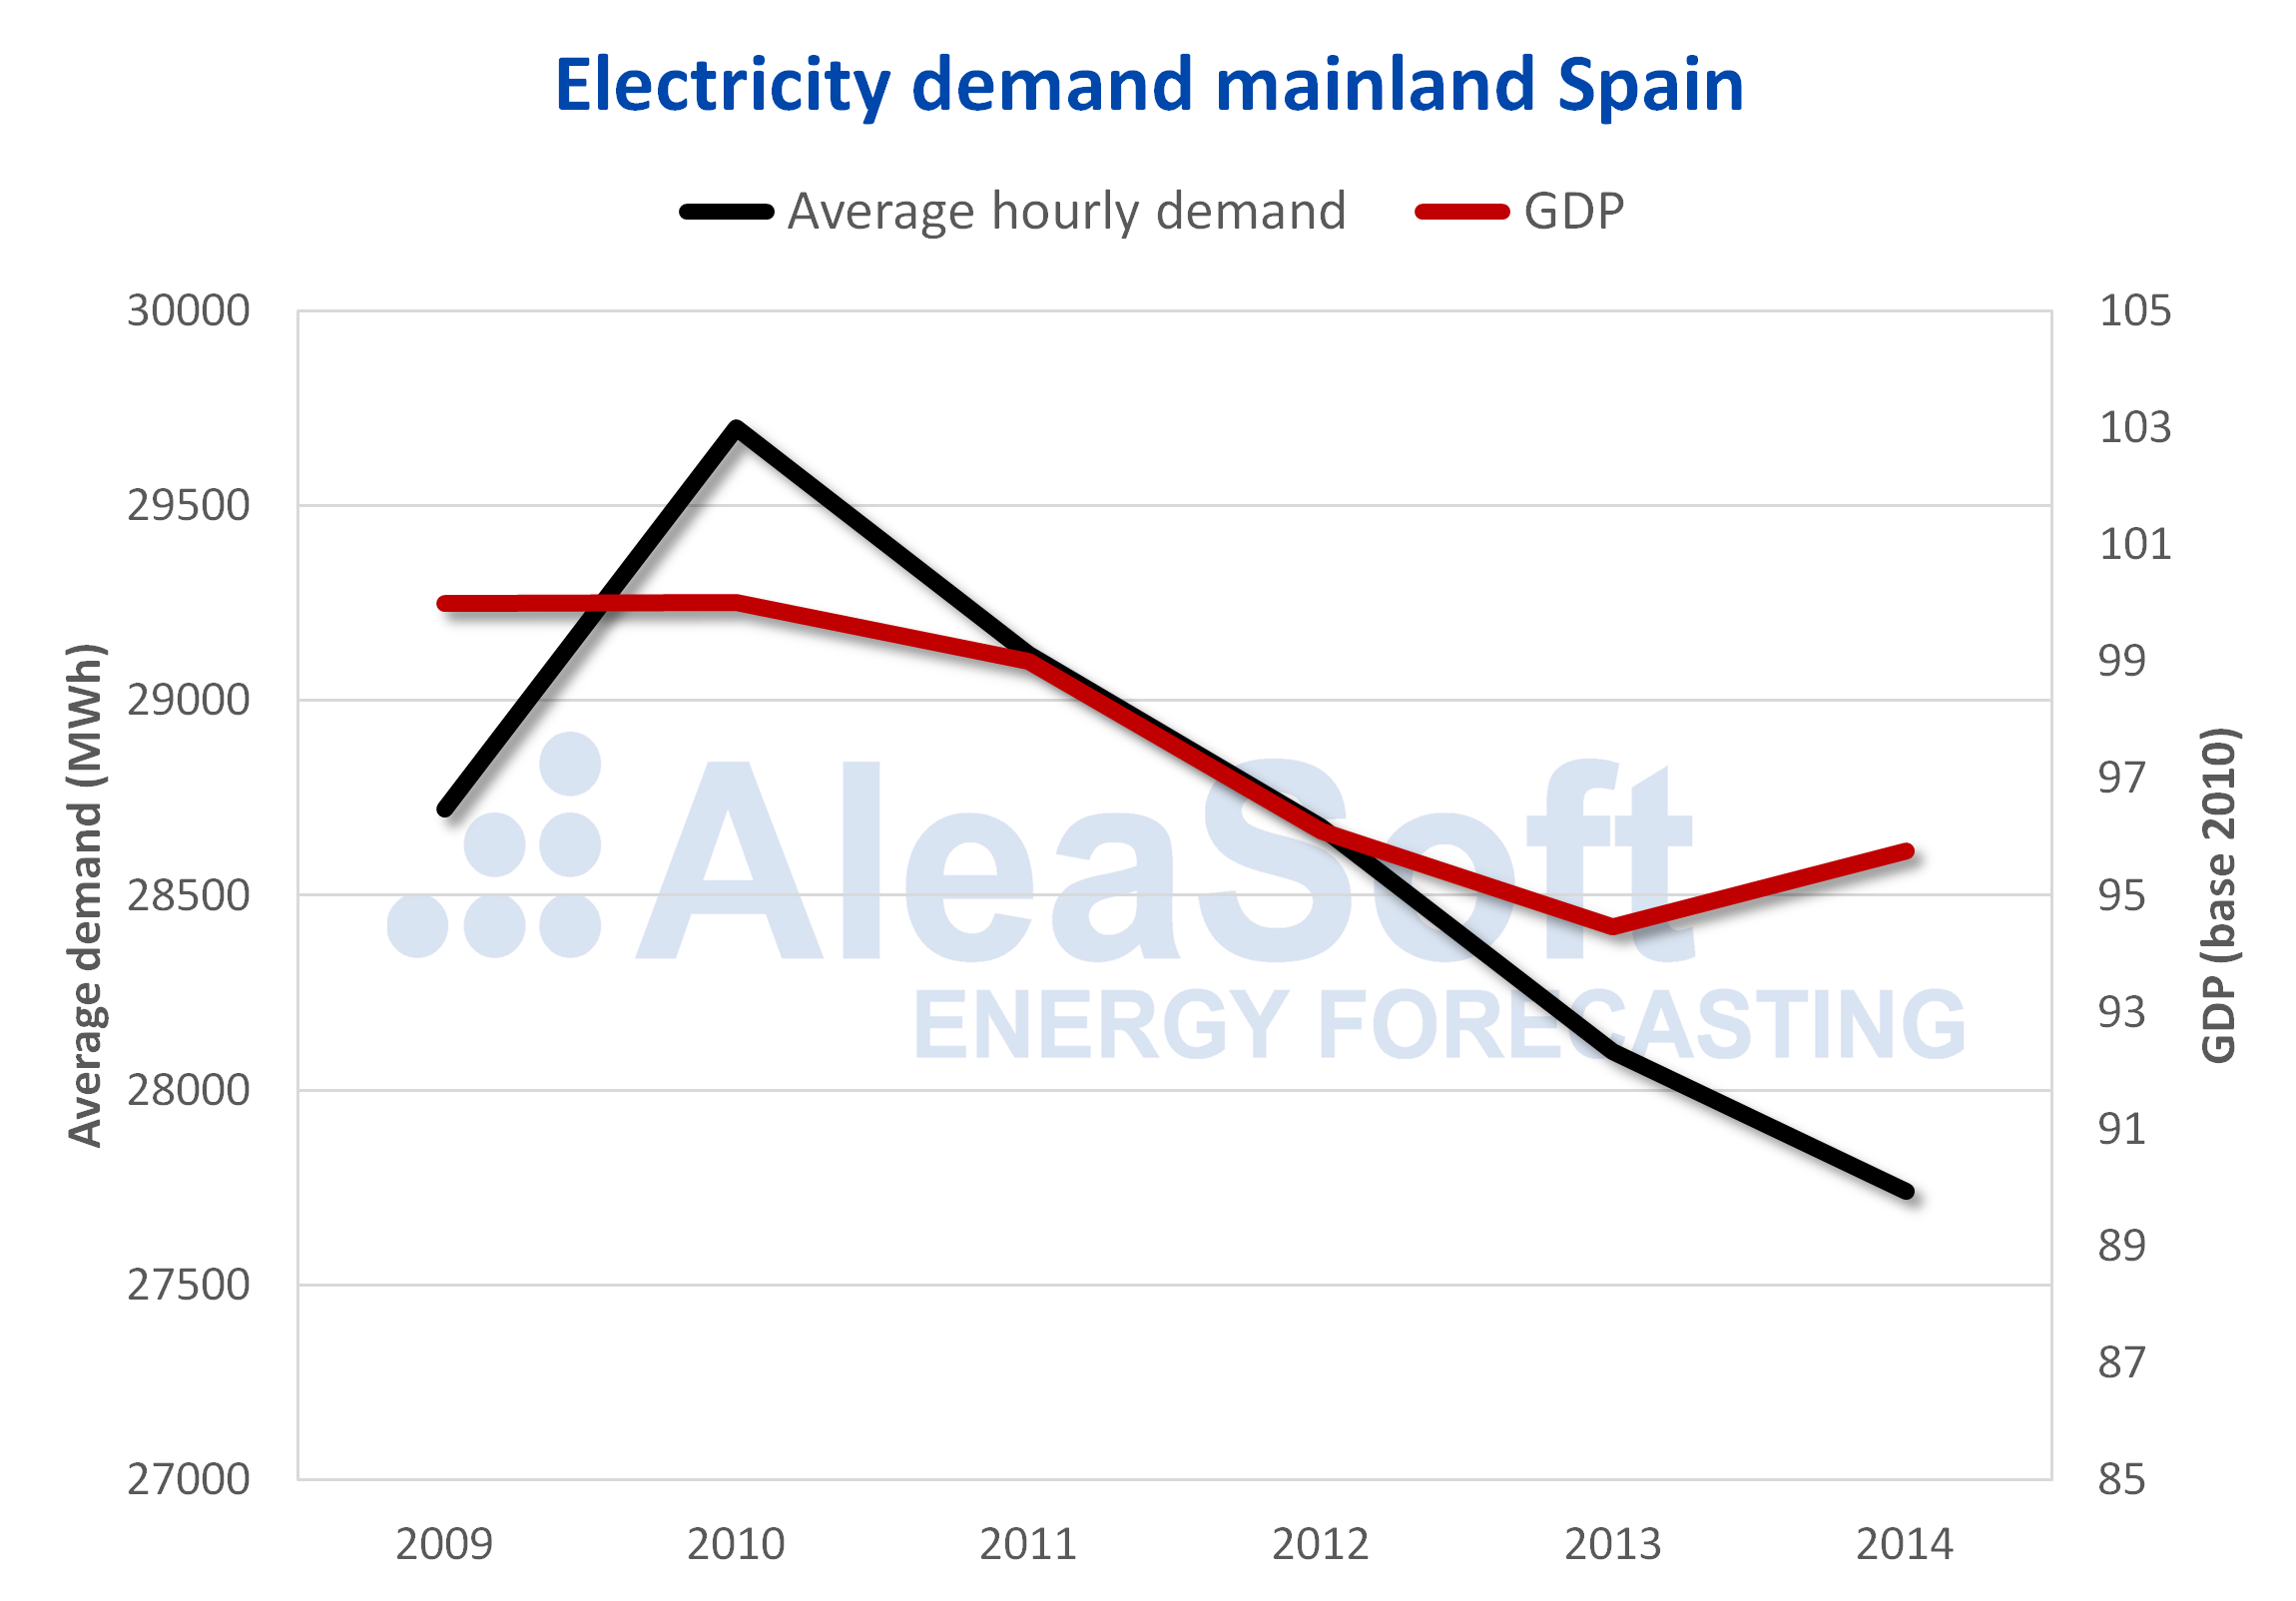
Source: Prepared by AleaSoft using data from REE and INE.
Between 2009 and 2013, GDP fell every year except in 2010 when it was similar to that of 2009, with the most pronounced fall in 2008, of ‑3.6%. Similarly, the electricity demand decreased every year between 2009 and 2013, with the exception of the year 2010, which grew 3.1%. The year with the greatest decrease in the electricity demand in the period was 2009, with ‑4.7%, being this the greatest drop since the market started operating until 2018. In 2014, the GDP begins to recover, with a growth of 1.4%, but the electricity demand continues to fall, in this case ‑1.1%. One of the reasons for this behaviour is that after the crisis the energy efficiency increased, which has been previously mentioned at AleaSoft and that will be deepened in the next article. The electricity demand and the GDP in 2014 decreased ‑8.3% and ‑7.6% respectively, compared to 2008.
Installed capacity and energy production per technology in Mainland Spain
When the crisis arrived, its effect was noted very soon in the growth of the installed capacity by technologies in Spain. Although the growth had been vertiginous until those years, during the period from 2009 to 2014 there was a slowdown in the growth of the technologies that had been emerging in previous years. The source of electricity generation that most increased its capacity was wind energy, with an annual average increase of 831.4 MW. This growth represents twice that of the combined cycle gas turbines, which were in second place. However, less wind energy capacity was installed throughout the period from 2009 to 2014 than in the last two years of the previous period, from 2006 to 2008.

The generation capacity with combined cycle gas turbines saw its growth in 2011 reduced to 3% of the figure reached the previous year and, as of 2012, it stopped completely. The generation source that most decreased its capacity in the period was that of fuel plus gas, when 2320.55 MW were removed from the market, which represents a higher withdrawal rate, in absolute terms, than that of installing new capacity with combined cycle gas turbines. During these years, 388.38 MW of coal generation capacity were also withdrawn from the market.
On the other hand, it is during this period that the use of the solar resource for obtaining electricity begins to grow. Both the photovoltaic and the solar thermal capacity recorded growths during these years, but mainly the solar thermal. In general, if both sources are considered together, their growth in absolute terms exceeds that of the combined cycle gas turbines and is positioned second after the wind energy.
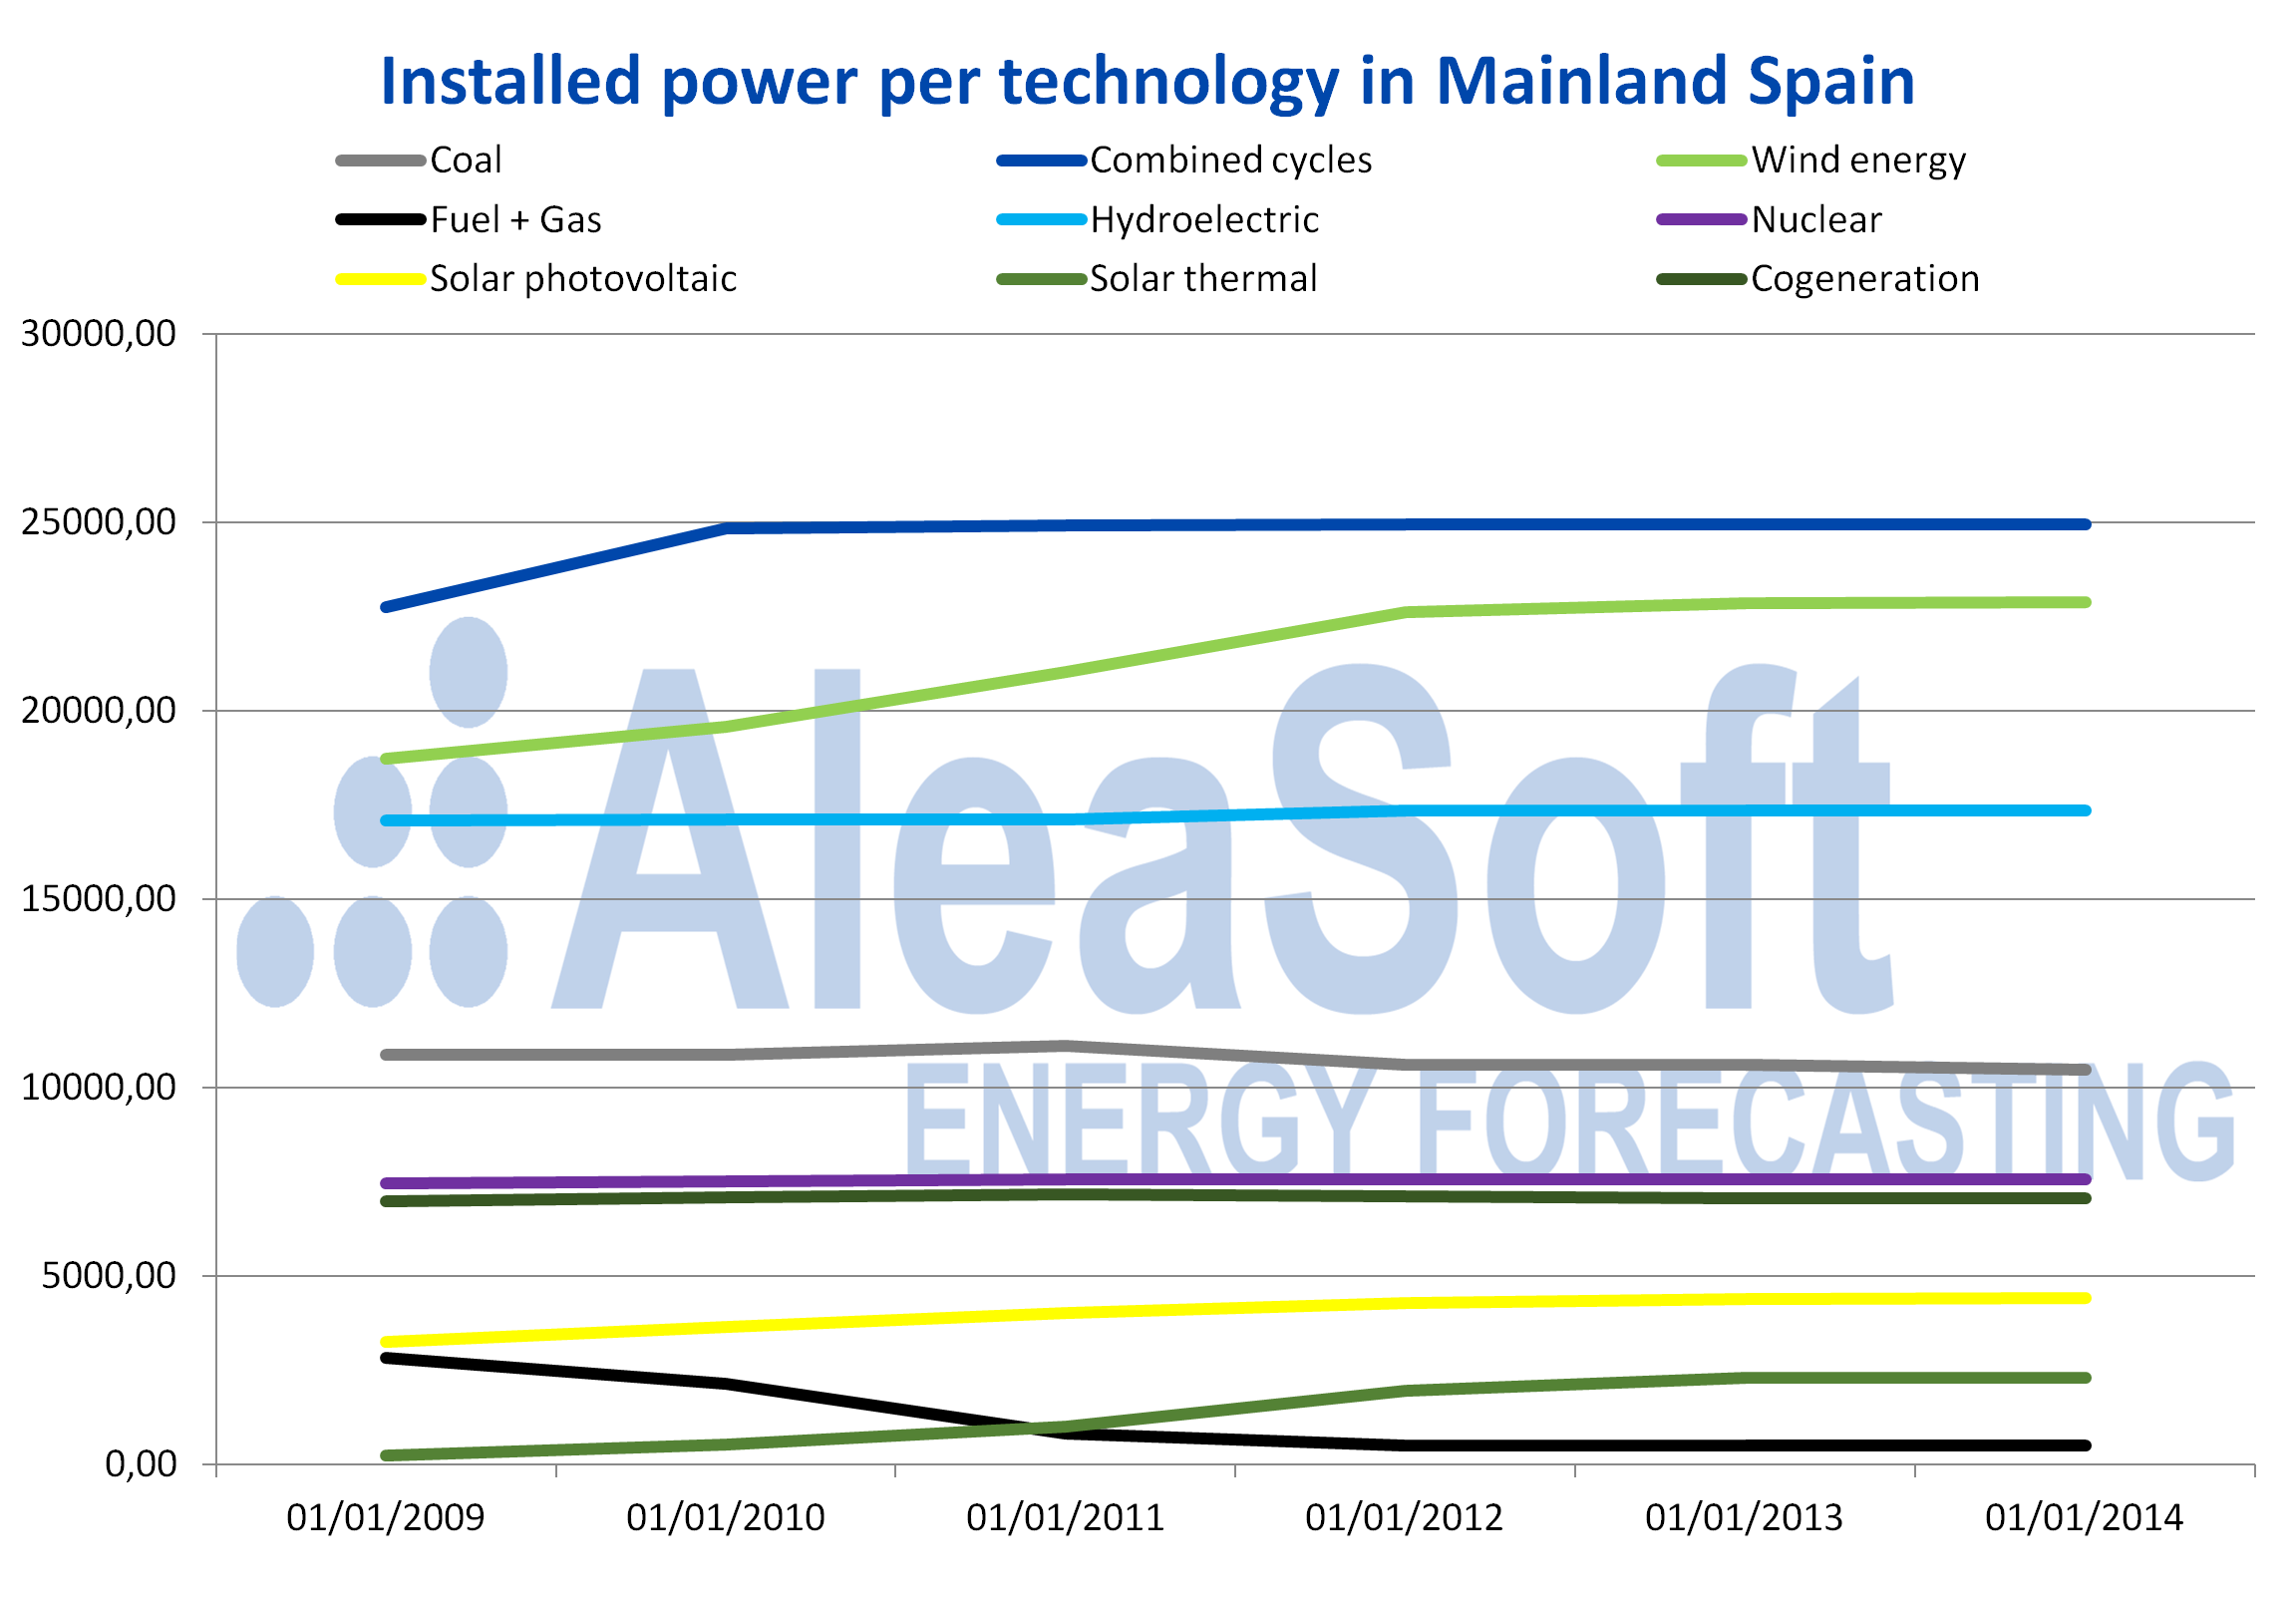
Source: Prepared by AleaSoft using data from REE.
Regarding the production by technologies, relevant data can be observed. On the one hand, the sharp drop in the energy production with combined cycle gas turbines, which in three years went from being the main source of electricity generation to being the sixth, only above the still incipient solar energy production. The decrease in the production with combined cycle gas turbines is partly due to the reduction of the thermal gap due to the decrease in the demand and the increase in the production with renewable energy. The other factor that influenced the fall in the gas production was the rise of the price of gas, making coal more competitive, which together with CO2 emissions had price declines during this period.
On the other hand, since 2011, the generation with fuel plus gas stopped participating in the Spanish peninsular mix. During this period, the nuclear energy was the main source to satisfy national demand and the fall in the combined cycle gas turbine production gave the second place to the wind energy.
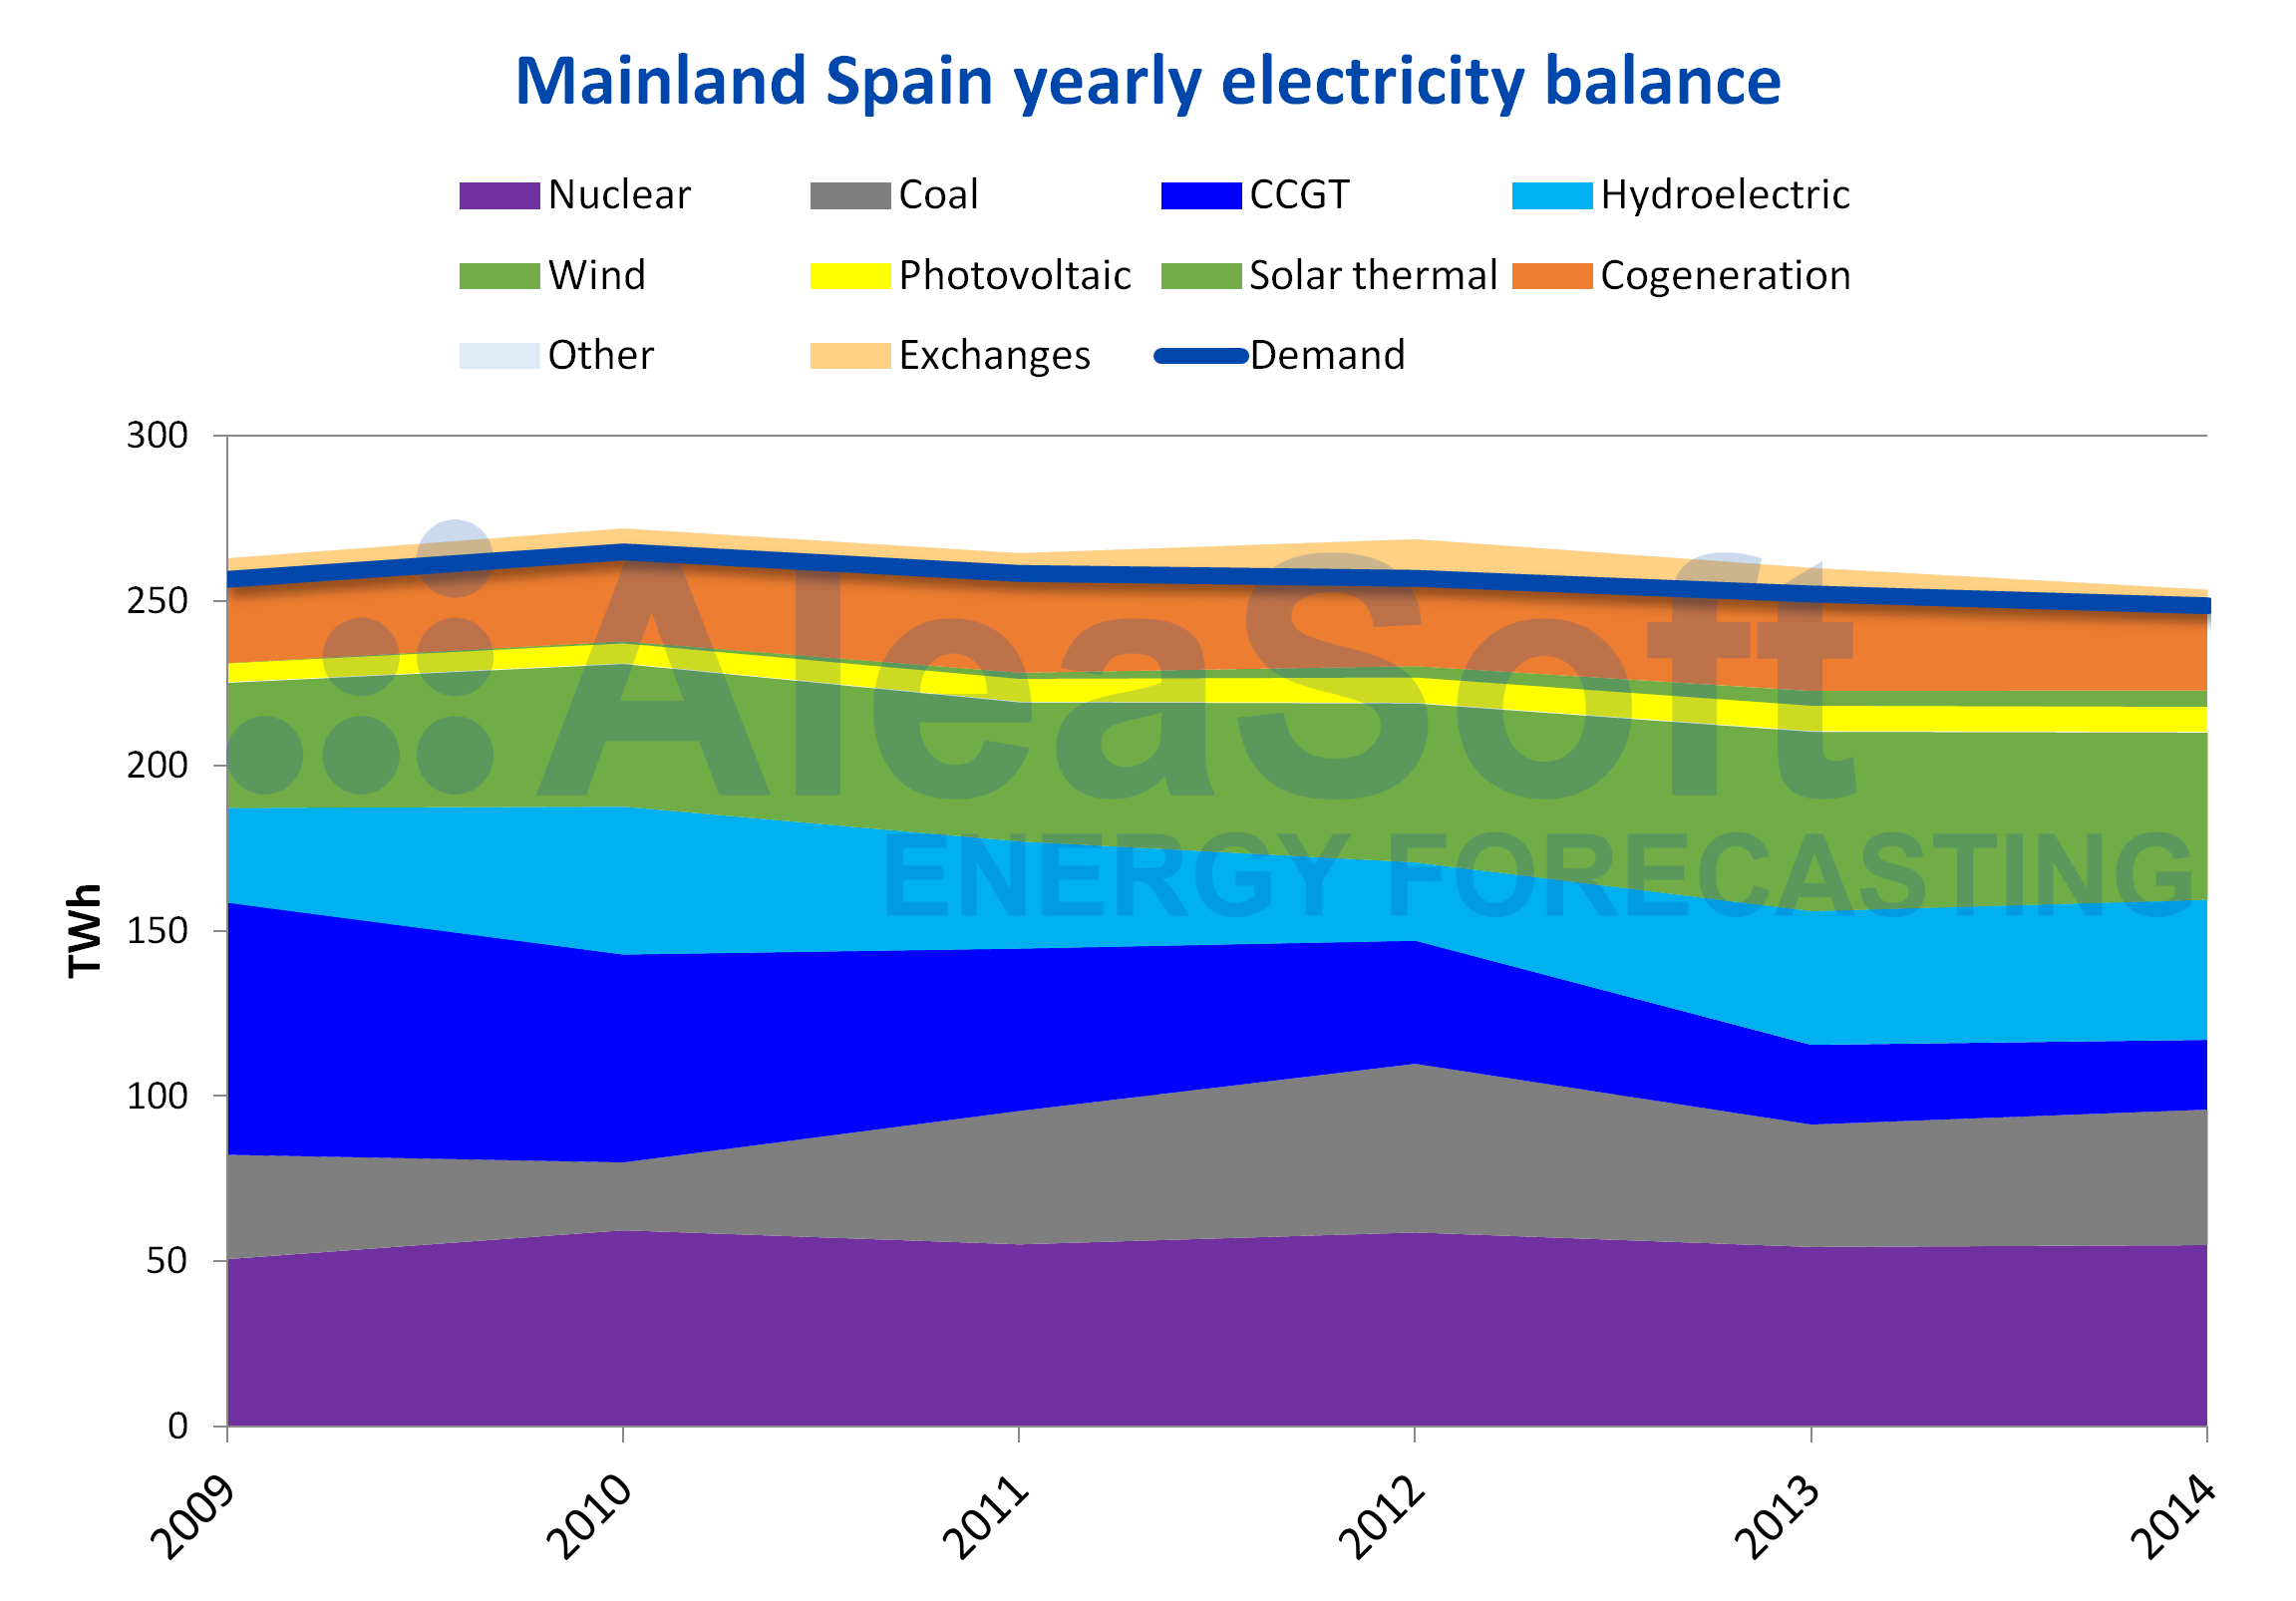
Source: Prepared by AleaSoft using data from REE.
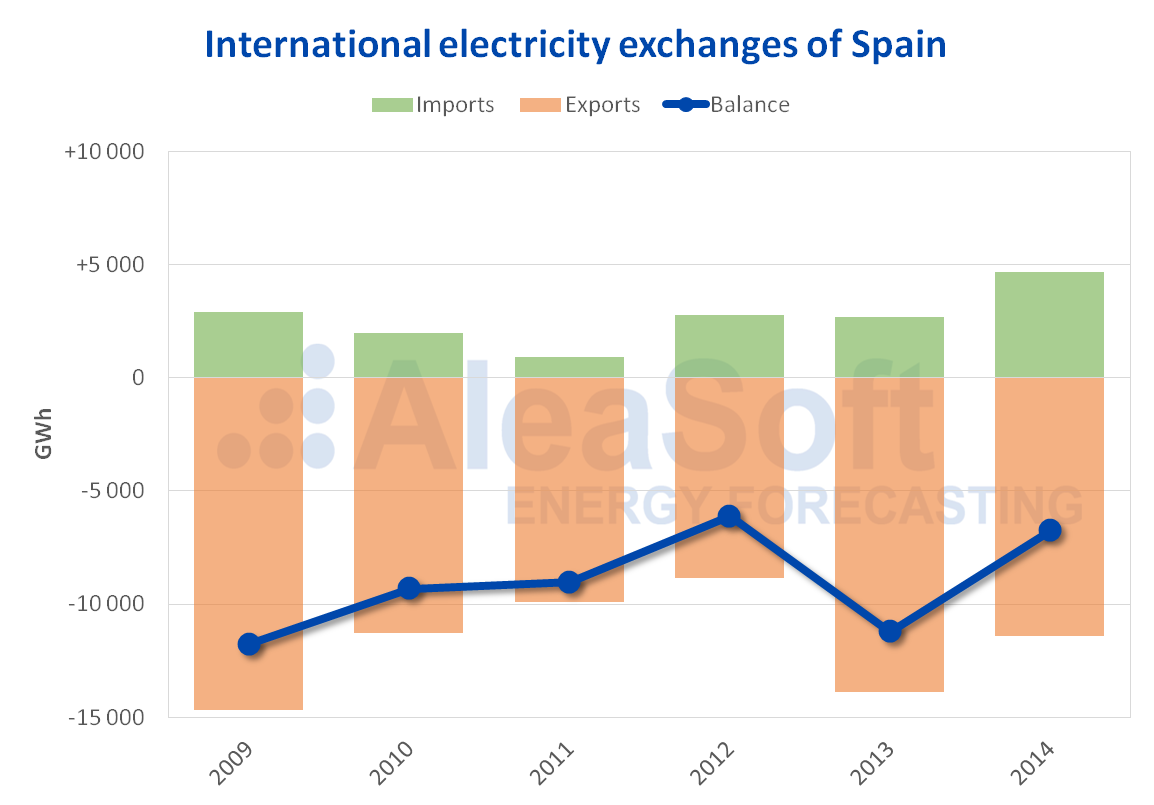
International exchanges and exchanges with the Balearic Islands
During the period from 2009 to 2014, the international energy exchanges of the electricity system of Mainland Spain were characterised as being clearly exporters.
Source: Prepared by AleaSoft using data from REE.
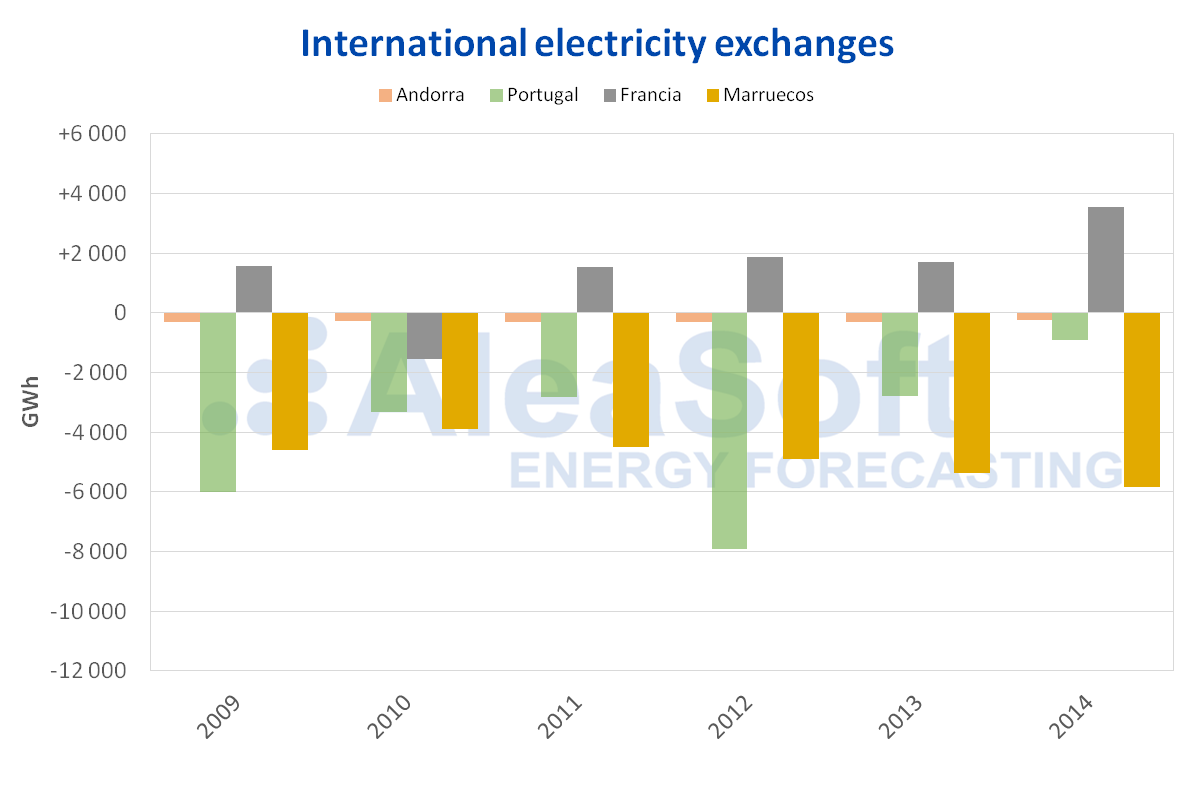
This export behaviour in the exchanges had its explanation in the increase of the export volume to Morocco, which exceeded the volume of exchanges between Spain and France during the whole period. The export volumes to Portugal were also high during this period, although since 2012 this volume was decreasing to 9% of the total exchanges in 2014.
Source: Prepared by AleaSoft using data from REE.
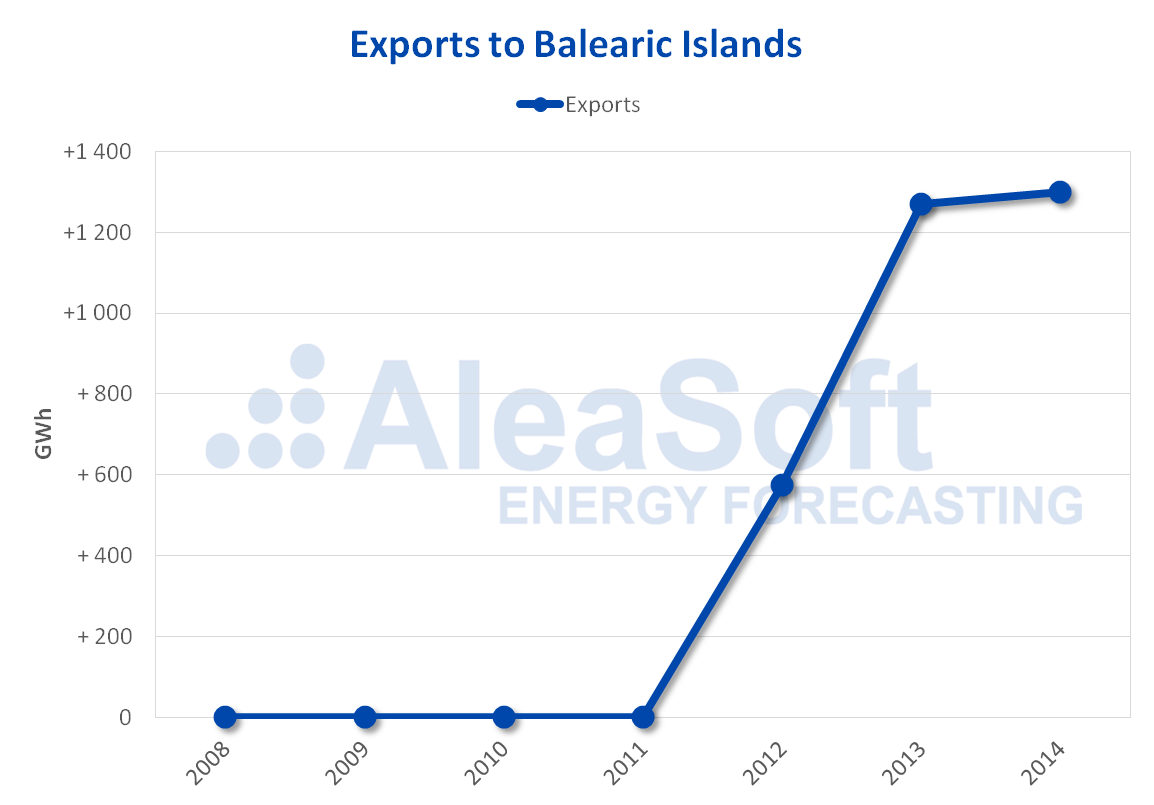
In August 2012, the submarine link for the transport of electricity between the peninsula and the island of Mallorca was put into operation. The exchange between the peninsula and the Balearic Islands was clearly exporter during this period and since its commissioning it was gradually increasing until reaching the maximum volume of exports in 2014.
Source: Prepared by AleaSoft using data from REE.
Brent, fuels and CO2
The Brent oil started the 2009‑2014 period with a decrease in the annual average price of 37% compared to 2008, registering a value of $61.49/bbl in 2009, which was the minimum for this period. However, in 2010 the average price recovered, reaching $79.52/bbl, which represents an increase of 29% compared to 2009. In 2011, the greatest variation in the average price of this period was recorded with a rise of 40%, to $111.24/bbl. This upward trend continued until 2012, when the maximum average price of this period was reached with a value of $111.72/bbl. Subsequently, in 2013, the Brent oil prices began a downward trend, which remained the following year, ending the period with an annual average price of $99.02/bbl in 2014.
The TTF gas started the 2009‑2014 period with an annual average price of €12.28/MWh, 49% lower than in 2008, with the year 2009 being the one with the lowest price in this period. As of 2010, the price rose continuously until reaching its maximum value for this period, of €26.88/MWh, in 2013. In 2014, the price behaviour changed, and the average value was €20.91/MWh, 22% lower than the previous year and only 0.3% higher than the average for this period, of €20.85/MWh.
The API 2 coal, like Brent oil and gas, started the 2009‑2014 period with a significant price drop. The average value for the year 2009, of $70.96/t, was 51% lower than the value corresponding to the year 2008, of $144.15/t. The following years, the prices increased again, but the upward trend ended earlier than for Brent oil and gas. In 2011 the maximum annual average price of the analysed period was reached, of $119.92/t. Subsequently, the prices began to decrease and this trend continued until 2014, when the annual average price was $75.35/t, 16% lower than the average for the period analysed, of $89.93/t.
The prices of the CO2 emission rights had an average value in 2009 of €13.33/t, 40% lower than in 2008, of €22.38/t. The annual average price increased the following year by 8.4%, reaching €14.45/t, the maximum annual average price for the period 2009‑2014. But the following three years there were decreases in the annual average CO2 emission rights prices. The greatest variation occurred in 2012, with a decrease of 43% compared to the previous year, followed by that of 2013, which was 40%. In that year 2013 the minimum annual average price of the analysed period was reached, with a value of €4.52/t. In 2014, the prices recovered, increasing by 33% compared to 2013, with an average price of €6.01/t. During the analysed period, the second phase of the European Emissions Trading System (EU ETS) was developed between 2008 and 2012, and the third phase began in 2013. During the second phase, the prices fell due to the crisis and the increase in the renewable energy production and the energy efficiency. The beginning of the third stage was marked by the oversupply of EUAs that were available from the second phase, which favoured the decrease in prices.
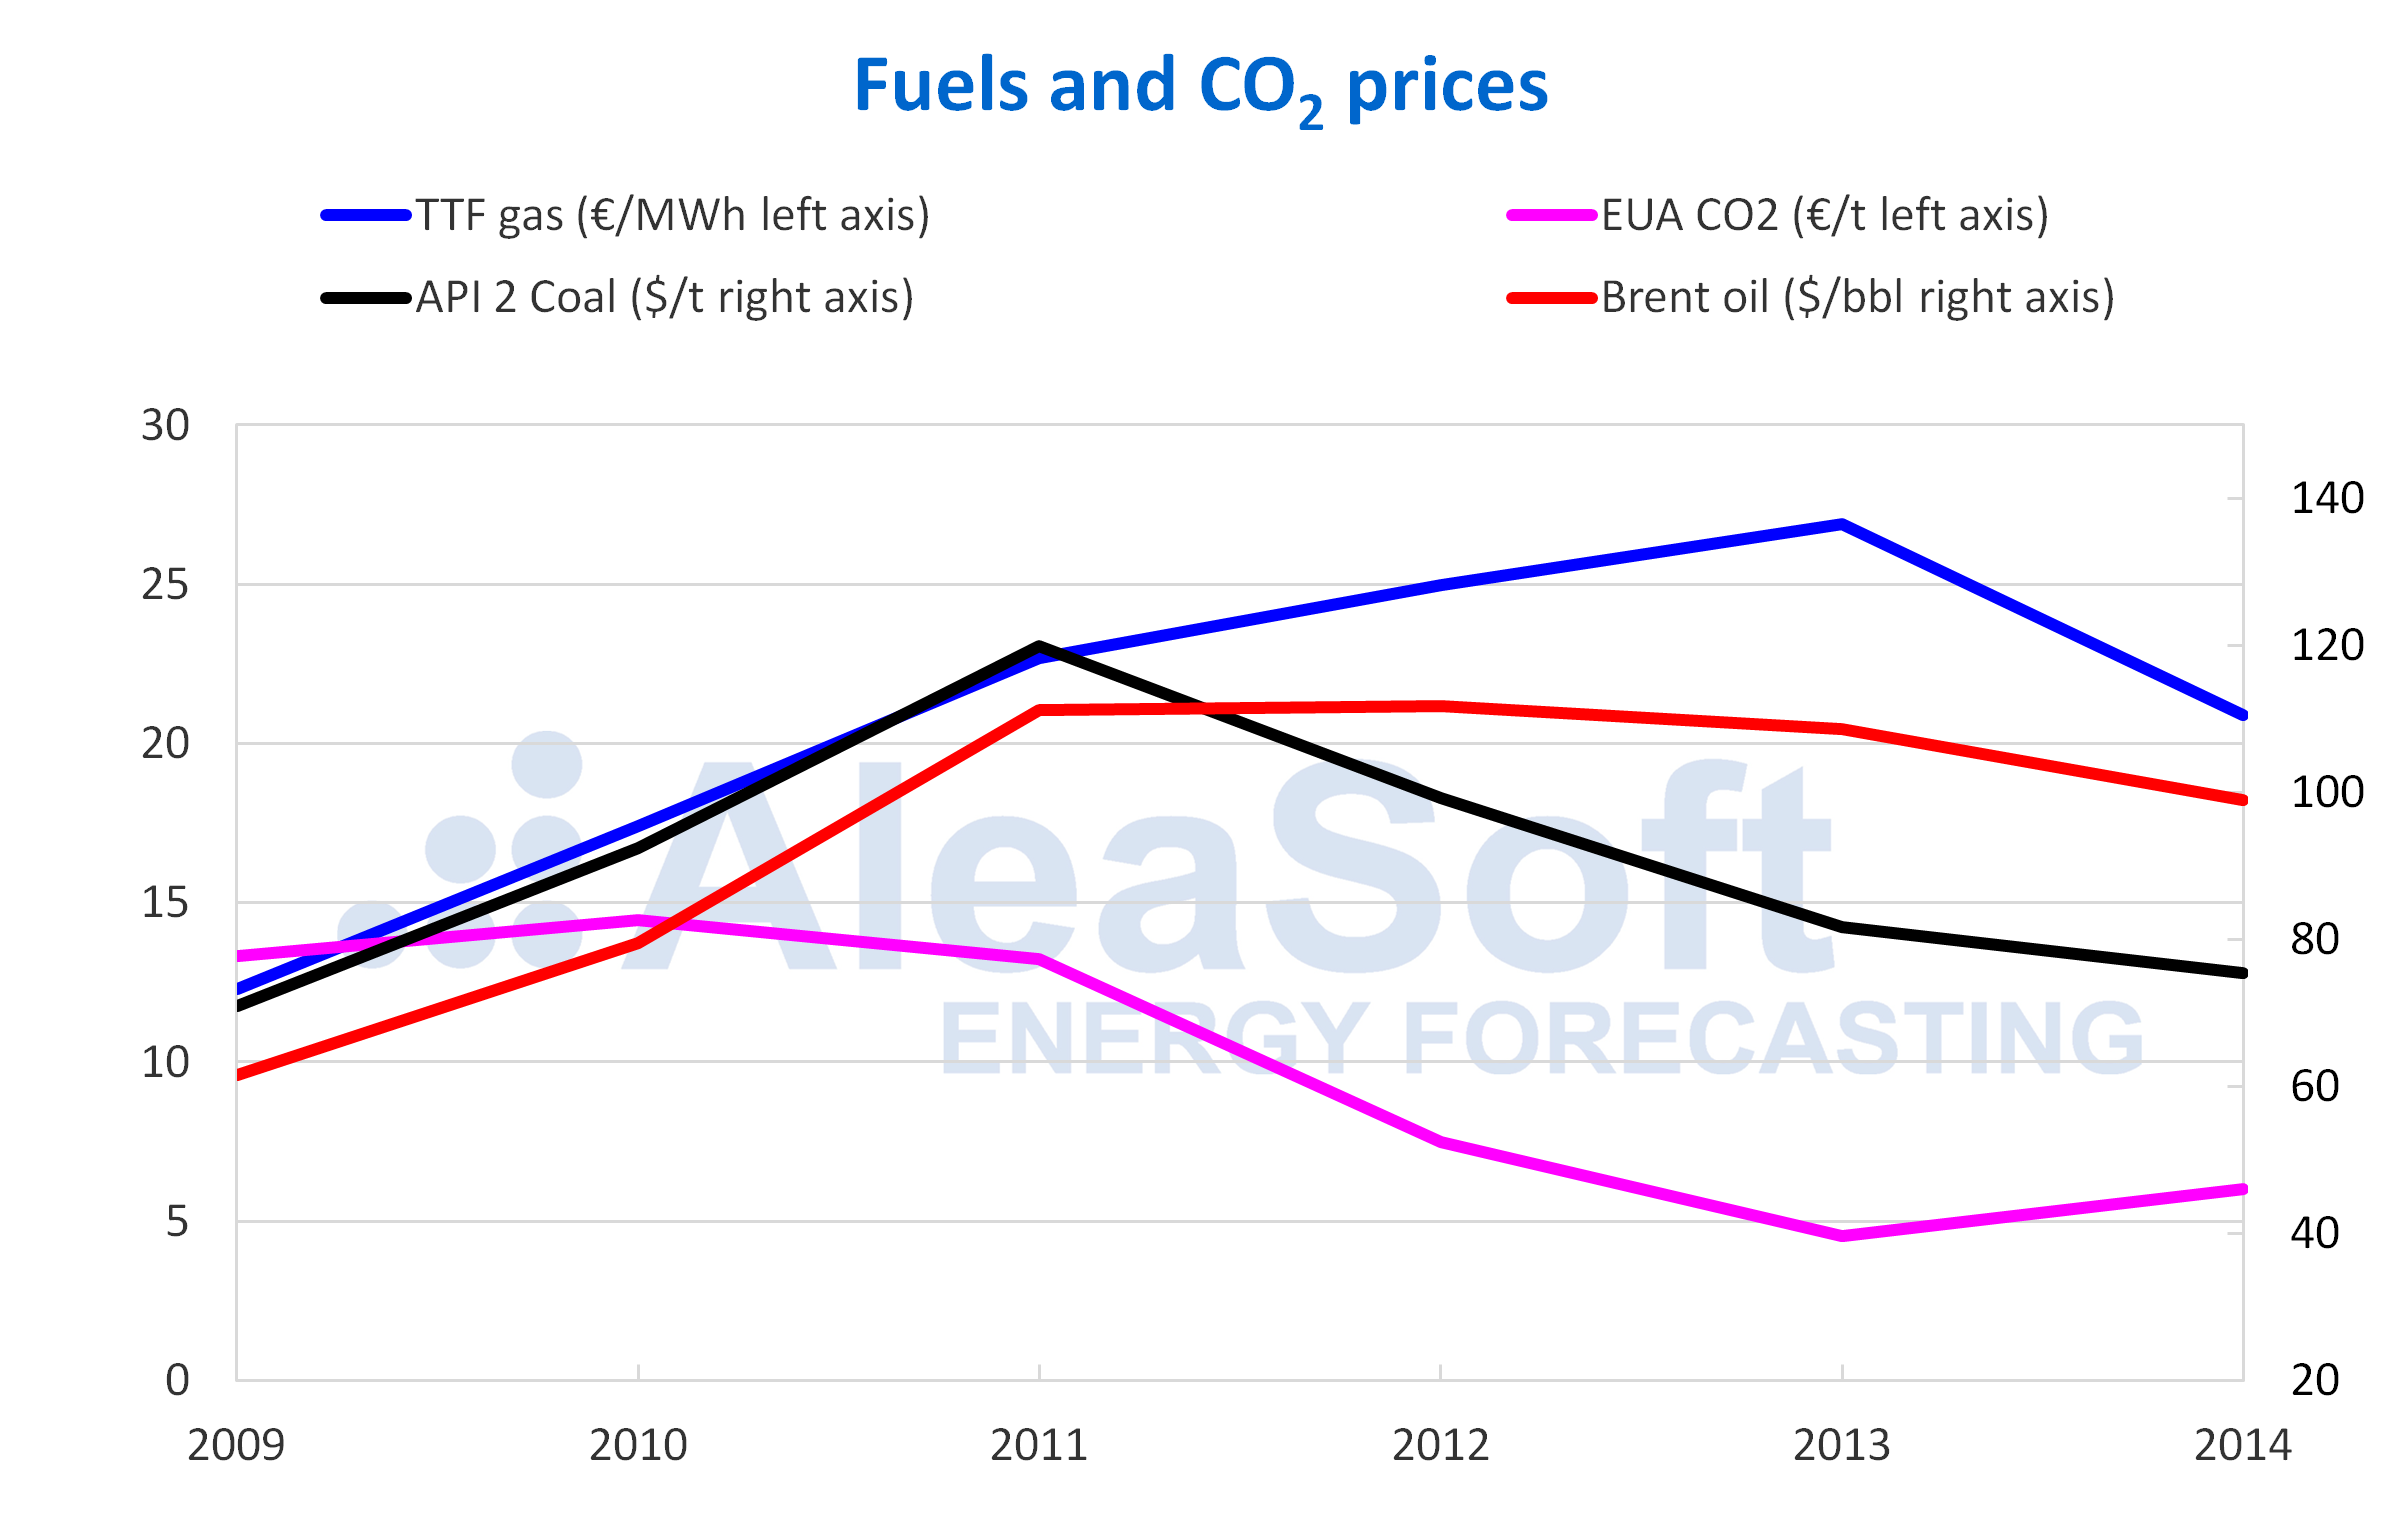
Source: Prepared by AleaSoft using data from NetConnect Germany, PEGAS, EEX, ICE, EIA.
The Spanish electricity market during the crisis
This second stage of the Spanish electricity market, which goes from the beginning of the economic crisis to the first signs of recovery, can be summed up as a period where the growth maintained during the previous stage was halted. The main factor was the fall in the electricity demand during this period, due to the economic crisis. Another factor was the entry into the market of more renewable energy, both wind and solar energy, which offer at lower prices than the other more polluting technologies, fuel, gas and coal, which were displaced in this period.
In the next part of this series of articles on the Spanish electricity market, the recovery of the market and the electricity demand after the economic crisis, the rise of renewable technologies in recent years and the launch of a new interconnection with France, which favoured the coupling of the Spanish market with the rest of the European markets, will be analysed.
Source: AleaSoft Energy Forecasting.