AleaSoft, October 1, 2020. The prices of all European electricity markets in the third quarter rose significantly compared to those of the second quarter. The recovery in demand and gas prices, the high CO2 prices, as well as lower wind and solar energy production in some markets are the main causes of the increase. However, in some markets, the prices were below those of the same quarter of the previous year. The Brent rose in July and August but it fell in September.
Photovoltaic and solar thermal energy production and wind energy production
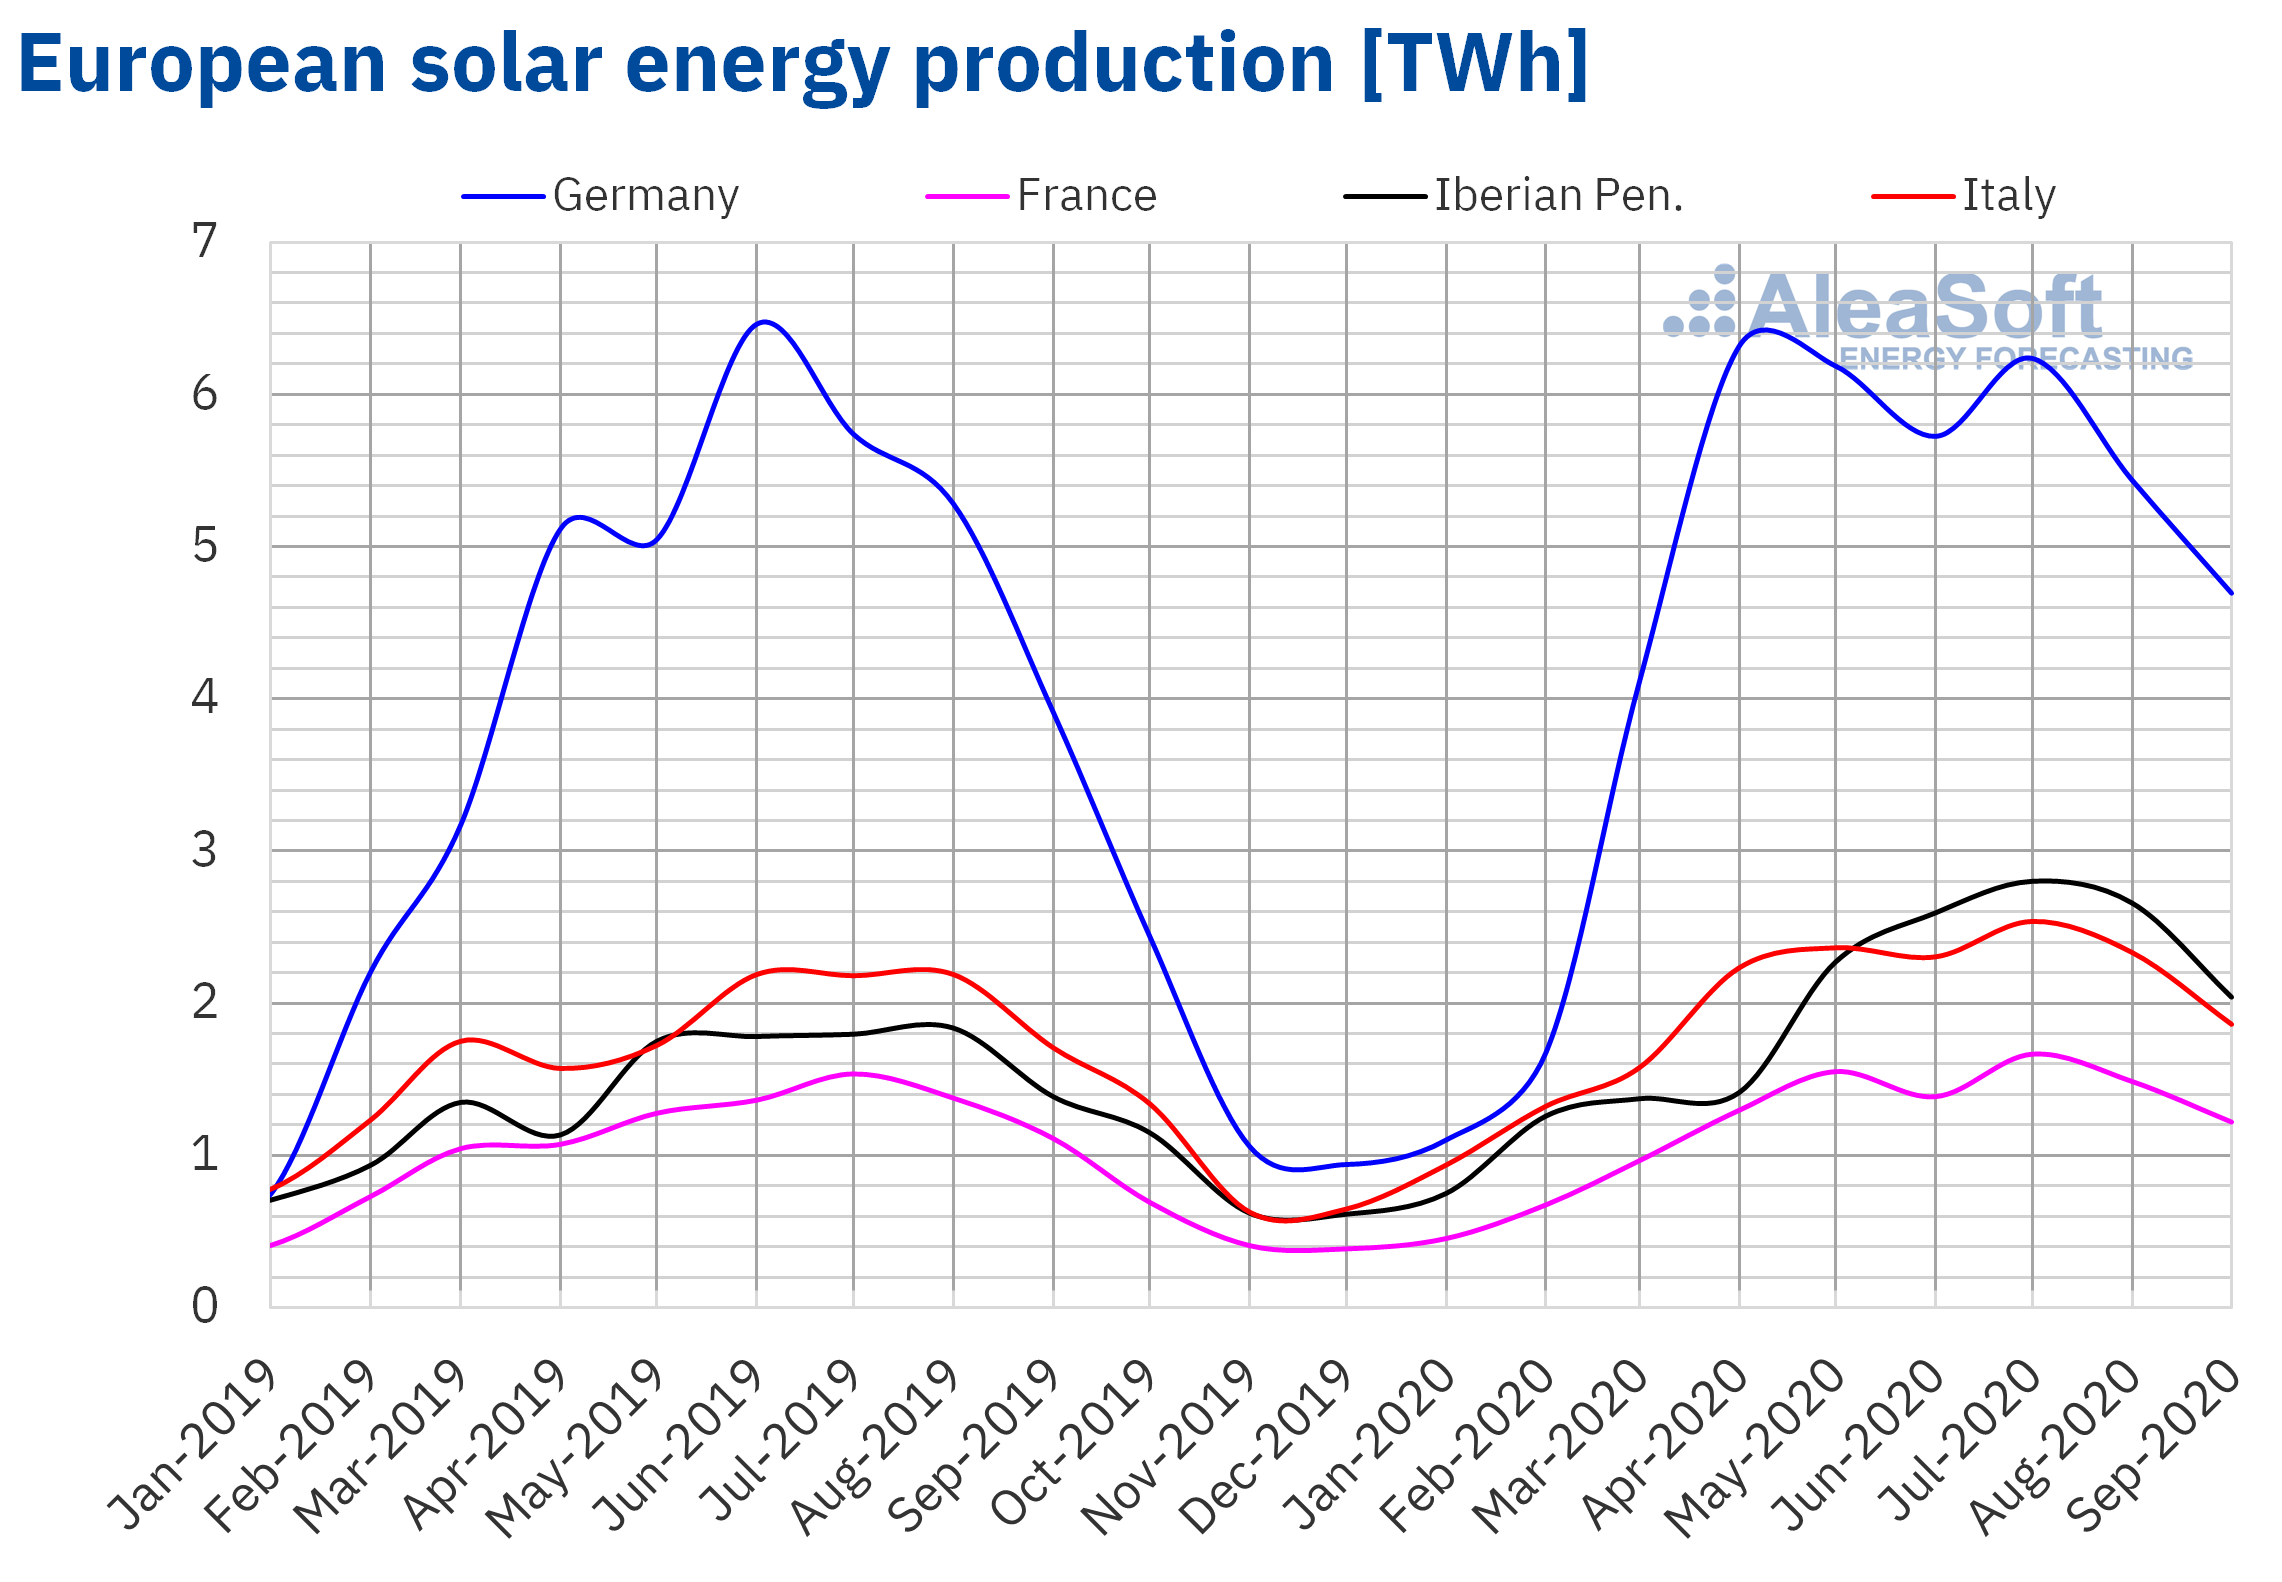
The solar energy production during the third quarter of 2020 increased in all the European markets analysed at AleaSoft compared to the same quarter of 2019. The highest year‑on‑year growth was 49% and was registered in the Iberian Peninsula. In the rest of the markets, the solar energy production during this period grew between 8.6% of the French market and 11% of the Italian market.
On the other hand, the solar energy production during the third quarter of the year only grew in the Iberian Peninsula when compared to the second quarter of this year. The increase in the peninsula was 16%, while the solar energy production fell 13% in Germany and 4.3% in the Italian market. In the French market, the production remained similar to that of the previous quarter.
 Source: Prepared by AleaSoft using data from ENTSO-E, RTE, REN, REE and TERNA.
 Source: Prepared by AleaSoft using data from ENTSO-E, RTE, REN, REE and TERNA.
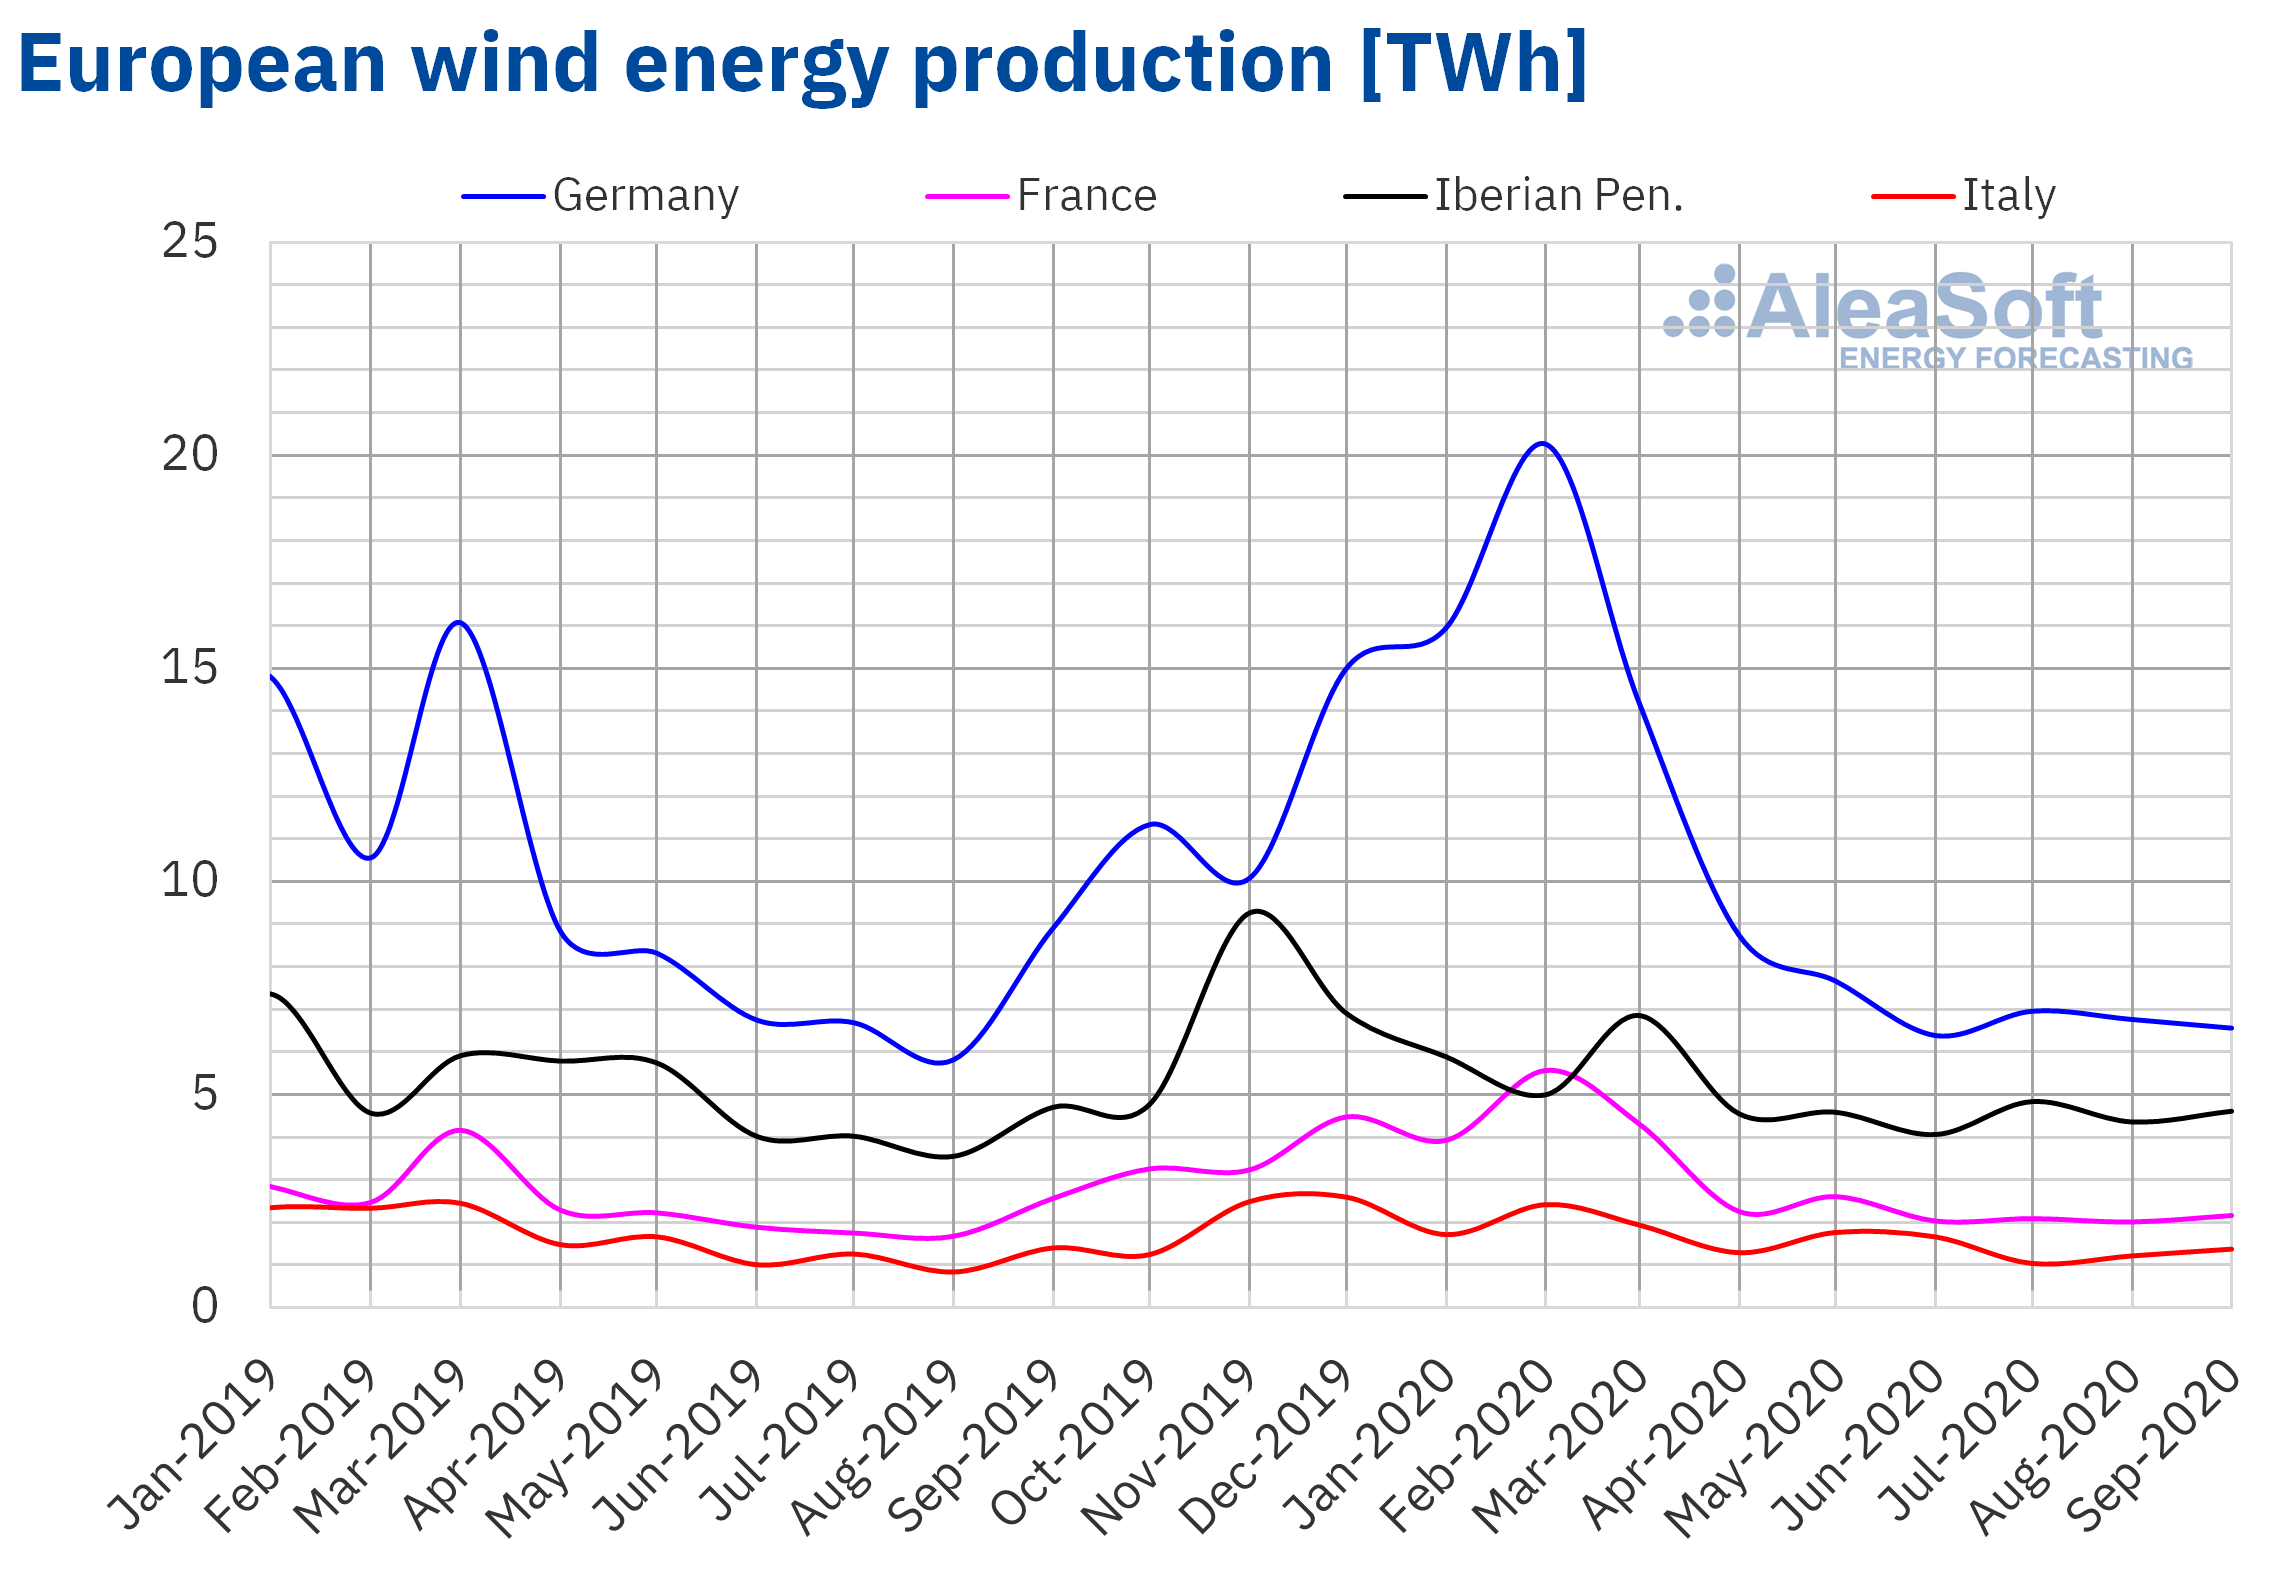
In the case of the wind energy production, there was a 5.3% decline in the German market during the third quarter of 2020 compared to the third quarter of 2019. On the contrary, in the Iberian Peninsula it increased by 13%, while in France and Italy the production with this technology grew 4.6% and 3.3% respectively.
In the analysis of the wind energy production during the third quarter of 2020 compared to the second quarter of the same year, there was a setback in most of the markets analysed at AleaSoft. The exception was the Iberian Peninsula where a slight increase of 1.2% was registered. In the rest of the markets the variation during this period was between ‑26% of the Italian market and ‑12% of the French market.
 Source: Prepared by AleaSoft using data from ENTSO-E, RTE, REN, REE and TERNA.
Electricity demand
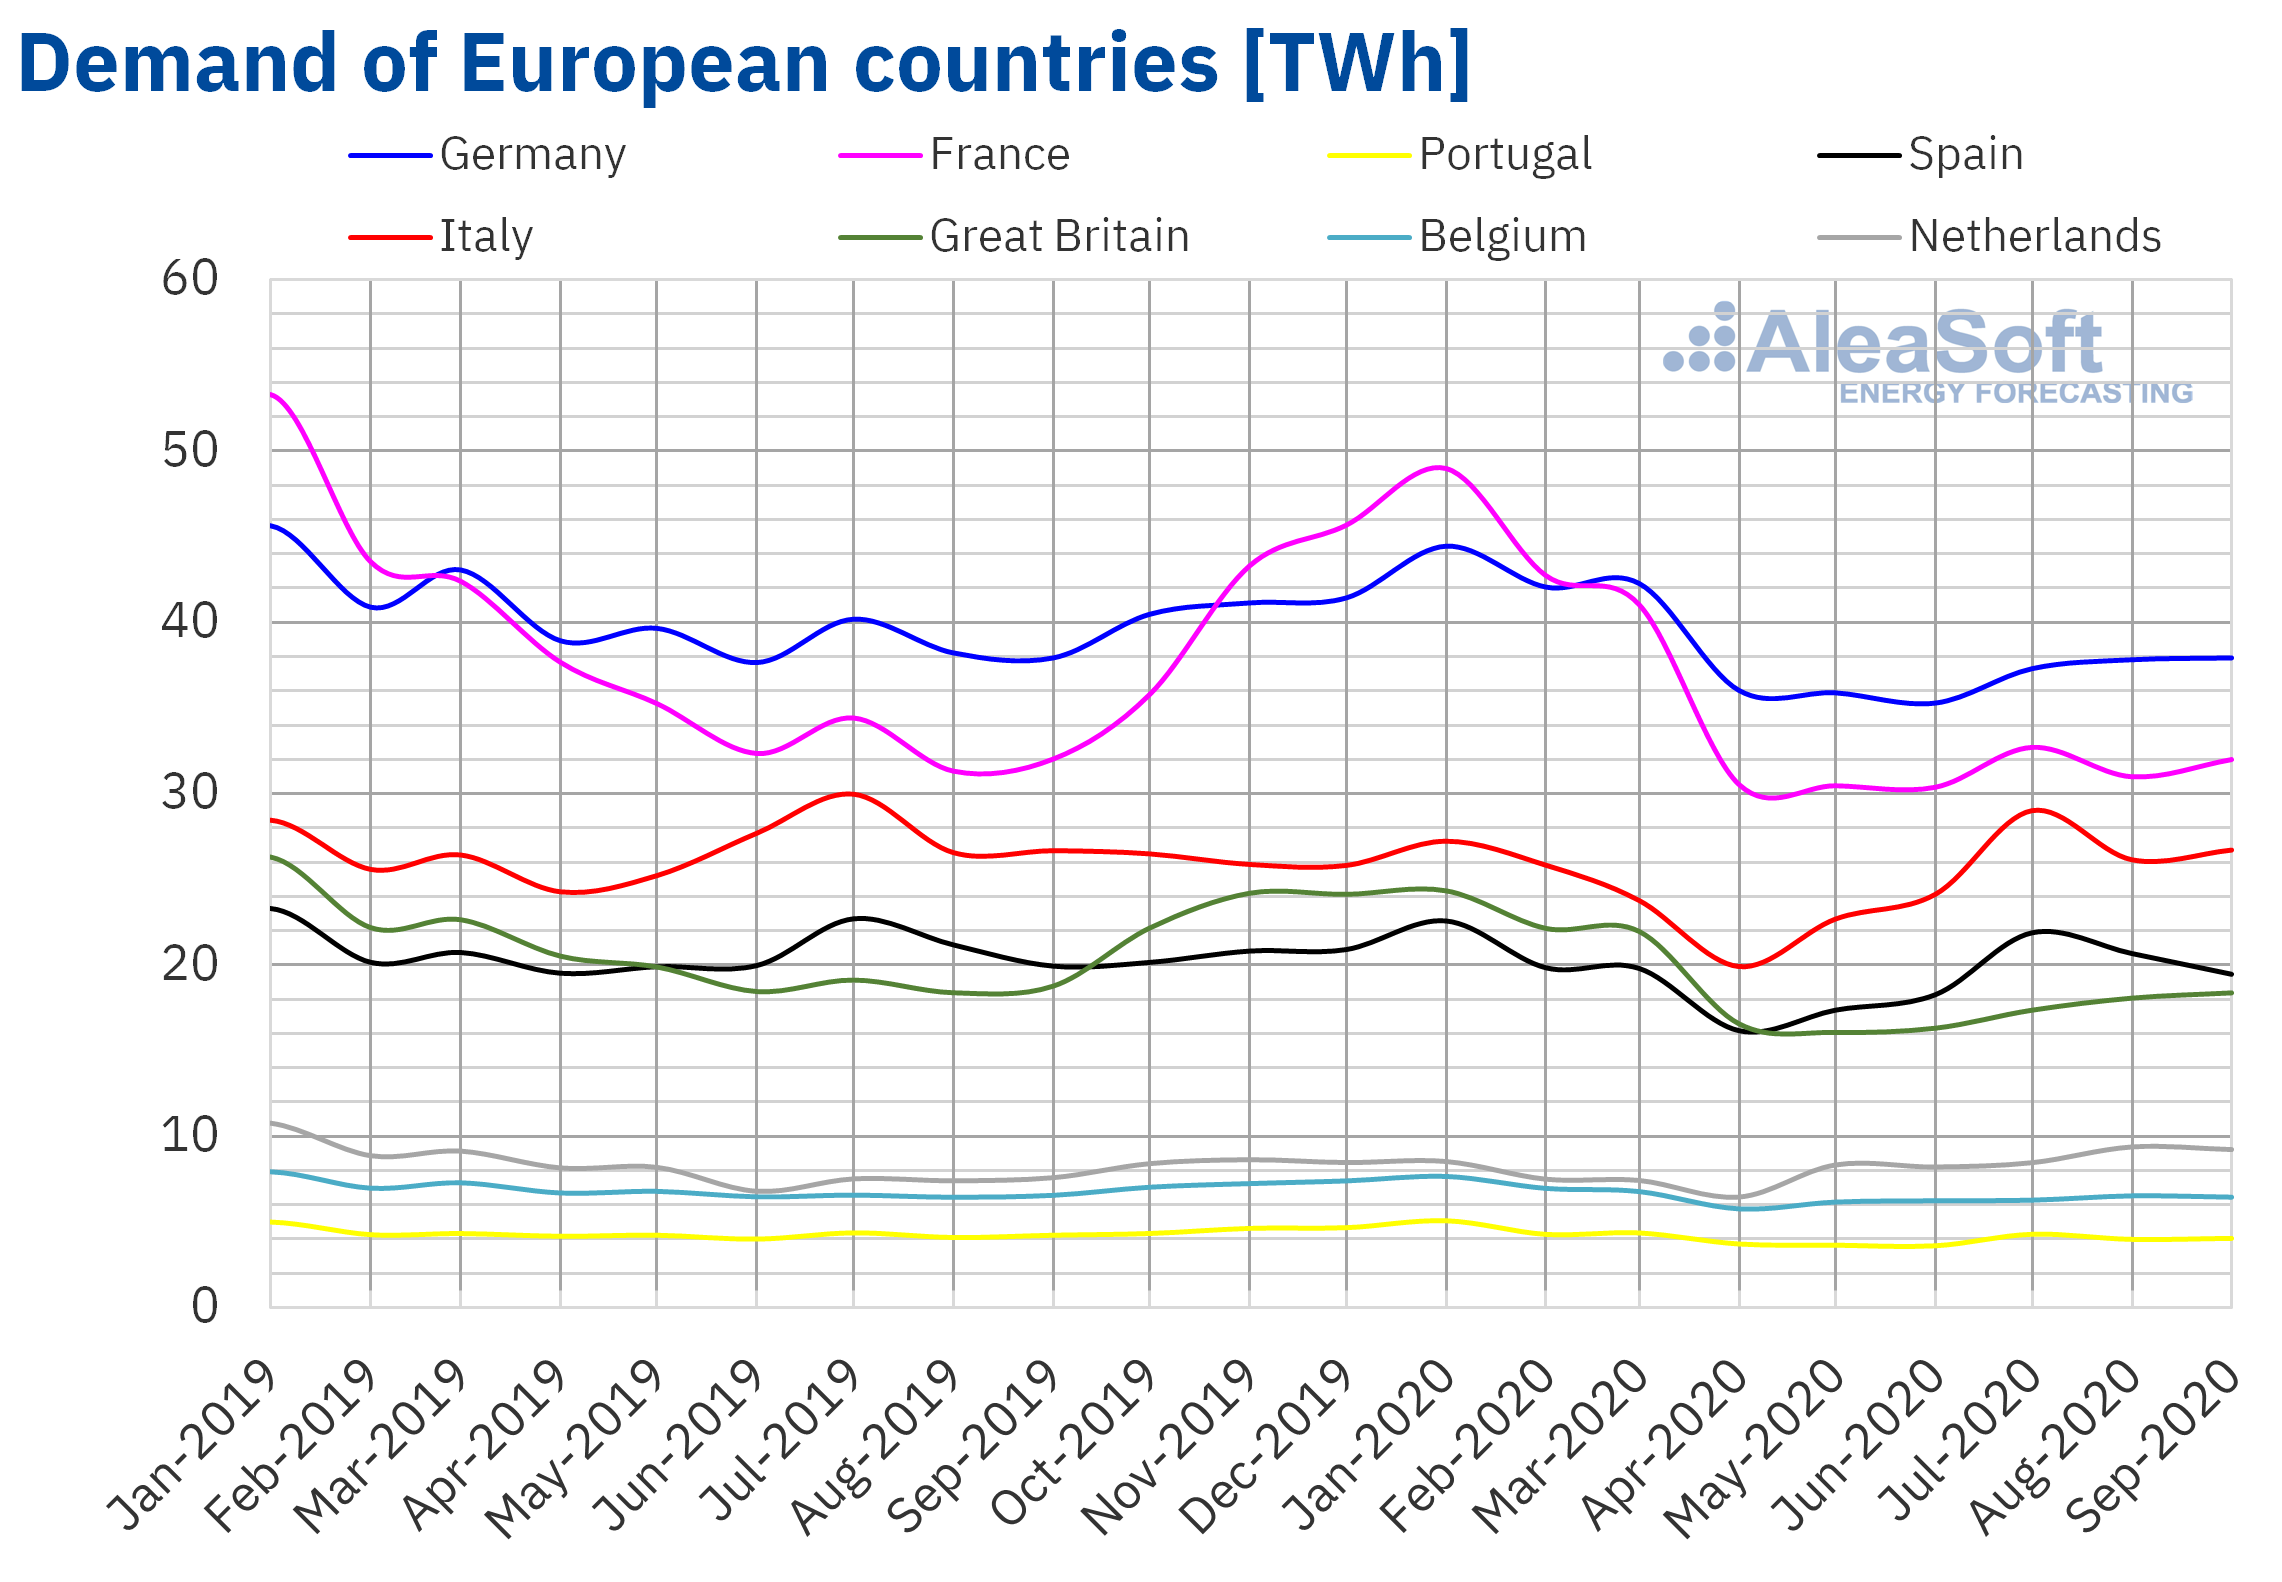
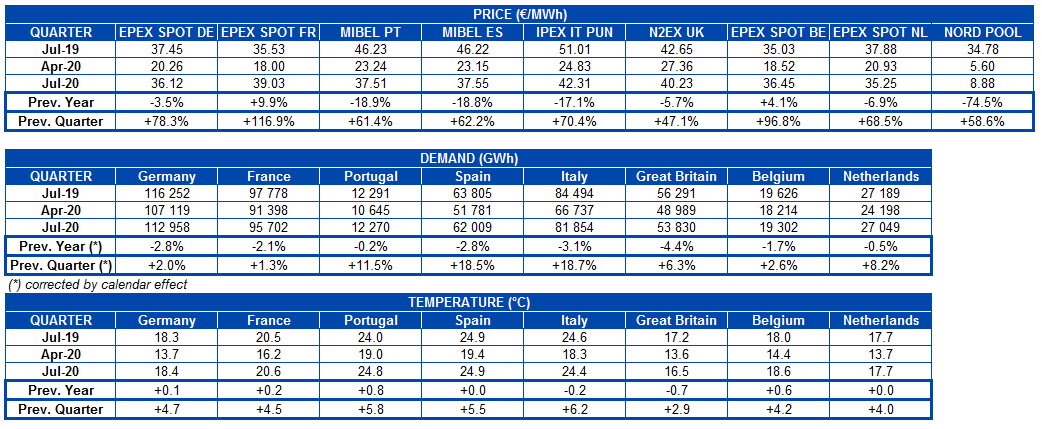
The third quarter of 2020 closed with a decrease in electricity demand in all European markets compared to the same quarter of 2019. In general, the values of each market were closer to their corresponding values of 2019 than in the previous two quarters of 2020, which were more affected by the crisis caused by the COVID‑19 pandemic. The temperatures were in general similar in year‑on‑year terms, with growths below 1.0 °C in all the analysed markets. The variations in demand that stand out the most were that of Great Britain, of 4.4%, and that of Italy, of 3.1%. In the markets of Germany and France the decreases were 2.8% and 2.1% respectively. On the other hand, the markets of Belgium, Portugal and the Netherlands registered lower changes than the rest, with decreases of 1.7%, 0.5% and 0.2% respectively.
When analysing the period from July to September 2020 compared to the previous quarter, the recovery of the demand in all European markets was notable, influenced by the rise in temperatures and the relaxation of the confinement measures due to COVID‑19. Such they were the cases of Italy and Spain, two of the European countries most affected by the coronavirus, which registered increases in demand in this third quarter of the year of 19% and 18% respectively. In Portugal there was an increase of 12% and in Great Britain of 6.3%. The smallest increases occurred in the markets of Belgium, Germany and France, which registered increases of 2.6%, 2.1% and 1.3%.
 Source: Prepared by AleaSoft using data from ENTSO-E, RTE, REN, REE, TERNA, National Grid and ELIA.
Mainland Spain, photovoltaic and solar thermal energy production and wind energy production
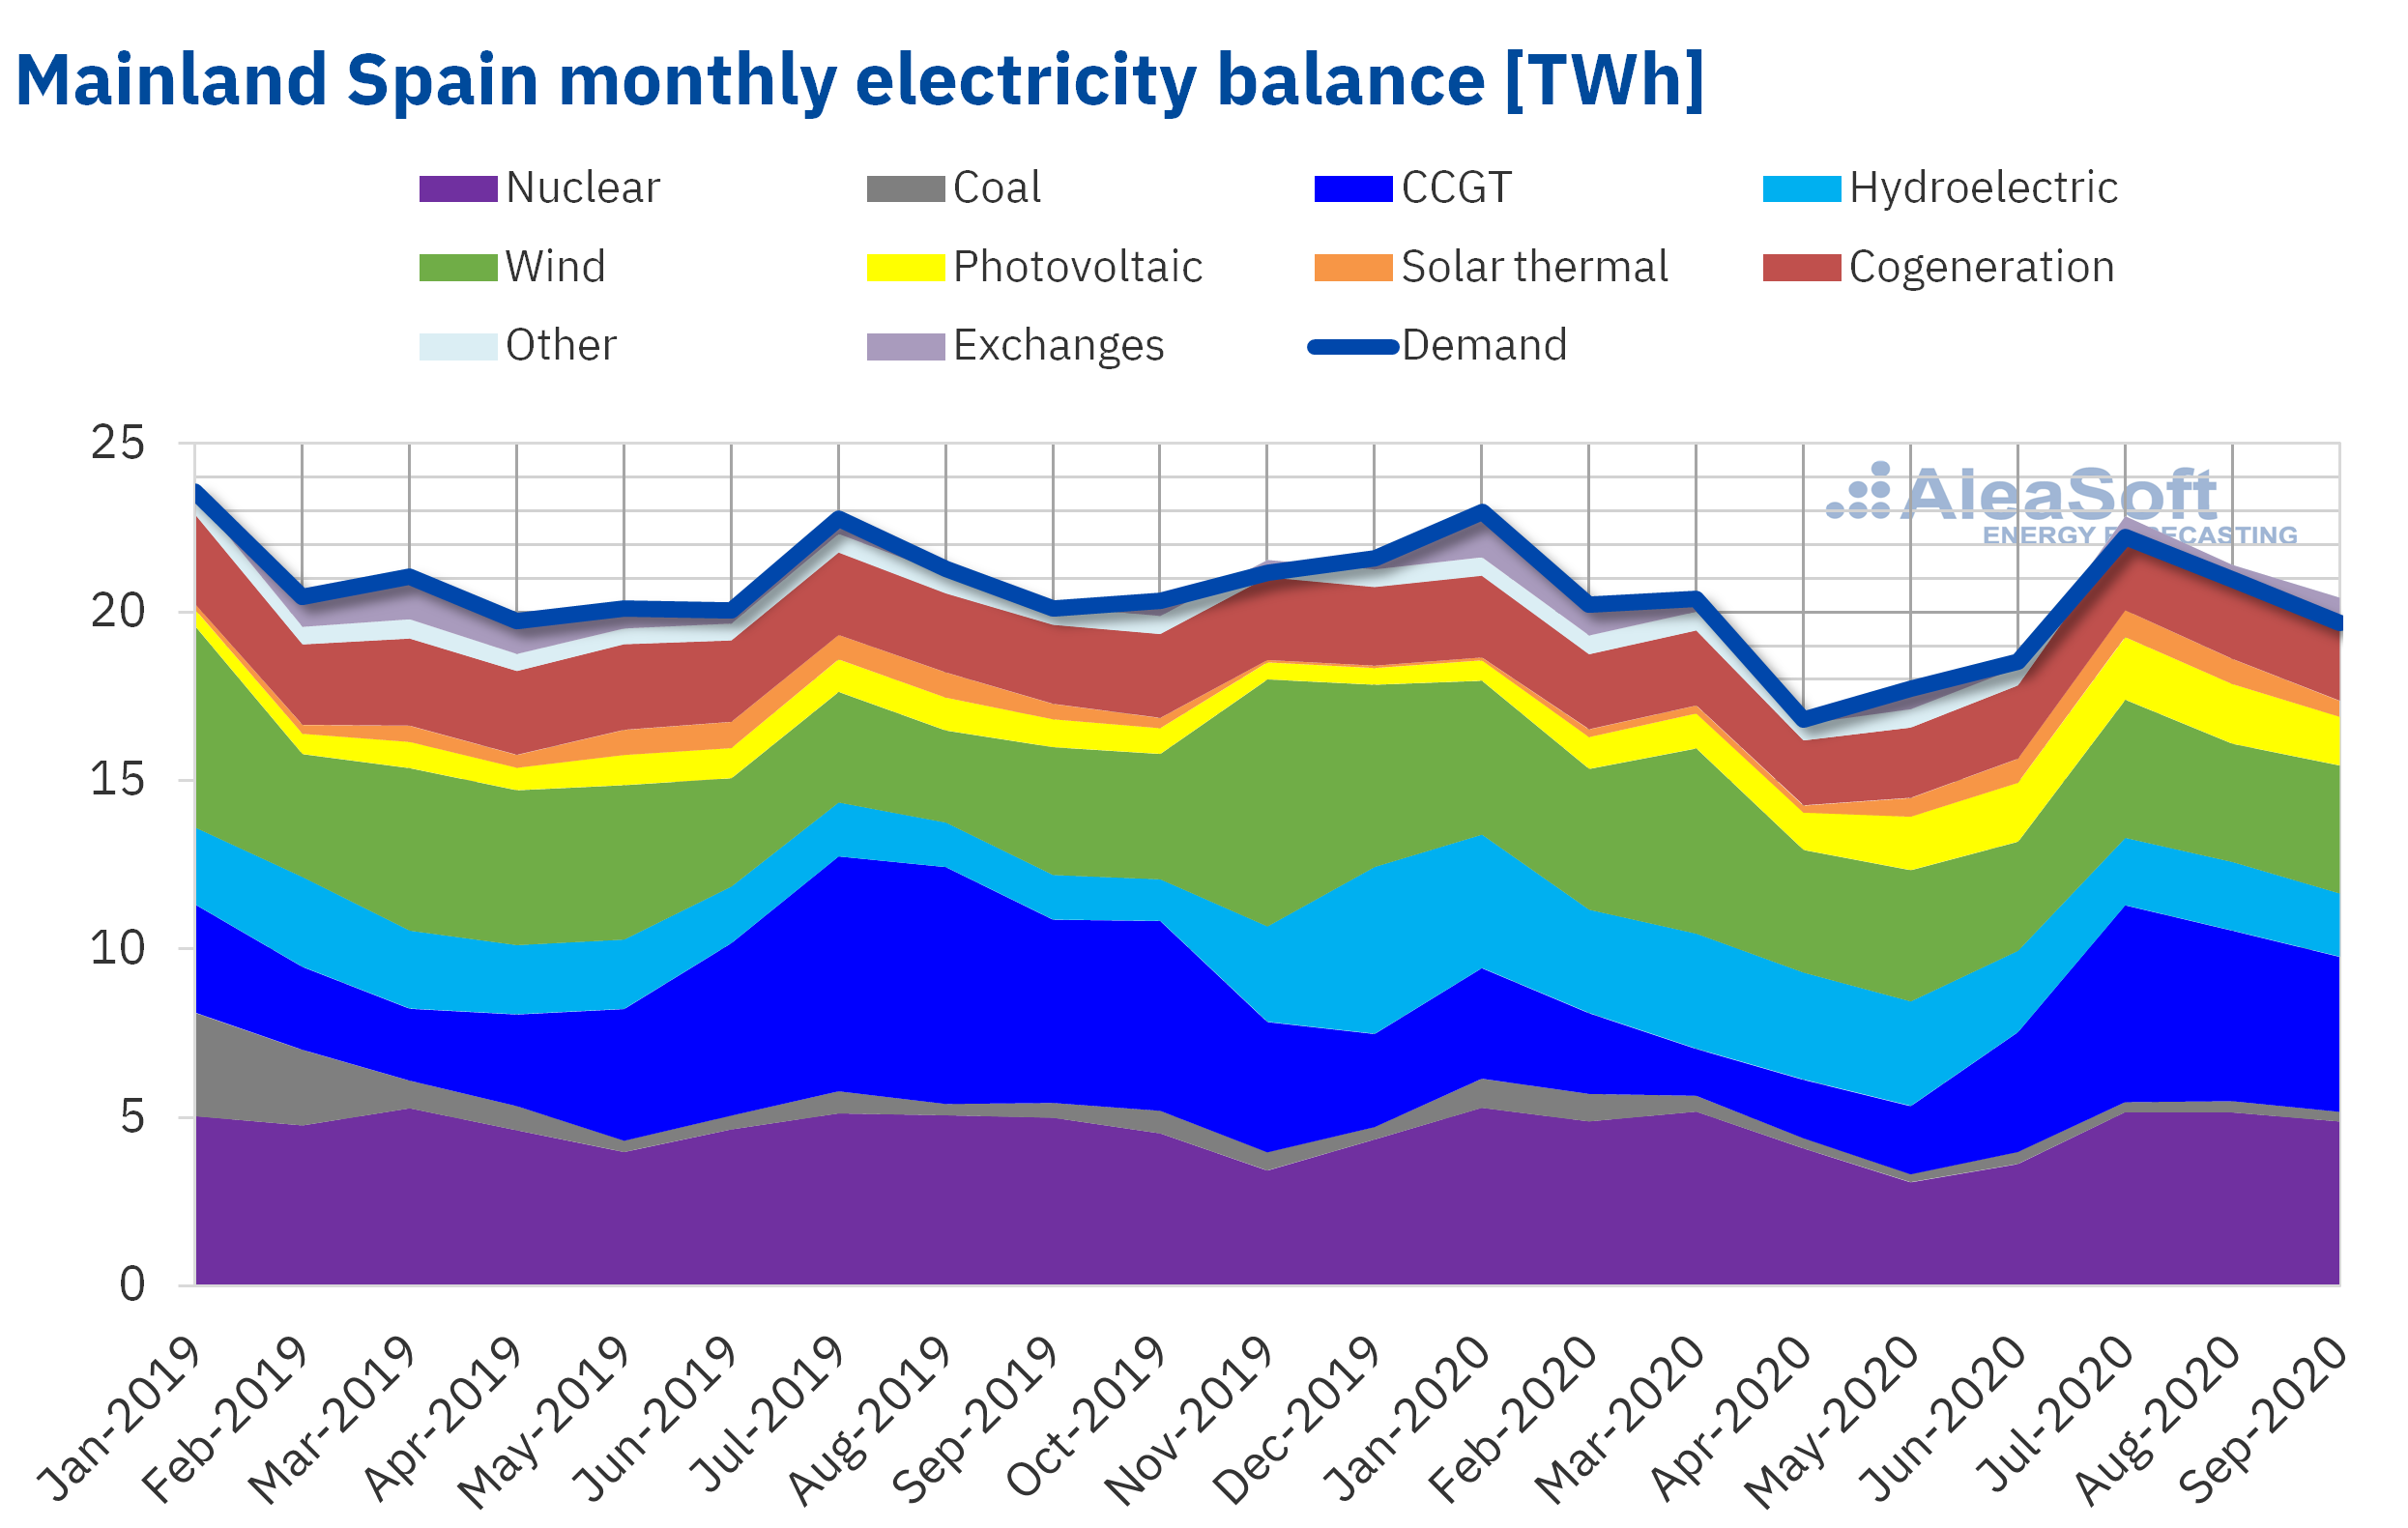
In Mainland Spain, the electricity demand of the third quarter of 2020 registered a 2.8% drop in year‑on‑year terms. In the comparison of the second and third quarters of 2020, the demand had a jump of 18%.
The solar energy production of Mainland Spain, which includes the photovoltaic and solar thermal technologies, increased by 51% during the third quarter of 2020 compared to the same quarter of 2019 and by 18% compared to the second quarter of 2020.
The wind energy production increased by 16% in the period between July and September of this year compared to the third quarter of 2019, while compared to the second quarter of 2020 it increased by 4.7%.
The coal energy production continues to decline and during the third quarter of 2020 it was 35% lower than in the same quarter of the previous year, although compared to the second quarter of 2020 it increased by 1.0%. Regarding the combined cycle gas turbines, the production during the third quarter was reduced by 20% compared to the third quarter of 2019, however there was an increase of 110% compared to that registered in the second quarter of 2020.
The nuclear energy production increased by 39% during the third quarter of 2020 compared to the previous quarter. This was due to the fact that in the past quarter several plants had scheduled shutdowns. However, if the production with this technology during the third quarter of the year is compared with the same quarter in 2019, the variation was only 0.1%.
On the other hand, the hydroelectric energy production increased by 33% during the third quarter of 2020 when compared to that of the same quarter of 2019, although it decreased by the same amount compared to the second quarter of 2020.
 Source: Prepared by AleaSoft using data from REE.
Between July 1 and September 30, the hydroelectric reserves decreased by 33% compared to the previous quarter. However, they increased by 31% compared to that accumulated at the end of September 2019.
European electricity markets
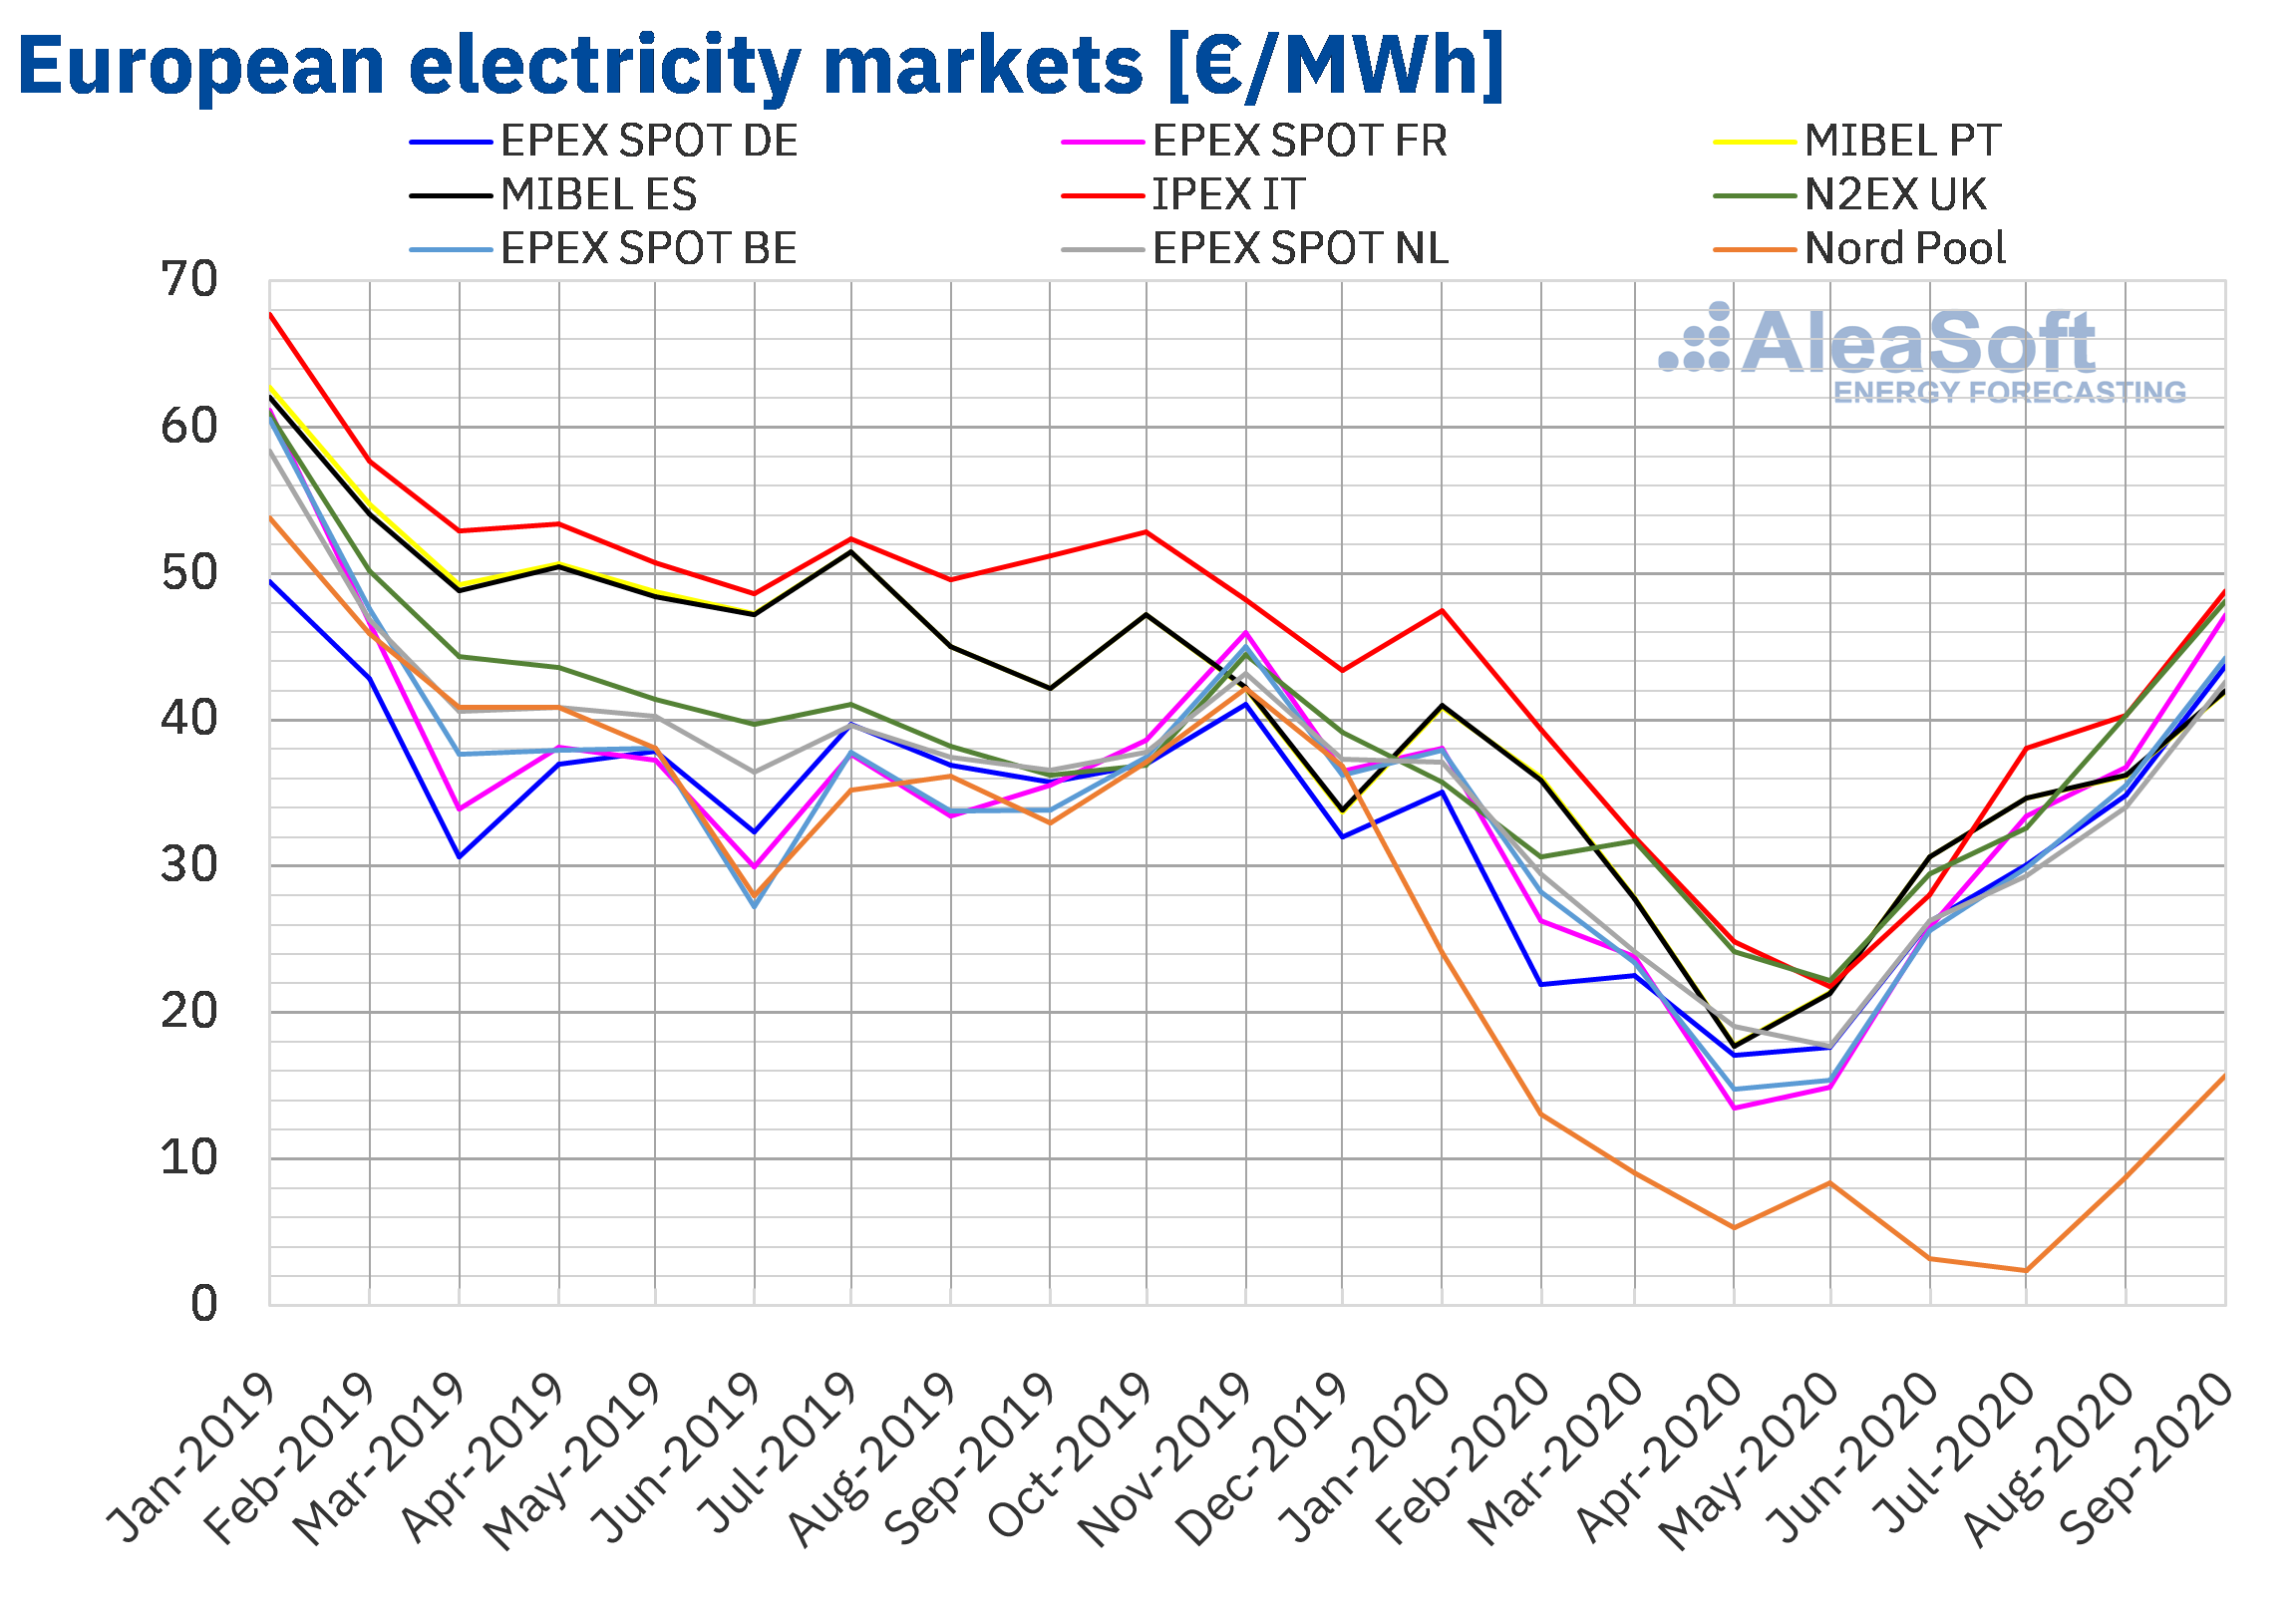
In the third quarter of 2020, the average price was above €35/MWh in all the analysed European markets, except in the Nord Pool market of the Nordic countries, which registered the lowest average, of €8.88/MWh . In contrast, the IPEX market of Italy and the N2EX market of Great Britain reached the highest average prices, of €42.31/MWh and €40.23/MWh, respectively. In the rest of the markets, the averages were between €35.25/MWh of the EPEX SPOT market of the Netherlands and €39.03/MWh of the French market.
Compared to the previous quarter, the average prices of all the European electricity markets analysed at AleaSoft increased significantly during the third quarter. The markets of France, Belgium and Germany registered the largest price increases, of 117%, 97% and 78% respectively. While the smallest increases were those of the markets of Great Britain and the Nordic countries, with increases of 47% and 59% respectively. In the rest of the markets, the increases were between 61% of the MIBEL market of Portugal and 70% of the IPEX market.
If the average prices of the third quarter of 2020 are compared with those registered in the same quarter of 2019, there were decreases in most of the markets. The exceptions were the Belgian and French markets, with increases of 4.1% and 9.9% respectively. On the other hand, the largest decrease, of 74%, occurred in the Nord Pool market and the smallest, of 3.5%, in the German market. In the rest of the markets, the price drops were between 5.7% of the N2EX market and 19% of the MIBEL market.
As for the daily prices, on September 15, the highest prices in the quarter were reached, exceeding €70/MWh in the markets of Germany, France, Great Britain and Italy. The highest daily price, of €72.76/MWh, was that of the French market.
In contrast, the lowest daily prices were reached on Sunday, July 5, due to the high levels of wind energy production combined with the decrease in demand of the weekend. The lowest daily price was that of the German market, of ‑€15.34/MWh, followed by that of the Nord Pool market, of €0.72/MWh. Other markets with daily prices below €5/MWh were those of Great Britain, France, the Netherlands and Belgium, with prices of €2.95/MWh, €3.19/MWh, €2.39/MWh and €2.14/MWh respectively. In the case of the Nord Pool market, the price of that day was the lowest in that market at least since 2011. Furthermore, the Nord Pool market prices remained below €10/MWh throughout the first half of the quarter favoured by the high levels of hydroelectric energy production in the region associated with the rainfall and the thaw.
Regarding the hourly prices, the highest in the quarter were reached on September 21 in Germany, Belgium, France, Great Britain and the Netherlands. In these markets, the price for the hour 20 exceeded €200/MWh. The highest hourly price, of €204.78/MWh, was that of the British market. But in the case of Germany and the Netherlands, the price of that hour, of €200.04/MWh, was the highest of those markets since February 2012. These prices were favoured by lower levels of nuclear energy production in France.
On the other hand, between July 4 and 6, negative hourly prices were reached in many European markets due to the high levels of wind energy production of the first weekend of the quarter. In the case of the markets of Estonia, Latvia, Lithuania and three areas of Norway, on July 6, there were negative prices for the first time at least since 2013.
 Source: Prepared by AleaSoft using data from OMIE, , N2EX, IPEX and Nord Pool.
The increase in prices in the European electricity markets compared to the previous quarter was favoured by the recovery in demand in all markets. Furthermore, the wind energy production decreased in most countries and the solar energy production decreased in Germany, France and Italy. On the other hand, the recovery in gas prices and the high prices of the emission rights also contributed to the recovery in prices.
However, compared to the third quarter of 2019, the prices were still lower in most European markets, favoured by the year‑on‑year increase in solar energy production in Europe and in wind energy production in France, Spain and Italy, as well as gas prices lower than those of the same period of 2019. Furthermore, the electricity demand still remained at levels lower than those of the same quarter of the previous year in all markets.

Iberian market
In the third quarter of 2020, the average price in the MIBEL market increased compared to the average of the previous quarter. The increases were 61% in Portugal and 62% in Spain. These price increases were the third and fourth lowest in the European electricity markets analysed at AleaSoft, respectively.
In contrast, compared to the third quarter of 2019, the prices fell by 19% in both Spain and Portugal. This was the second most important price drop in the European electricity markets after that of the Nord Pool market.
The quarterly average price was €37.55/MWh in the Spanish market and €37.51/MWh in the Portuguese market. But the daily prices exceeded €50/MWh in the MIBEL market on September 16 and 22. The highest daily price, of €51.05/MWh, was that of Wednesday, September 16, in Spain. On the other hand, the lowest daily price in the quarter, of €24.72/MWh, was reached on Sunday, September 27, in both Spain and Portugal.
The increase in demand compared to the previous quarter, together with a decrease in wind energy production in the Iberian Peninsula and the recovery in gas prices, allowed the MIBEL market prices to increase in the third quarter of 2020.
On the other hand, when comparing with the third quarter of 2019, the increase in renewable wind and solar energy production in the Iberian Peninsula favoured that the average prices of the MIBEL market in the third quarter of 2020 remained below those of the same quarter of 2019. Also contributing to this was the fact that the demand of Spain and Portugal was still slightly lower than that of the third quarter of 2019.
Electricity futures
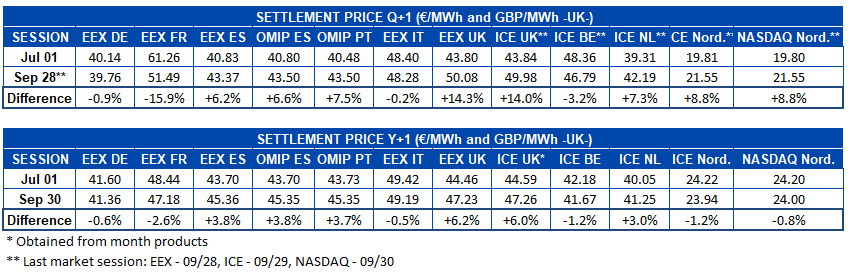
The electricity futures prices for the last quarter of 2020 registered very heterogeneous behaviours during the recently concluded third quarter of the year. Regarding the difference between the first and last markets sessions, in most of them price increases were registered, although completely opposite behaviours are also observed. The EEX market of France presented a decrease of 16%, the highest in all the markets analysed at AleaSoft. It is followed by the ICE market of Belgium with a decrease of 3.2% and then the EEX market of Germany and Italy, with decreases of 0.9% and 0.2% respectively. In the rest of the markets there were increases of between 6.2% of the EEX market of Spain and 14% of the EEX market of Great Britain.
The behaviour of the product of the calendar year 2021 was similar to that of the quarterly product. The prices fell in the EEX market of France, Germany and Italy, the ICE market of Belgium and the Nordic countries, and in the NASDAQ market, also in the Nordic region. The greatest drop was registered in the EEX market of France with a decrease of 2.6%. While, on the other hand, in the EEX market of Spain and Great Britain, the OMIP market of Spain and Portugal and the ICE market of the Netherlands, the prices increased. The British market, with a 6.2% increase, was the one with the greatest variation in the settlement price of this product during the analysed quarter.
Brent, fuels and CO2
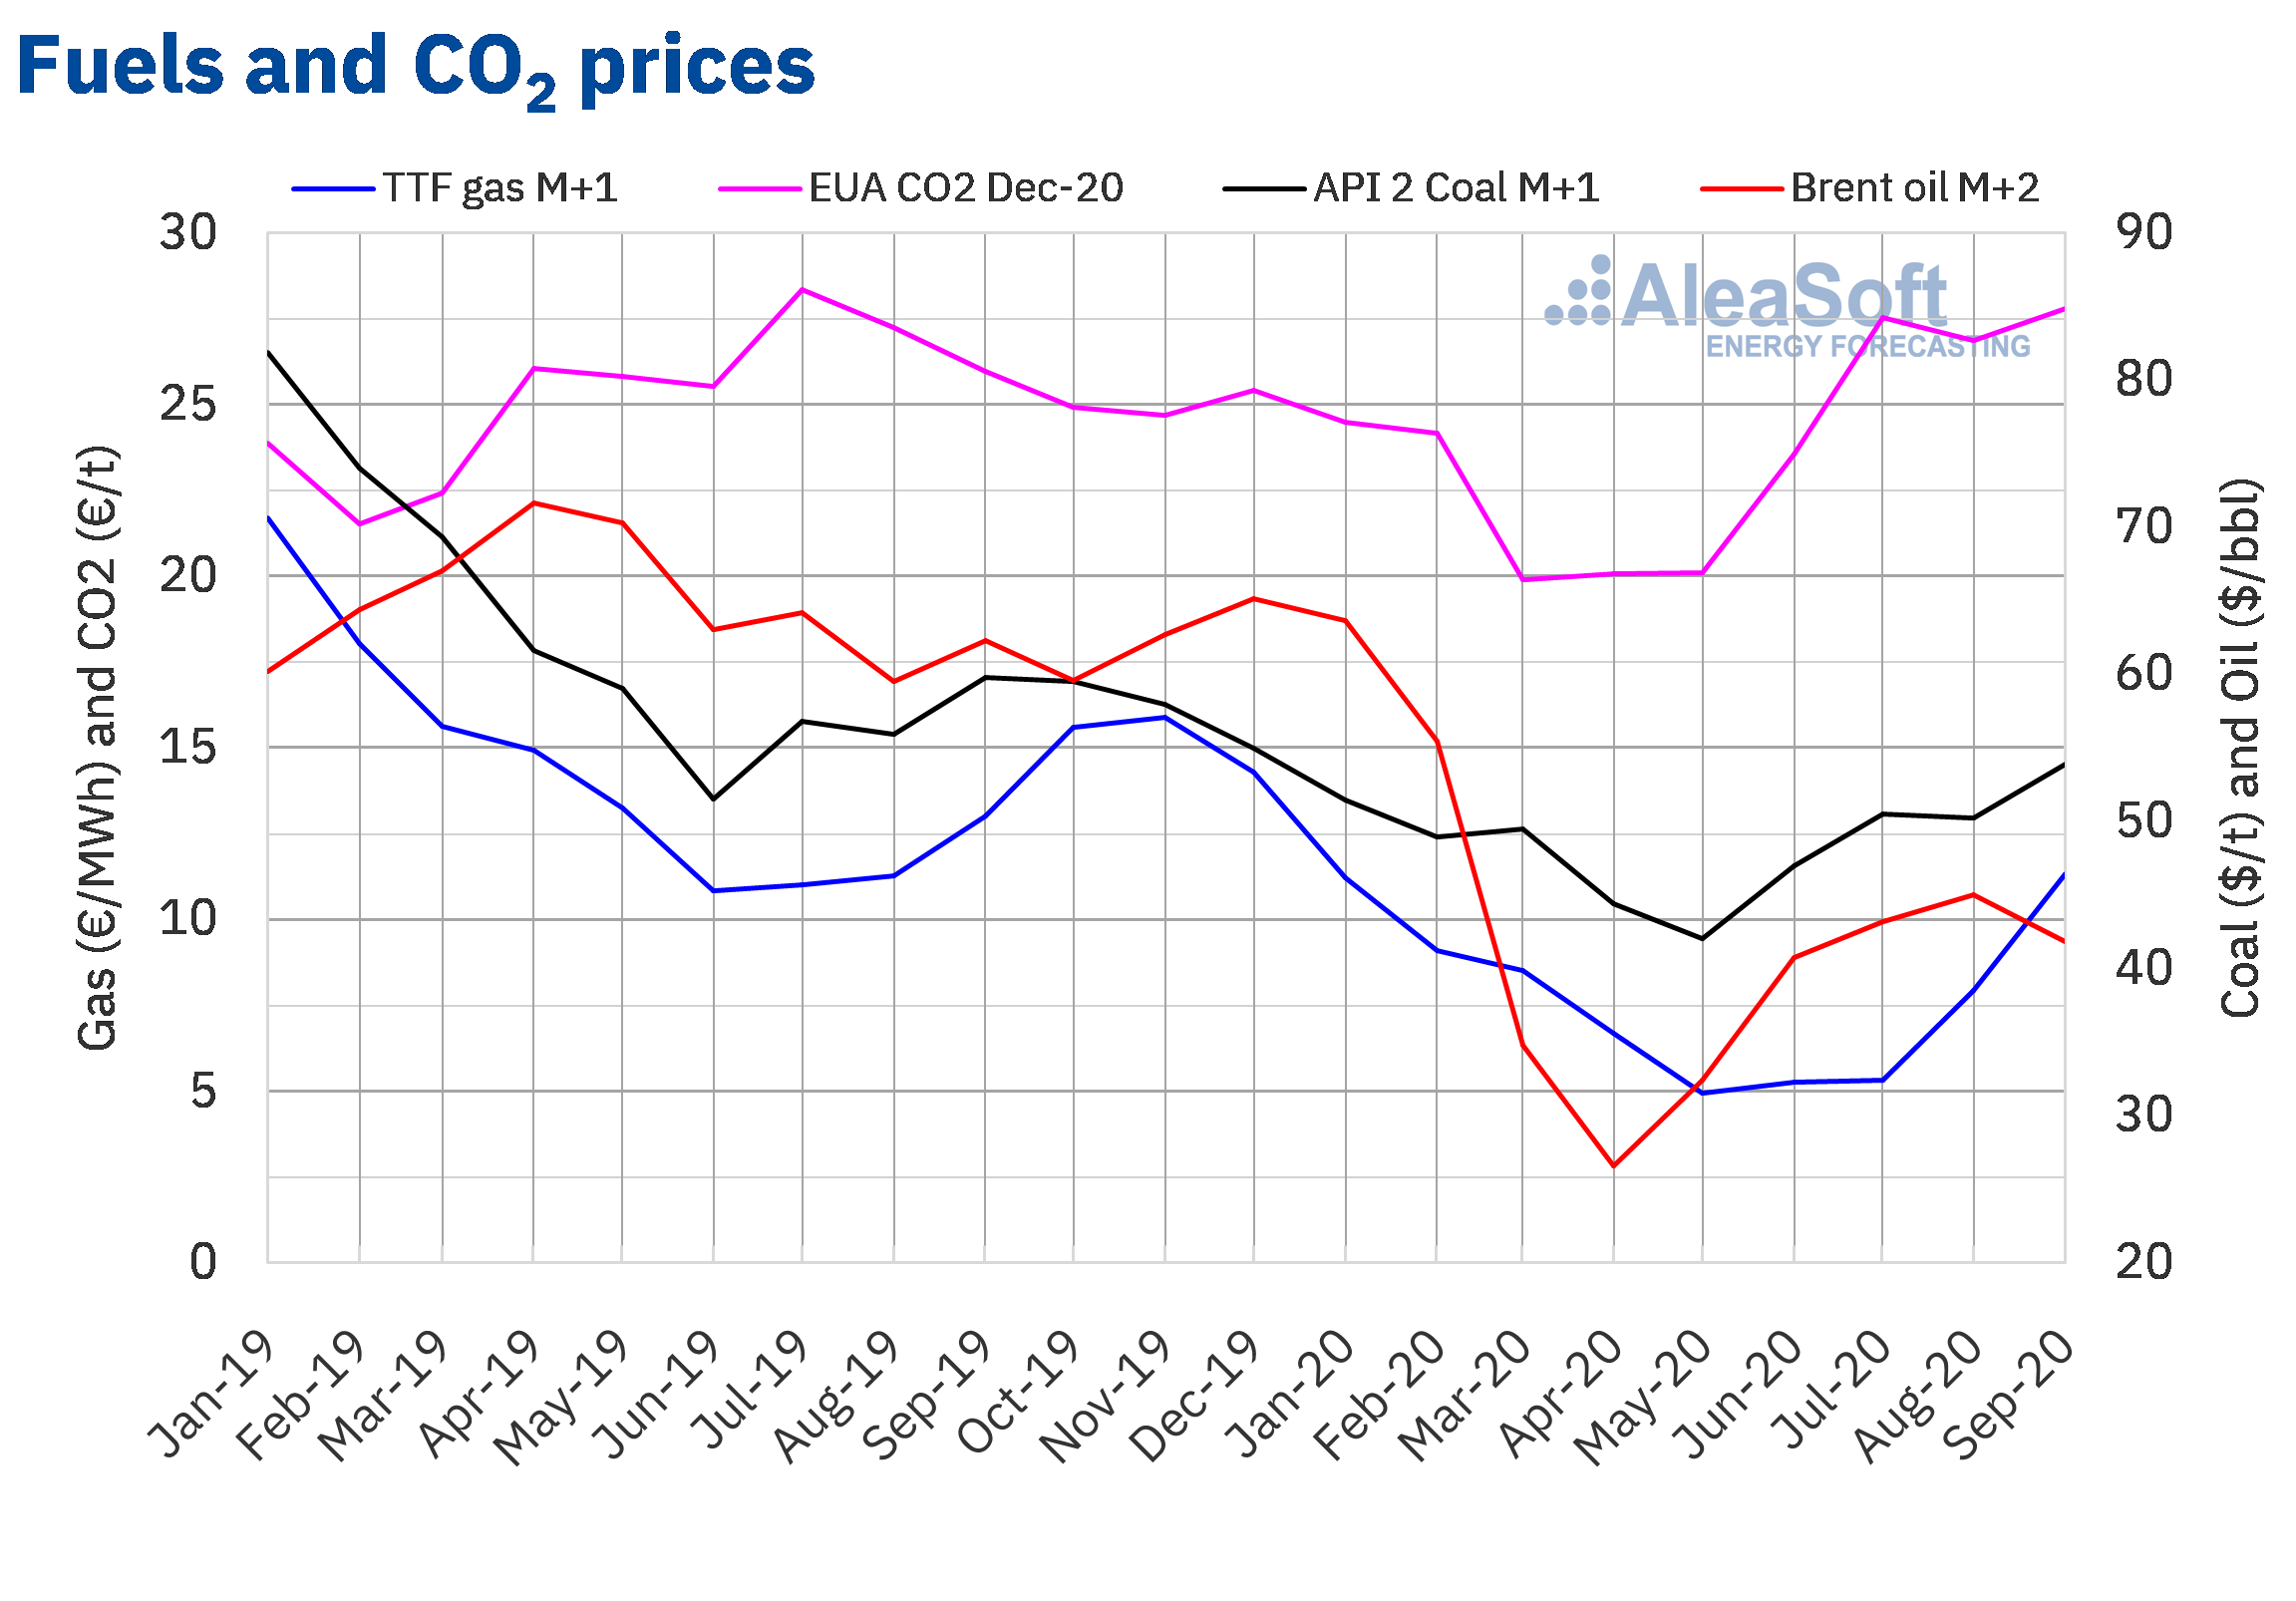
The Brent oil futures prices for the month M+2 of 2020 in the ICE market during the third quarter of 2020 recovered until reaching their maximum settlement price, of $45.86/bbl, on August 25. But, in September, the prices plummeted until reaching the quarterly minimum settlement price, of $39.61/bbl, on September 14. The quarter ended with a settlement price of $40.95/bbl in the session of Wednesday, September 30. On the other hand, the quarterly average price was $43.31/bbl. This value is 30% higher than that reached by the futures for the month M+2 in the second quarter of 2020, of $33.39/bbl, but still 30% lower than that corresponding to the M+2 futures traded on the third quarter of 2019, of $62.03/bbl.
In July, the extension of the OPEC+ production cuts and the recovery in demand allowed the prices to rise. At the beginning of August, the member countries of the OPEC+ began to increase their production. But the recovery in demand made it possible to offset the increase in supply and the prices continued to rise. In addition, in the second half of August, the production in America fell due to the hurricanes Marco and Laura.
However, at the beginning of September, the prices fell, influenced by the strengthening of the dollar and the concerns about the evolution of the demand. The effects of the Hurricane Sally on the production in America and the decline in the US reserves allowed the prices to recover in the third week of September. But the quarter ended with declines related to rising trade tensions between China and the United States. The recovery of the production in Libya and the increase in production in the United States, Iran and Russia also exerted their downward influence.
On the other hand, throughout the third quarter of 2020, the news about the increase in COVID‑19 cases worldwide exerted its downward influence on the prices. In the fourth quarter of 2020, the evolution of the COVID‑19 pandemic and the measures taken to contain it, as well as the pace of recovery of the economy, are expected to continue to exert an important influence on the evolution of the Brent oil futures prices.
As for the TTF gas futures prices in the ICE market for the month M+1 of 2020, after reaching the quarterly minimum settlement price, of €4.73/MWh, on July 20, they began to recover. The quarterly maximum settlement price, of €12.35/MWh, was reached on Monday, September 28. On the other hand, the quarterly average value was €8.17/MWh. Compared to that of the futures for the month M+1 traded in the second quarter of 2020, of €5.63/MWh, the average increased by 45%. If compared to the M+1 futures traded in the third quarter of 2019, when the average price was €11.74/MWh, there was a 30% decrease.
In the case of the spot market, in the third quarter of 2020, the TTF gas prices reached their minimum index price, of €4.23/MWh, on July 15. Subsequently, they began to recover and the quarterly maximum index price, of €12.49/MWh, was that of Wednesday, September 30. This price is the highest since December 2019. On the other hand, the average price for the quarter was €7.71/MWh, which is 44% higher than that of the second quarter of 2020, of €5.34/MWh. However, it is 25% lower than that of the third quarter of 2019, of €10.22/MWh.
Regarding the API 2 coal futures prices in the ICE market for the month M+1, after a second half of July with increases, in August they fell until reaching the quarterly minimum settlement price, of $47.50/t, on the 21st. But, subsequently, the prices increased again and on September 28 and 30, the quarterly maximum settlement price, of $57.20/t, was registered. In the end, the quarterly average price was $51.54/t, 16% higher than the average price of the API 2 coal futures for the month M+1 in the second quarter of 2020, of $44.51/t, and 10% lower than that of the third quarter of 2019, of $57.48/t.
In the second half of July, the price increases were influenced by the fears of declines in supply due to the announcements of production reduction plans in Colombia and the effects of the floods in China. The recovery in prices at the end of August was also related to the Colombian production, in this case, due to the strikes called in the mining sector. These strikes continued to exert their influence in September and could extend during the fourth quarter of 2020. This, together with an increase in demand in Europe, could favour further price increases.
As for the CO2 emission rights futures prices in the EEX market for the December 2020 reference contract, they remained above €25/t throughout the third quarter of 2020. The quarterly minimum settlement price, of €25.01/t, was registered on July 27. While the maximum settlement price, of €30.47/t, was reached on September 14. On the other hand, the average price for the quarter was €27.41/t, 29% higher than that of the previous quarter, of €21.32/t. If compared to the average for the third quarter of 2019, of €27.23/t, the average for the third quarter of 2020 is 0.7% higher. The decline in French nuclear energy production favoured the recovery of the prices.
 Source: Prepared by AleaSoft using data from ICE and EEX.
AleaSoft analysis of the recovery of the energy markets at the end of the economic crisis
With the beginning of the fourth quarter, at AleaSoft the reports of long‑term price curves forecasting for the European electricity markets are being updated. The update takes into account the latest published data on the evolution of the economy, as well as the recovery scenarios from the economic crisis. In this period of uncertainty, having forecasting that is scientific, coherent and of quality is essential for investments in renewable energy, mainly wind and photovoltaic energy.
To analyse how the energy markets are evolving during the recovery from the coronacrisis and the prospects in the medium and long term, at AleaSoft the series of webinars on “Energy markets in the recovery from the economic crisis” is being carried out. The first part was held on September 17 and the recording of it can be requested through the email webinar@aleasoft.com. The second part will be held on October 29 and will feature the participation of two invited speakers from the consulting firm Deloitte, Pablo Castillo Lekuona, Senior Manager of Global IFRS & Offerings Services and Carlos Milans del Bosch, Partner of Financial Advisory. In this series of webinars the evolution of the financing of renewable energy projects in the current context of uncertainty about the evolution of the economy is also being analysed, and the importance of the forecasting in the portfolio valuation and the audits is being explained.
The evolution of the energy markets can also be followed in the observatories enabled on the AleaSoft website. This tool includes graphs with updated hourly, daily and weekly information on the main variables of the European electricity, fuels and CO2 markets.
Source: AleaSoft Energy Forecasting.