


AleaSoft Energy Forecasting, August 12, 2026. The days with the highest intraday spreads in Spain show little coincidence with those of the markets of central and northern Europe. The different dynamics that condition spreads in each region mean that the best arbitrage opportunities do not necessarily occur on the same days. For pan-European battery portfolios, this low synchrony can become an additional factor of diversification and risk management.
A spread pattern with a different origin
The high photovoltaic penetration conditions the behaviour of the intraday spread in Spain. For much of the year, solar production pushes prices down during the central hours of the day and favours a midday valley that occurs frequently. In Germany, the United Kingdom and the Nordic countries, by contrast, wind variability, demand and episodes of low renewable production carry greater weight and generate different time patterns. In July 2026, the Spanish market registered record intraday spreads, in a context marked by this recurring solar dynamic.
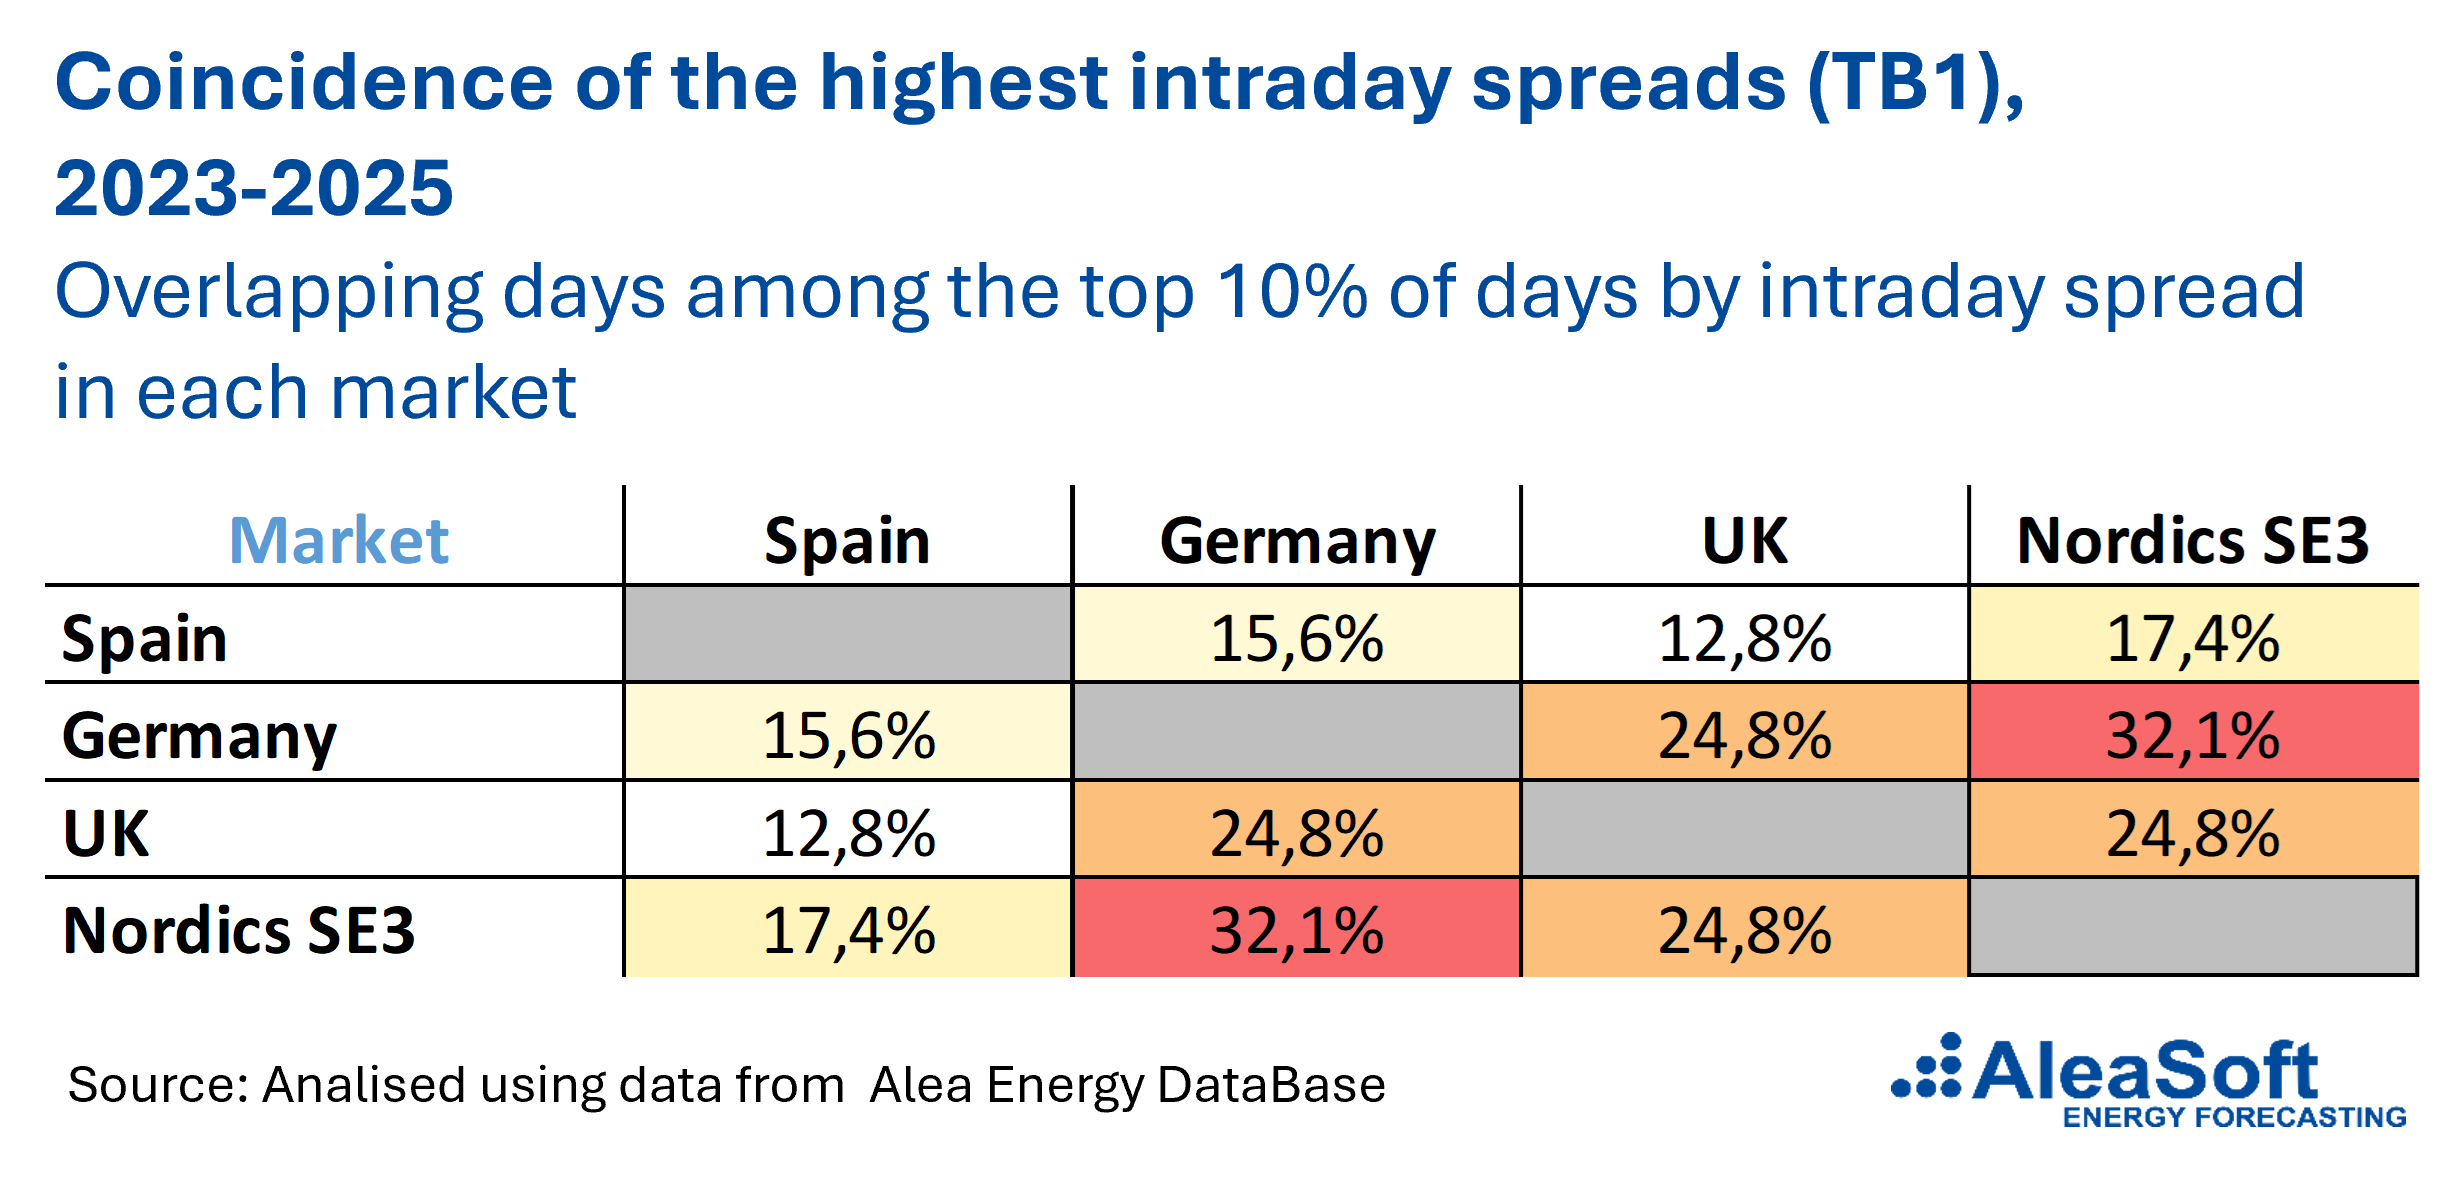
These differences are also reflected in a low coincidence of the days with the highest spreads between markets. The one-hour intraday spread (TB1) corresponds to the difference between the maximum and the minimum hourly price of each day.
How many days coincide between markets
Between 2023 and 2025, the overlap between the days that make up the 10% of days with the highest TB1 spread was around 16% between Spain and Germany and 13% between Spain and the United Kingdom. Between Spain and the Nordic markets, the coincidence rose slightly, to close to 17%. By contrast, between Germany and the Nordic markets it reached approximately 32%, and between Germany and the United Kingdom it was around 25%. The markets of central and northern Europe therefore show clearly greater synchrony than the combinations with Spain.
These differences respond to different market dynamics. Wind variability, weather conditions and certain demand patterns can affect several markets of central and northern Europe simultaneously. In Spain, the strong weight of photovoltaic energy introduces a dynamic of its own, particularly linked to the price difference between the central hours of the day and the hours of lower solar generation. In addition to a lower coincidence with the markets of the centre and north of the continent, this Iberian dynamic favours a lower concentration of days with the highest spreads.
What this implies for a battery portfolio
For an investor or fund with battery storage assets spread across several European countries, this low temporal coincidence favours diversification. The days with the greatest arbitrage opportunities in Spain do not usually coincide with those on which Germany, the United Kingdom or the Nordic countries register their highest spreads. Combining assets exposed to different patterns can therefore reduce the portfolio’s dependence on the same market episodes and distribute revenue opportunities better over time.
The effect works in both directions. Adding exposure to the Spanish market to a portfolio focused on northern Europe incorporates a different spread pattern and can reduce dependence on the same market episodes. Conversely, adding central European assets to a portfolio focused on Spain can reduce its dependence on the Spanish solar dynamic. This complementarity is relevant for the design of hybridisation projects and for the geographical allocation of CAPEX in new battery plants. Geographical diversification not only spreads regulatory and price exposure across markets, it can also distribute arbitrage opportunities over time.
Temporal decorrelation as a portfolio design criterion
The low coincidence between the days with the highest spread in Spain and in the markets of central and northern Europe provides an additional criterion for designing battery portfolios on a European scale. In addition to the expected profitability of each asset, it is relevant to consider the extent to which the arbitrage opportunities of the different markets coincide in time.
The evolution of these patterns will depend, among other factors, on the deployment of photovoltaic, wind and storage capacity, on electricity demand and on interconnections. Incorporating this temporal dimension makes it possible to assess the opportunities and the risks of a portfolio from a joint perspective and not as a simple sum of assets.
Storage as a strategic element and the role of AleaStorage
In this context, AleaStorage, the division specialising in energy storage of AleaSoft Energy Forecasting, analyses the profitability and the risks of standalone batteries and hybridisation projects. Its studies include estimates of battery revenues in energy and balancing services markets, analysis of hybridisation with renewables such as photovoltaic and wind energy to maximise revenues and reduce risks, and modelling of long-term spread and volatility scenarios in the different European markets. This approach makes it possible to size battery portfolios with risk diversification criteria, in addition to considering the expected profitability of each asset.
Alea’s methodology and time series at the service of the comparison between markets
The methodology developed by AleaSoft, with more than 27 years of experience, combines Machine Learning techniques, neural networks, statistical and econometric models and fundamental supply and demand models to generate electricity market price forecasts that are consistent across countries. This methodological consistency makes it possible to compare price, spread and revenue scenarios in Spain, Germany, the United Kingdom and the Nordic markets under homogeneous criteria and to assess projects and asset portfolios consistently.
The one-hour intraday spread series (TB1) of these and other European markets, together with other energy market variables, are available in Alea Energy DataBase, AleaSoft’s online data platform.
Source: AleaSoft Energy Forecasting