


AleaSoft Energy Forecasting, October 1, 2026. In September 2026, prices rose in the main European electricity markets. Higher gas prices, driven by low European reserves and geopolitical tensions in the Strait of Hormuz, together with the rise in CO2 prices and in demand, favoured this trend. The monthly fall in solar photovoltaic energy production added to this, although production still reached all-time highs for a month of September in the main markets. Italy and Portugal broke demand records for the month.
Solar photovoltaic and wind energy production
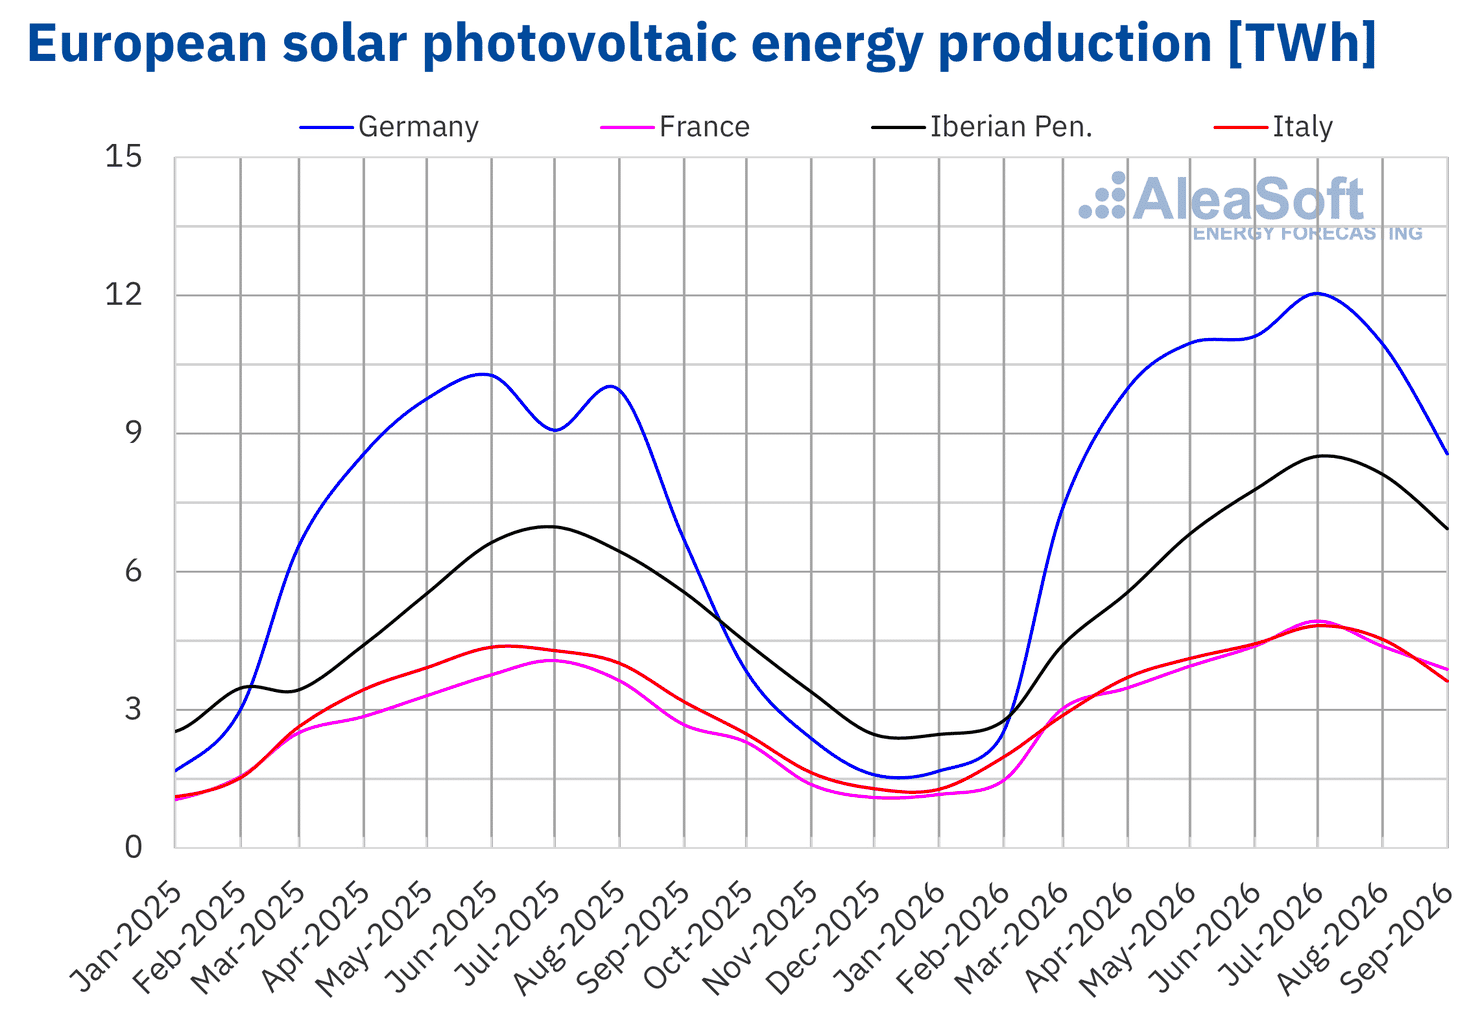
In September 2026, solar photovoltaic energy production rose in all the main European electricity markets compared with the same month of the previous year. France recorded the highest percentage growth, at 45%, and Italy the lowest, at 13%. In Germany, Spain and Portugal, production grew by 31%, 25% and 18%, respectively.
Compared with August 2026, solar photovoltaic energy production fell in all the markets analysed. Germany recorded the largest drop, at 19%, followed by Italy, with a fall of 17%. In Spain, France and Portugal, production decreased by 11%, 6.3% and 4.9%, respectively.
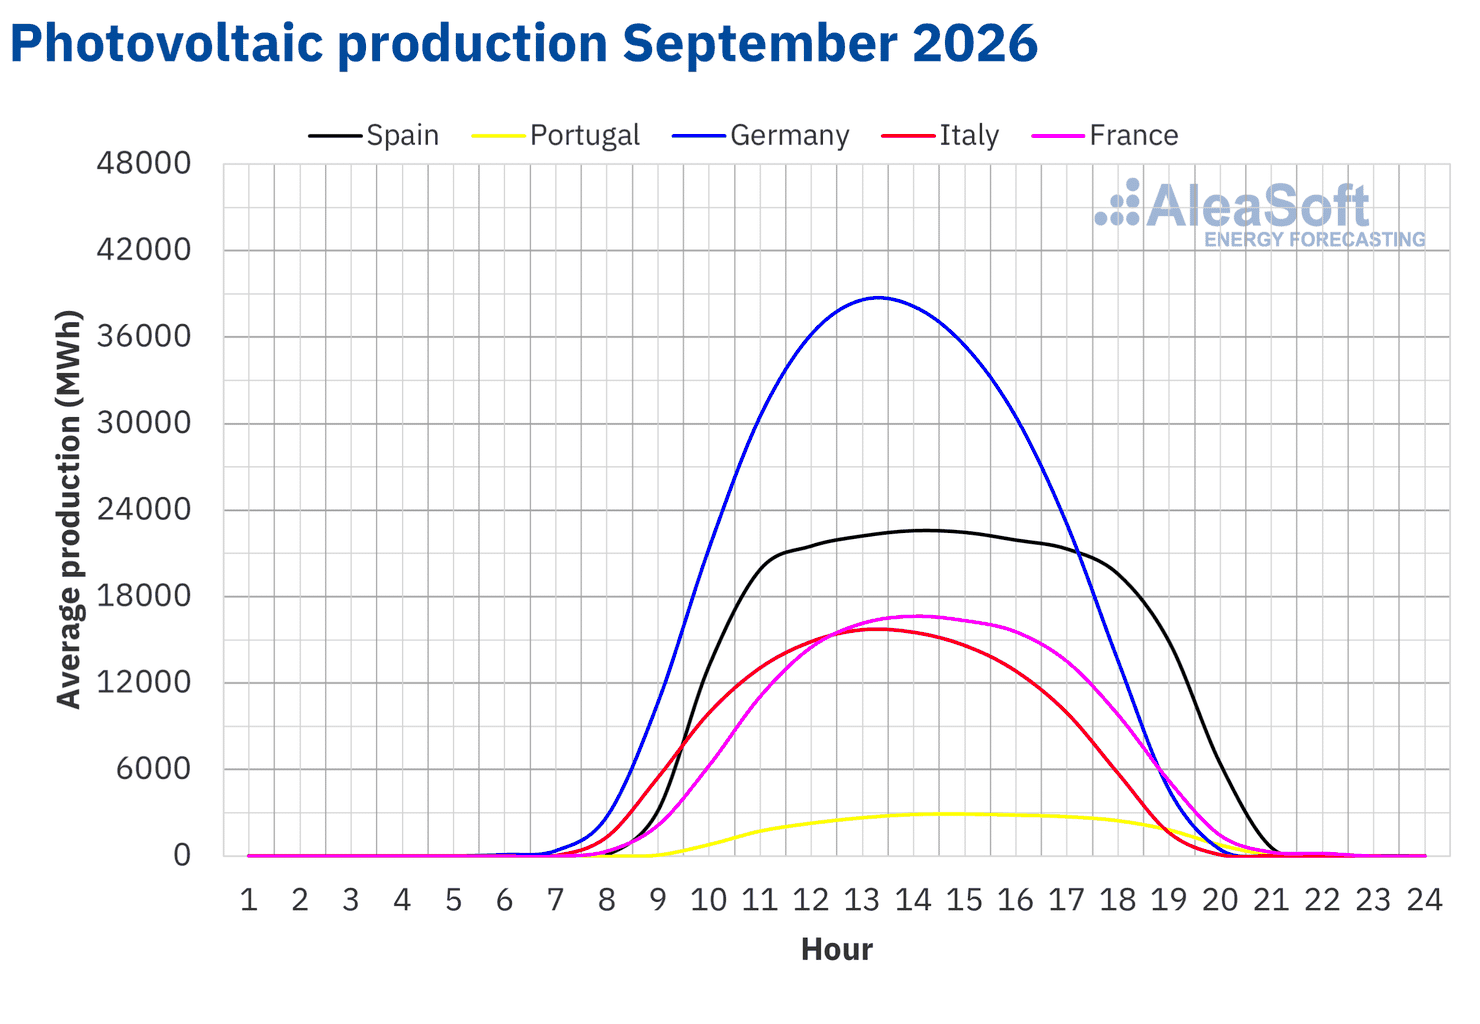
In September 2026, solar photovoltaic energy production reached all-time highs for a month of September in the main European electricity markets analysed. Generation stood at 8562 GWh in Germany, 6207 GWh in Spain, 3879 GWh in France, 3624 GWh in Italy and 724 GWh in Portugal.
Year-on-year growth in installed capacity favoured these all-time highs in solar photovoltaic energy production. Between September 2025 and September 2026, installed solar photovoltaic capacity in mainland Spain increased by approximately 7670 MW, excluding self-consumption, according to an estimate based on data from Red Eléctrica.
 Source: Prepared by AleaSoft Energy Forecasting using data from ENTSO-E, RTE, REN, Red Eléctrica and TERNA.
 Source: Prepared by AleaSoft Energy Forecasting using data from ENTSO-E, RTE, REN, Red Eléctrica and TERNA.
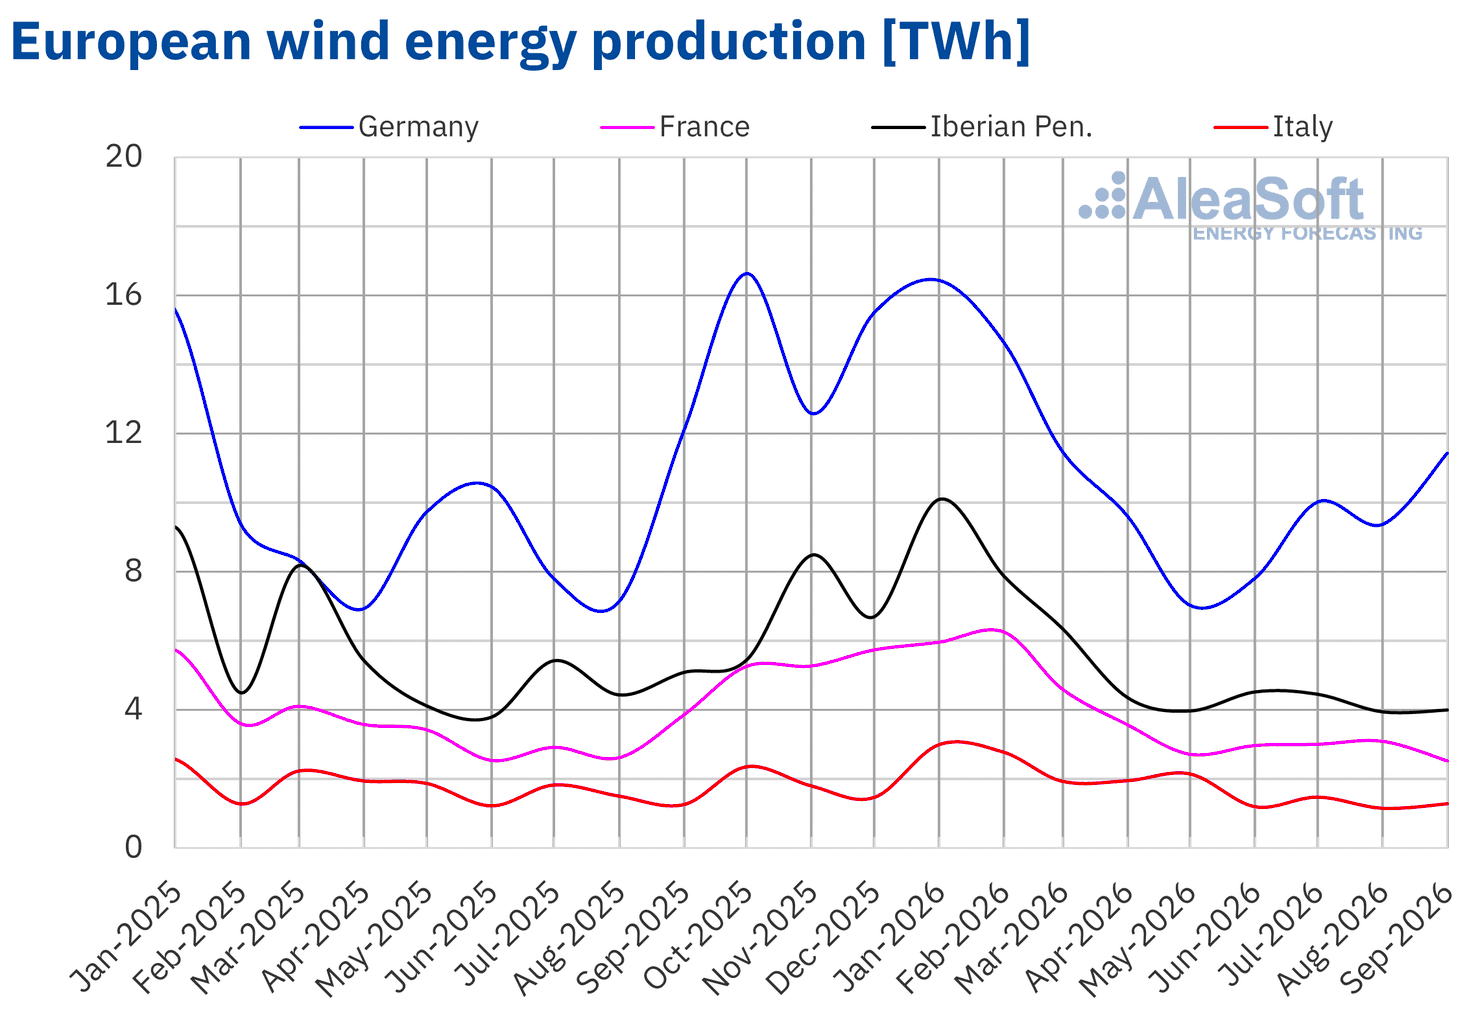
In September 2026, wind energy production rose year-on-year in Italy, with growth of 2.7%. In contrast, production fell in the rest of the main European electricity markets analysed. France and Portugal recorded the largest drops, of 34% in both cases, followed by Spain, with a fall of 17%. In Germany, production decreased by 5.2%.
Compared with August 2026, wind energy production rose in Germany, Italy and Spain. Germany recorded the largest growth, at 26%, followed by Italy, with an increase of 15%. In Spain, the increase was more moderate, at 1.5%. In contrast, wind energy generation fell in France and Portugal, by 16% and 2.8%, respectively.
In Germany, wind energy production reached 11 434 GWh in September, the second-highest value in its history for that month.
Between September 2025 and September 2026, installed wind capacity in mainland Spain increased by approximately 476 MW, excluding self-consumption, according to an estimate based on data from Red Eléctrica.
 Source: Prepared by AleaSoft Energy Forecasting using data from ENTSO-E, RTE, REN, Red Eléctrica and TERNA.
Electricity demand
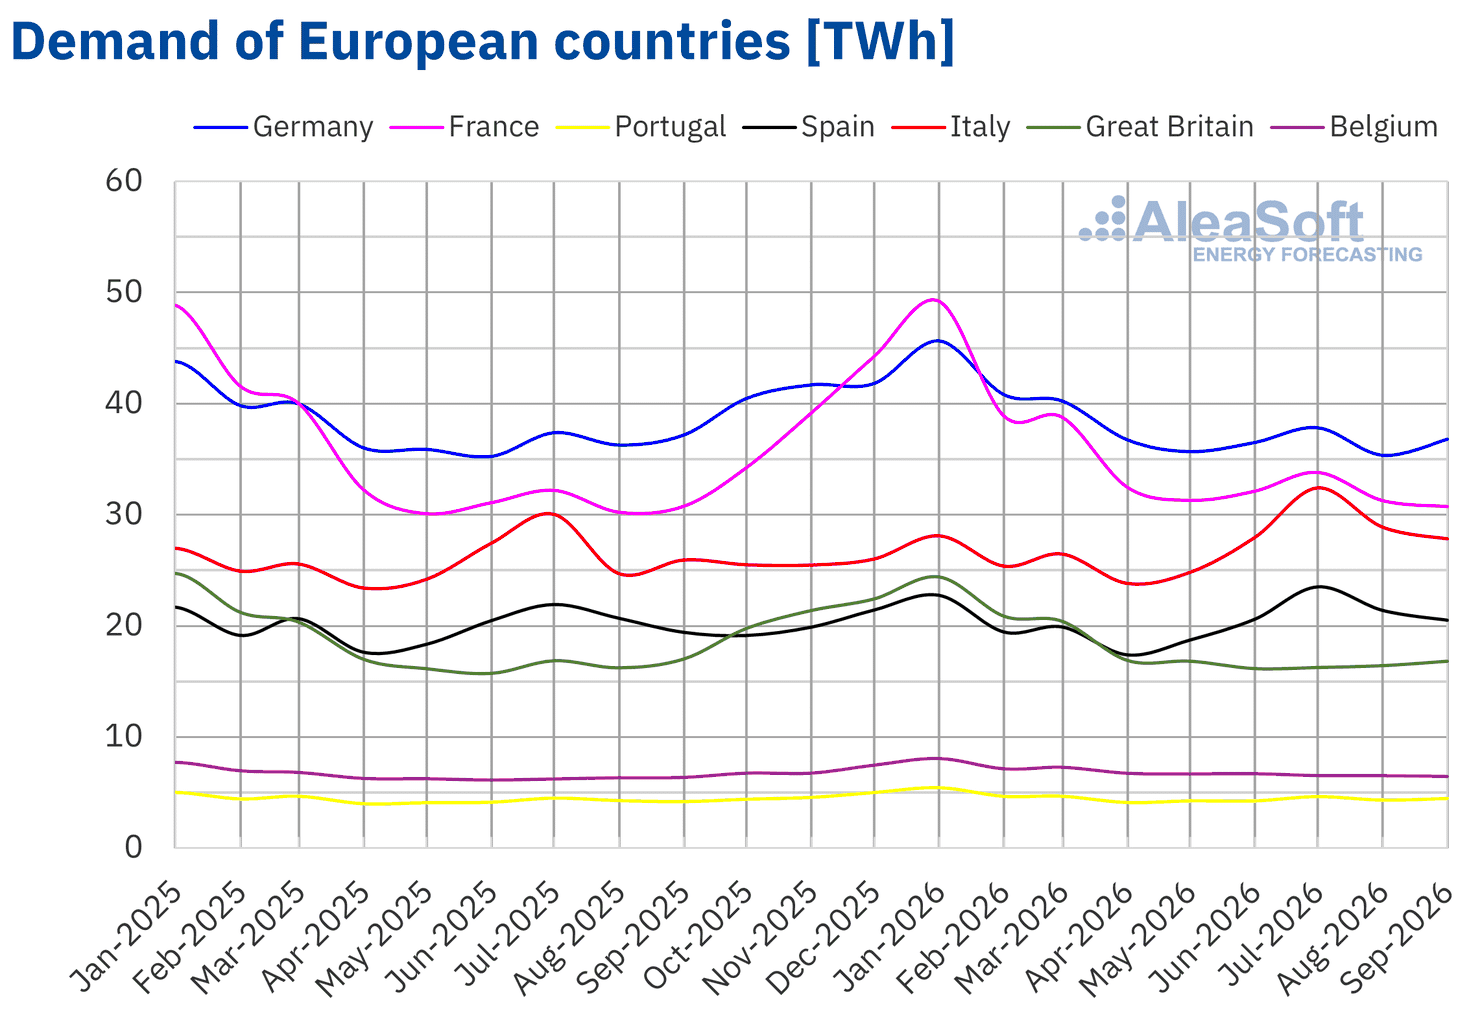
In September 2026, electricity demand rose year-on-year in Italy, Portugal, Spain and Belgium. Italy recorded the largest increase, at 7.3%, followed by Portugal and Spain, with rises of 6.8% and 5.7%, respectively. In Belgium, demand grew by 1.4%. In contrast, it fell by 1.1% in Great Britain, 1.0% in Germany and 0.1% in France.
Compared with August 2026, demand rose in most of the main European electricity markets analysed. Germany recorded the largest rise, at 7.6%, followed by Portugal and Great Britain, with increases of 6.9% and 5.8%, respectively. In Belgium and France, demand grew by 2.4% and 1.4%, respectively. In contrast, it fell by 1.7% in Spain and 0.4% in Italy.
In September 2026, electricity demand reached all-time highs for a month of September in Italy and Portugal, with 27 840 GWh and 4449 GWh, respectively.
Average temperatures in September 2026 were higher than in the same month of 2025 in the markets analysed. Belgium recorded the largest increase, of 3.1°C, followed by France, with a rise of 3.0°C. In the rest of the markets, increases ranged from 1.4°C in Germany to 2.6°C in Great Britain.
Compared with August 2026, average temperatures fell in the main markets. Italy recorded the largest drop, of 4.8°C, followed by Germany, with a fall of 3.9°C. In the rest of the markets, temperatures dropped by between 0.4°C in Belgium and 3.4°C in France.
 Source: Prepared by AleaSoft Energy Forecasting using data from ENTSO-E, RTE, REN, Red Eléctrica, TERNA, National Grid and ELIA.
European electricity markets
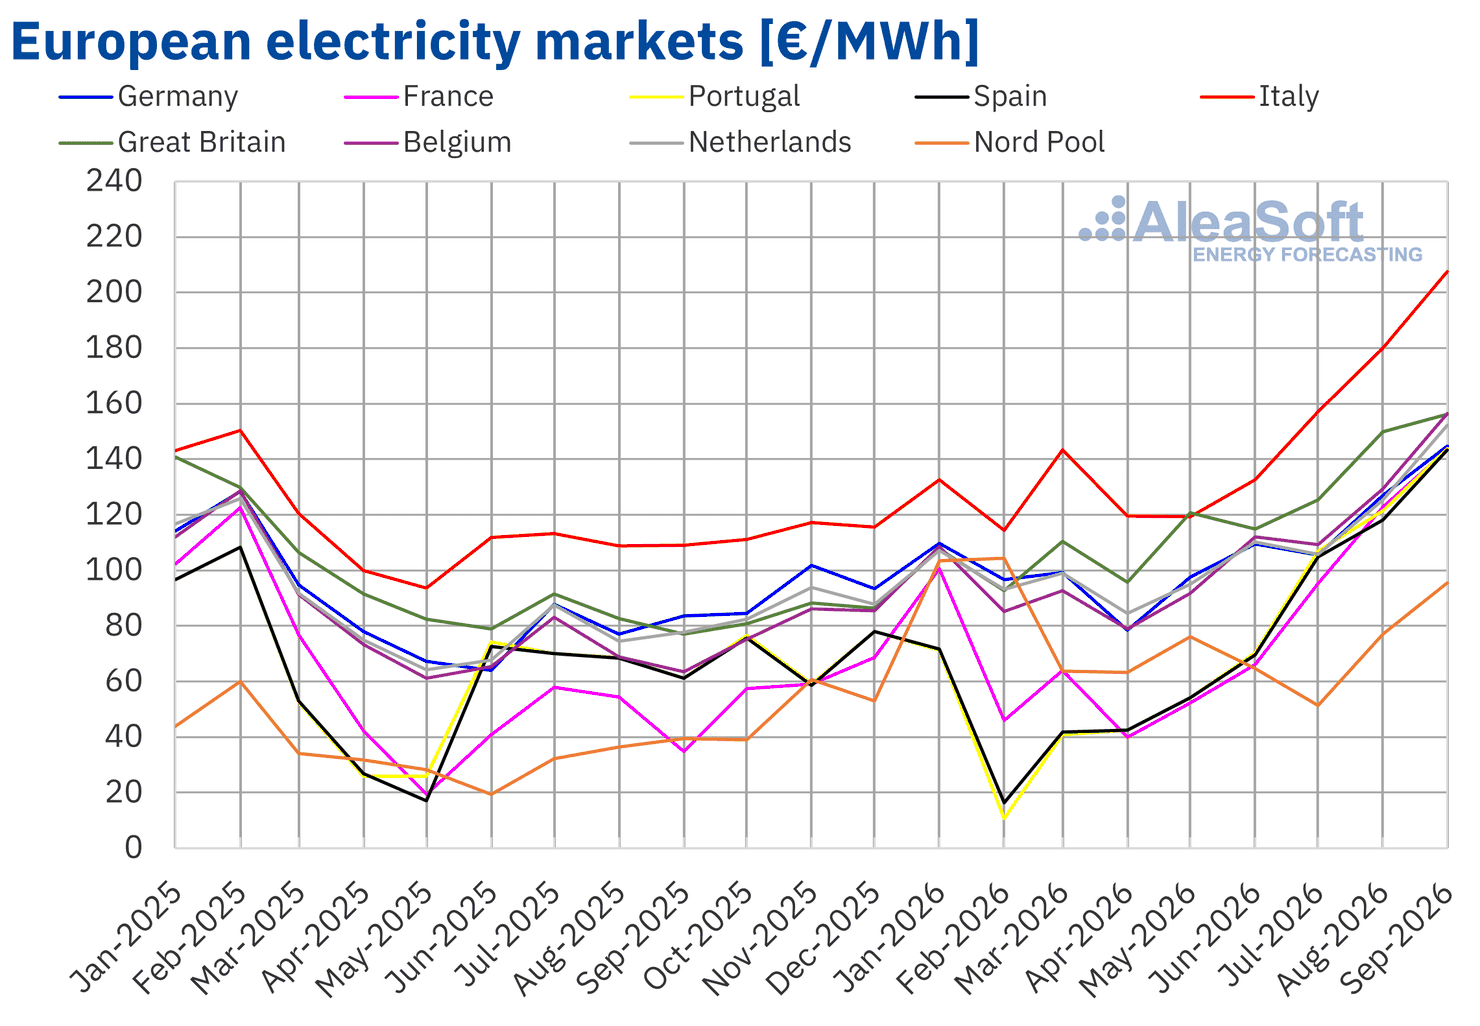
In September 2026, the monthly average price exceeded €140/MWh in almost all the main European electricity markets. The Nordic market was the exception, with an average of €95.57/MWh. The Italian market recorded the highest price, €207.54/MWh, followed by the Belgian and British markets, with €156.41/MWh and €156.12/MWh, respectively. In the rest of the markets analysed by AleaSoft Energy Forecasting, averages ranged from €143.25/MWh in the Spanish market to €152.21/MWh in the Dutch market.
Compared with August, average prices rose in all the European electricity markets analysed by AleaSoft Energy Forecasting. The Nordic market recorded the largest percentage rise, at 24%, while the British market posted the smallest increase, at 4.2%. In the rest of the markets, prices rose by between 14% in the German market and 21% in the Spanish, Belgian and Dutch markets.
Comparing September average prices with those recorded in the same month of 2025, prices also rose in all the European electricity markets analysed. The French market recorded the largest percentage rise, at 312%, followed by the Belgian market, with an increase of 146%. In the rest of the markets, price increases ranged between 73% in the German market and 143% in the Nordic market.
As a result of the price rises, the German, Belgian, British, Italian and Dutch markets recorded their highest monthly averages since January 2023 in September 2026. The Spanish and Portuguese markets reached their highest monthly prices since September 2022, while the French market recorded its highest average since March 2023. The Nordic market average was the highest since March 2026.
The rise in gas and CO2 emission allowance prices compared with August, together with the fall in solar energy production in all markets and the drop in wind energy production in France and Portugal, favoured the rise in prices in European electricity markets compared with the previous month. Higher demand in most markets also contributed to this trend.
Compared with the same month of 2025, the sharp increase in gas prices, which more than doubled those of September of the previous year, and the rise in CO2 emission allowance prices drove the year-on-year price increases. The fall in wind energy production in most markets and higher demand in Belgium, Italy and the Iberian Peninsula also contributed to these rises.
 Source: Prepared by AleaSoft Energy Forecasting using data from OMIE, RTE, Nord Pool and GME.
Brent, fuels and CO2
Brent oil Front‑Month futures in the ICE market recorded an average price of $102.02/bbl in September 2026. This figure was 16% higher than in August 2026, when it stood at $88.08/bbl, and 51% higher than in September 2025, when it reached $67.58/bbl. According to the data analysed by AleaSoft Energy Forecasting, the September average was the highest since May 2026.
During September, the resumption of attacks between the United States and Iran in the Strait of Hormuz, including attacks on oil tankers, heightened concerns about crude oil supply and drove up Brent oil futures prices. Futures exceeded $100/bbl in the first half of the month and closed September at $103.53/bbl.
Regarding TTF gas Front‑Month futures in the ICE market, the average price recorded in September 2026 was €75.34/MWh. This figure was 21% higher than in August 2026, when the average stood at €62.14/MWh. Compared with September 2025, whose average price was €32.33/MWh, the increase reached 133%. In addition, according to the data analysed by AleaSoft Energy Forecasting, the September 2026 average was the highest since December 2022.
In September, low European gas reserve levels drove up TTF gas futures prices, which exceeded €80/MWh in mid-month. In mid-September, the fill level of European storage facilities stood at around 68%, below the 81% recorded a year earlier and the five-year average of 84%. Restrictions on liquefied natural gas supply linked to tensions in the Strait of Hormuz, high Asian demand for liquefied natural gas during the heatwave at the start of the month and maintenance work on gas infrastructure in Norway also contributed to the rise.
Regarding CO2 emission allowance futures in the EEX market for the December 2026 reference contract, the average price reached €85.63/t in September. This figure was 4.0% higher than the €82.37/t recorded in August 2026. It also exceeded the September 2025 average of €78.19/t by 9.5%. According to the data analysed by AleaSoft Energy Forecasting, the monthly average price in September 2026 was the highest since January of this year.
 Source: Prepared by AleaSoft Energy Forecasting using data from ICE and EEX.
AleaSoft Energy Forecasting analysis of renewable energy curtailment in Spain
The growth in renewable capacity in Spain, which in September translated into new solar photovoltaic energy production highs for that month, increases the relevance of grid constraints and renewable energy curtailment. For renewable developers, investors and asset owners, knowing where and to what extent curtailment occurs is essential to assess expected project revenues, grid integration risks and the value of energy storage and hybridisation.
To meet these needs, AleaSoft Energy Forecasting offers a new renewable energy curtailment analysis service in Spain. The analysis studies the regional distribution of curtailment in the mainland electricity system, identifies the main nodes and areas with the highest concentration of curtailments and analyses territorial patterns and evacuation constraints. The service combines the processing of public system and market information with the expert interpretation of AleaSoft Energy Forecasting. This regional and nodal information allows AleaSoft clients to incorporate curtailment and grid constraint risk into the analysis of their renewable, storage and hybridisation projects.
Source: AleaSoft Energy Forecasting.