AleaSoft, September 7, 2020. The European electricity markets prices increased in a generalised way in the first week of September compared to the previous week. The causes include the decline in wind energy production in all markets, also in solar energy production in some, the recovery in gas prices, the high CO2 prices and less nuclear energy availability in France. The Brent oil futures prices fell below $43/bbl, something that did not happen since the beginning of July.
Photovoltaic and solar thermal energy production and wind energy production
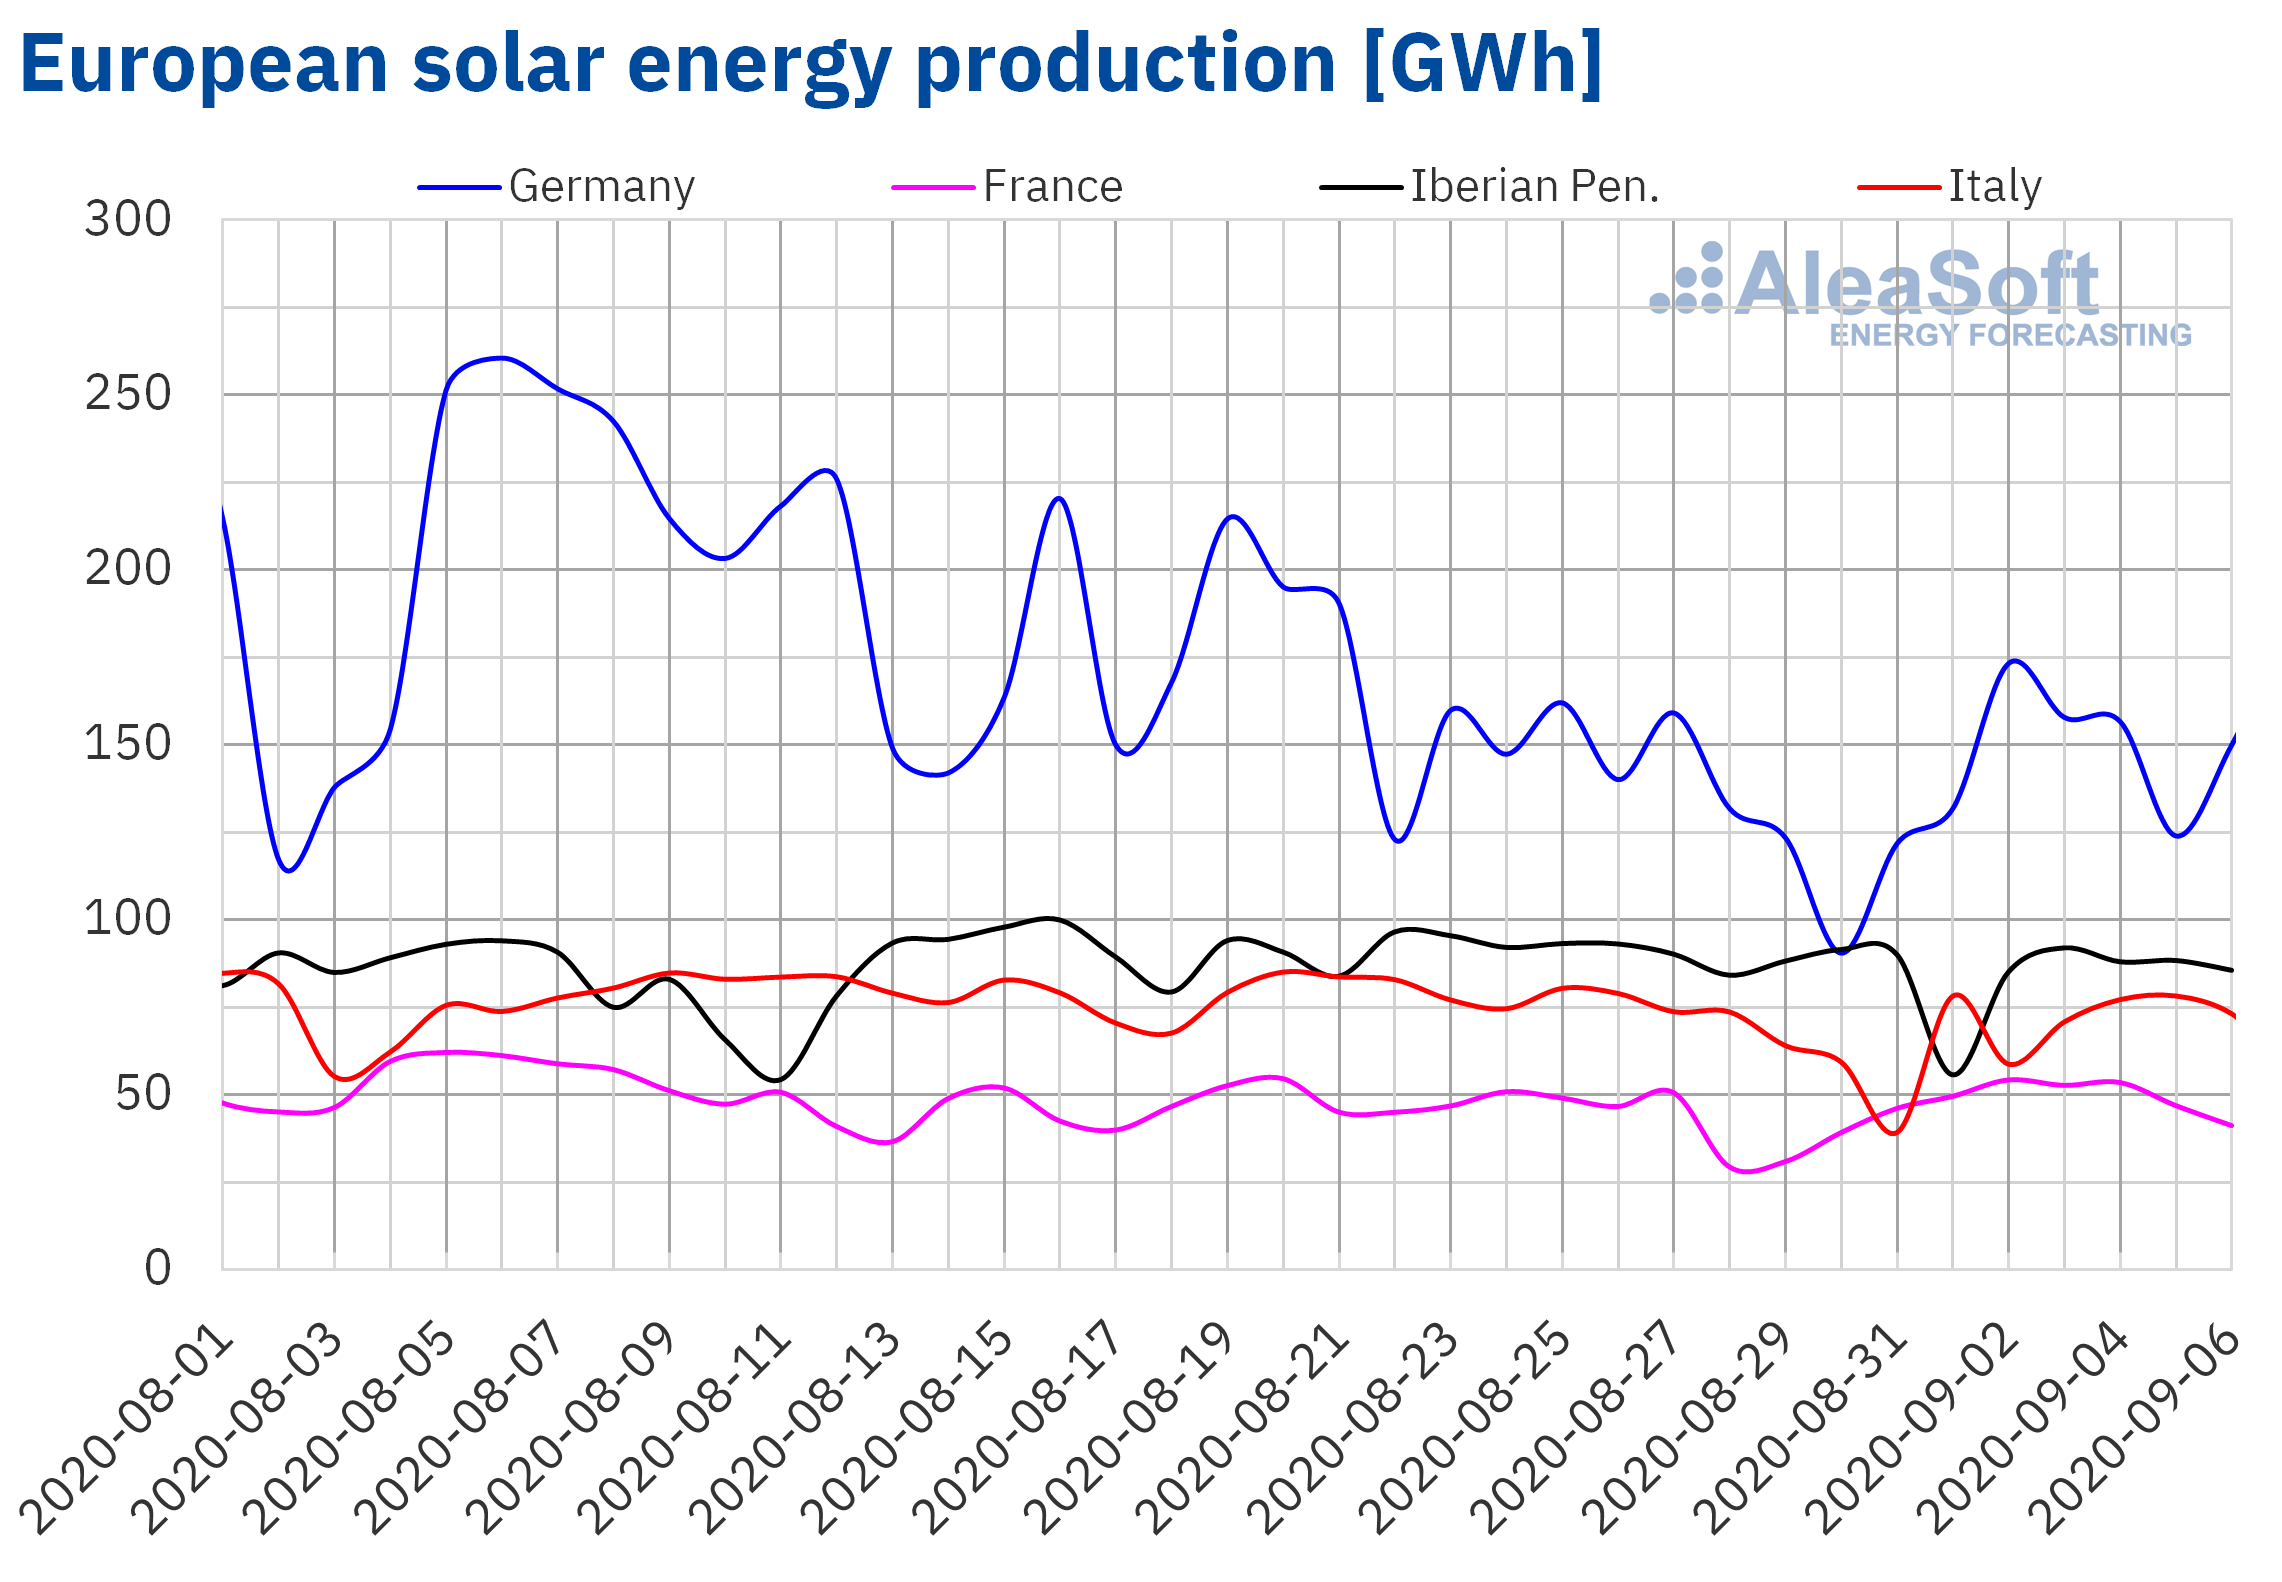
During the first week of September, the solar energy production decreased by 7.7% in the Spanish market, by 5.8% in the Italian market and by 4.3% in the Portuguese market, compared to what was produced in the week of August 24. On the contrary, in the French market it increased by 16% and in the German by 6.4%.
During the first six days of September, there was an increase in solar energy production in the Iberian Peninsula of 47%, compared to the same days of 2019. In the Italian market, the production increased during this period by 29% while in the French market it increased by 13%. Out of all the markets analysed at AleaSoft, the only one where a reduction in production was registered was the German market, where it fell by 3.4% during the first six days of the month.
For the second week of September, the AleaSoft‘s solar energy production forecasting indicates that the production will decrease in Spain and Italy, while an increase is expected in the German market compared to the values registered in the week of August 31.
 Source: Prepared by AleaSoft using data from ENTSO-E, RTE, REN, REE and TERNA.
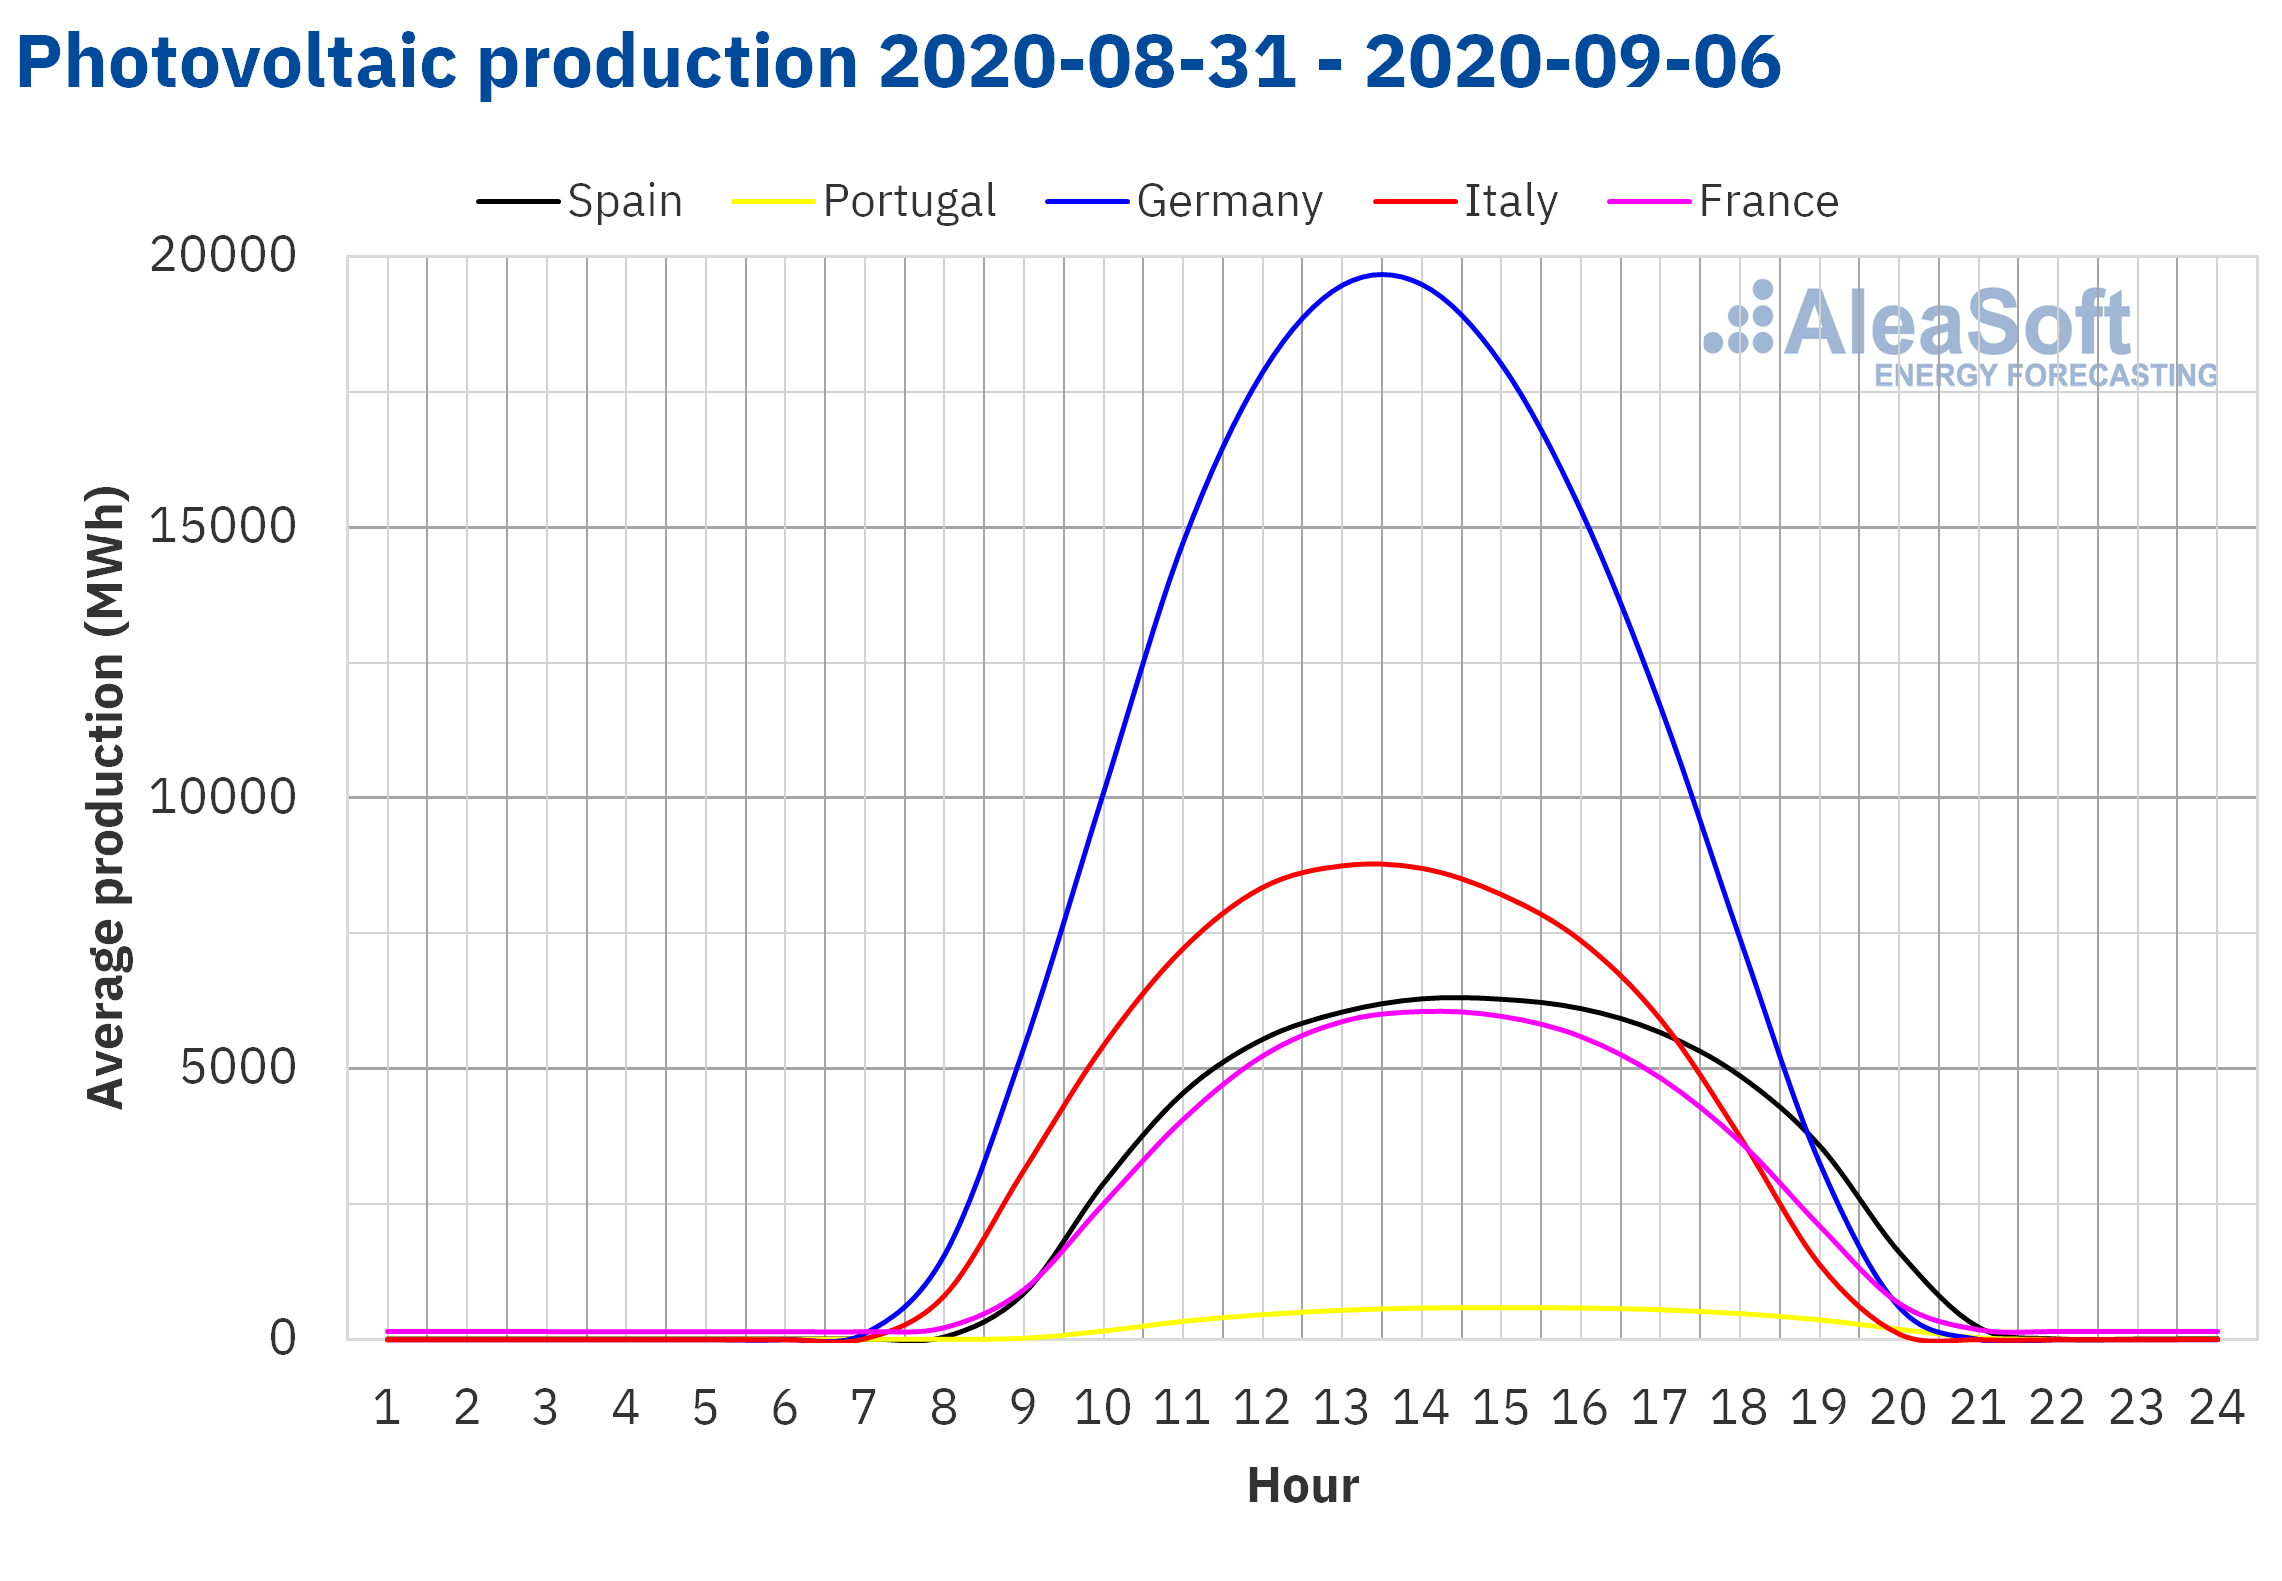 Source: Prepared by AleaSoft using data from ENTSO-E, RTE, REN, REE and TERNA.
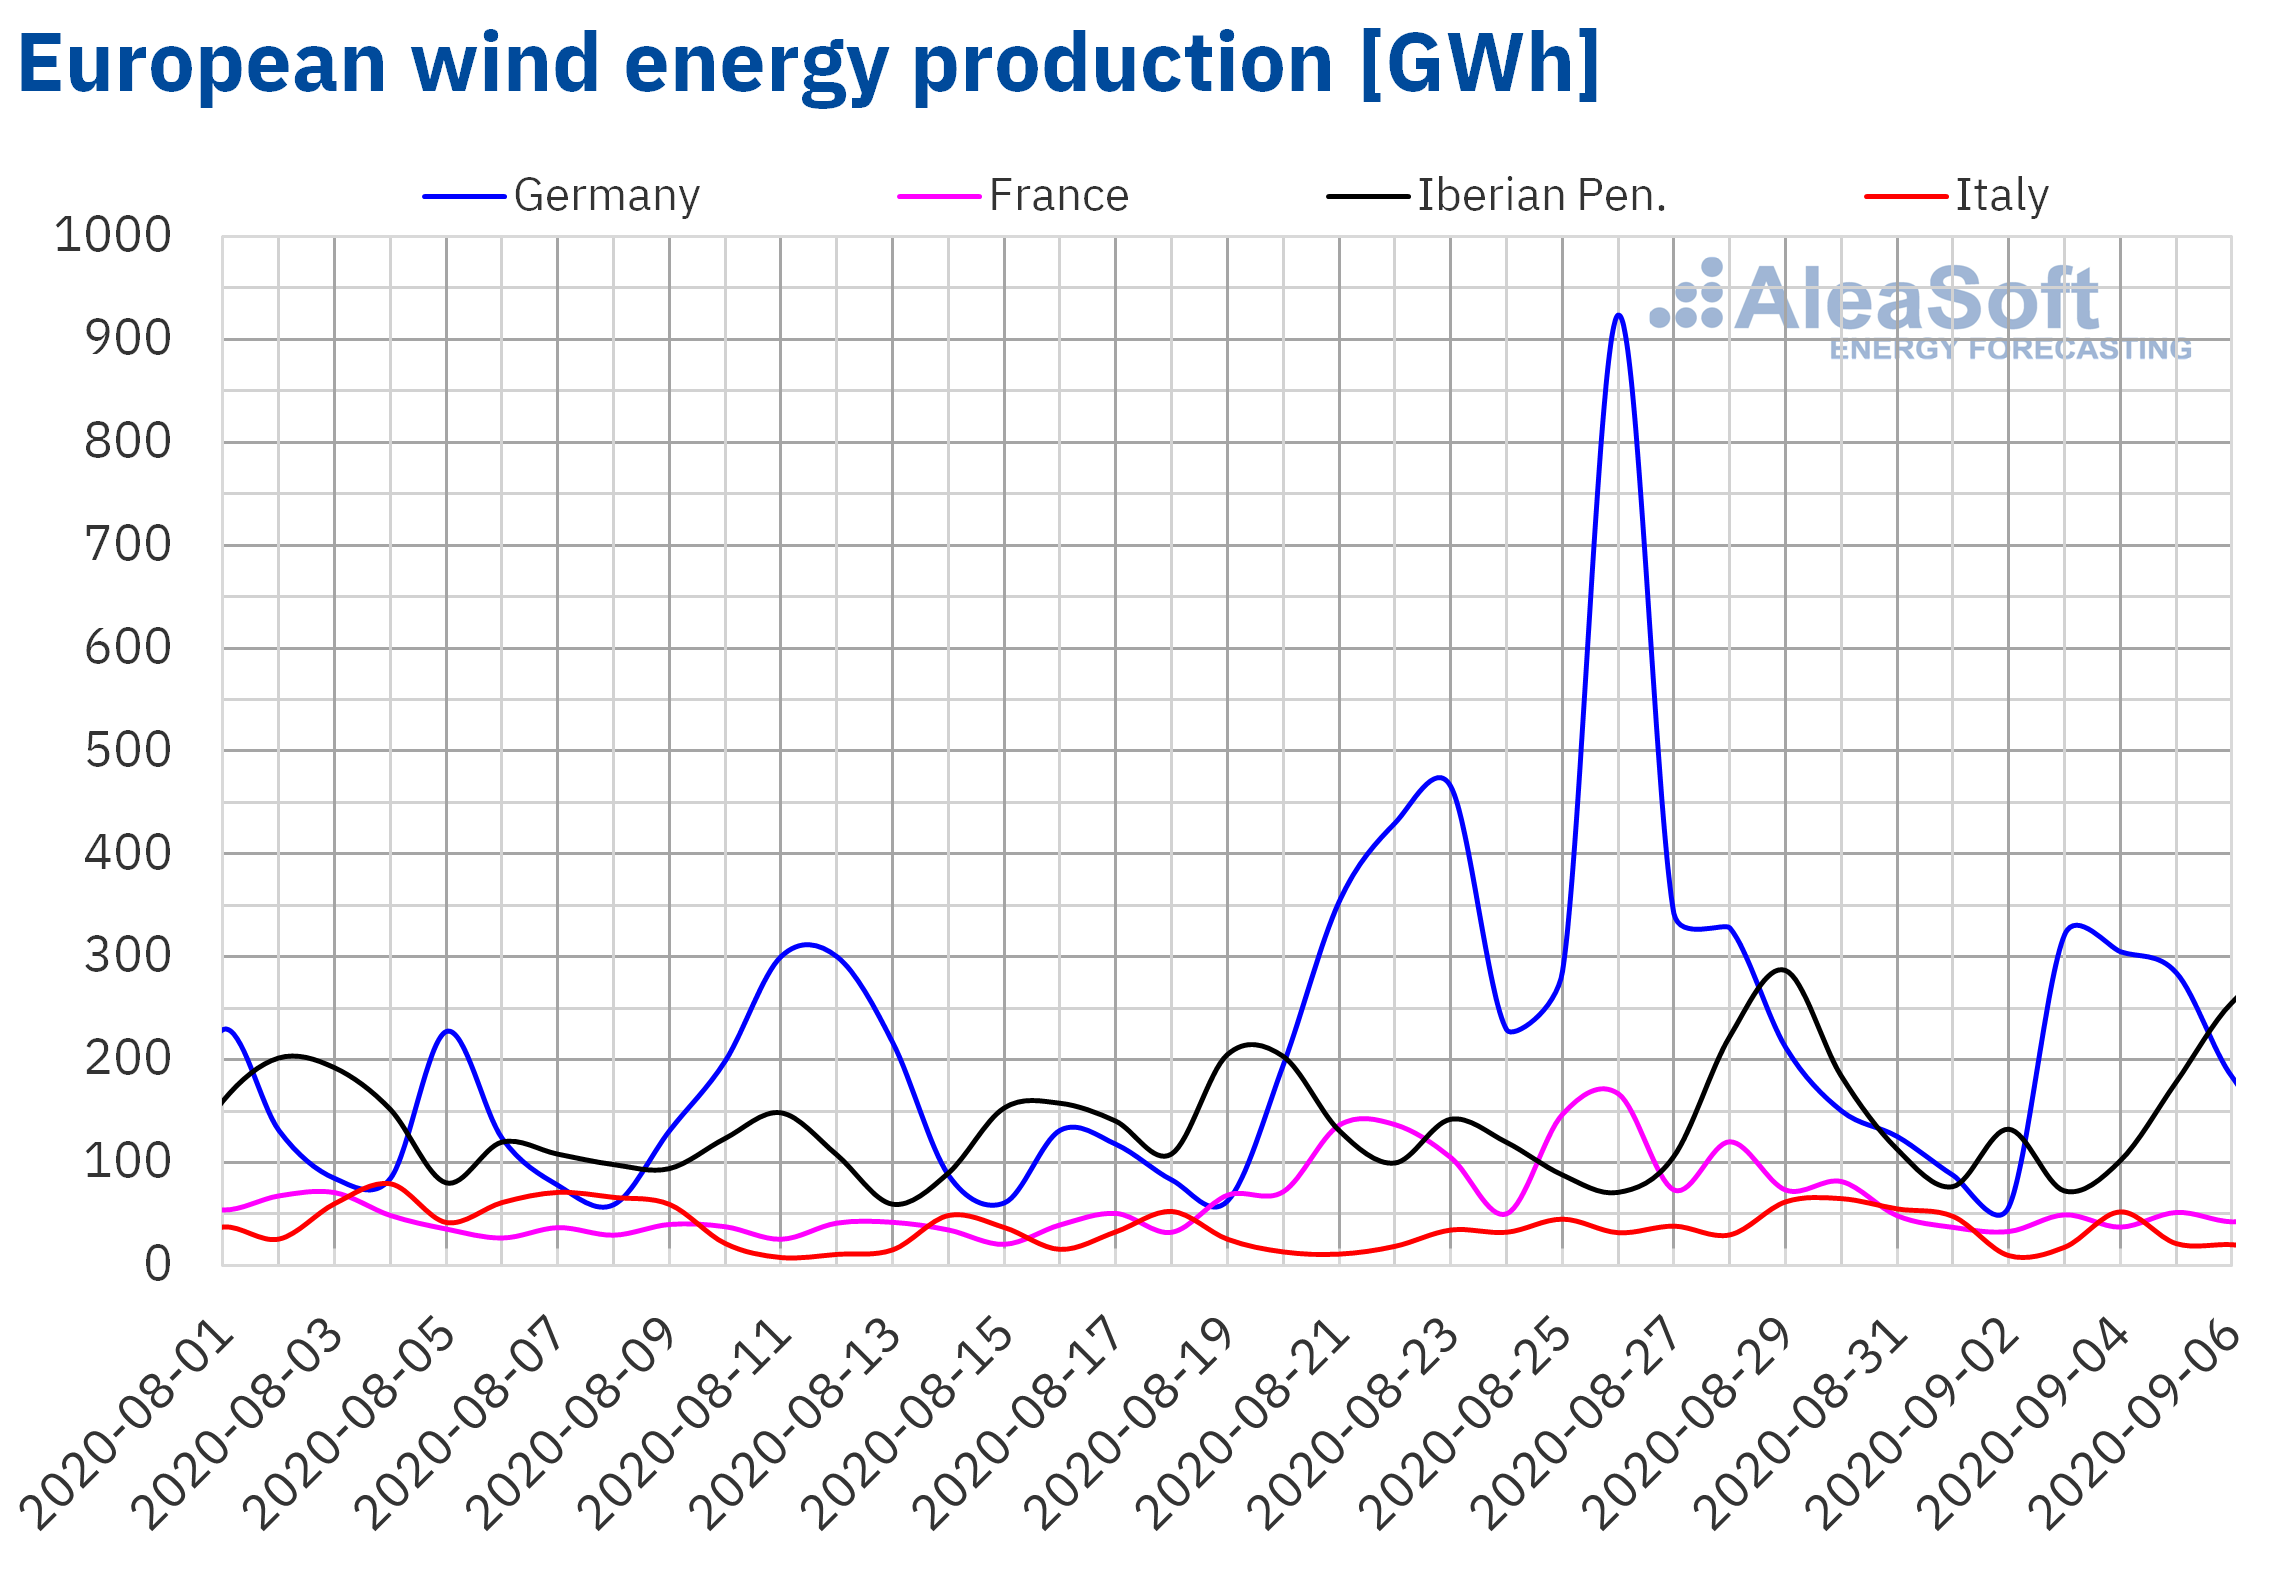
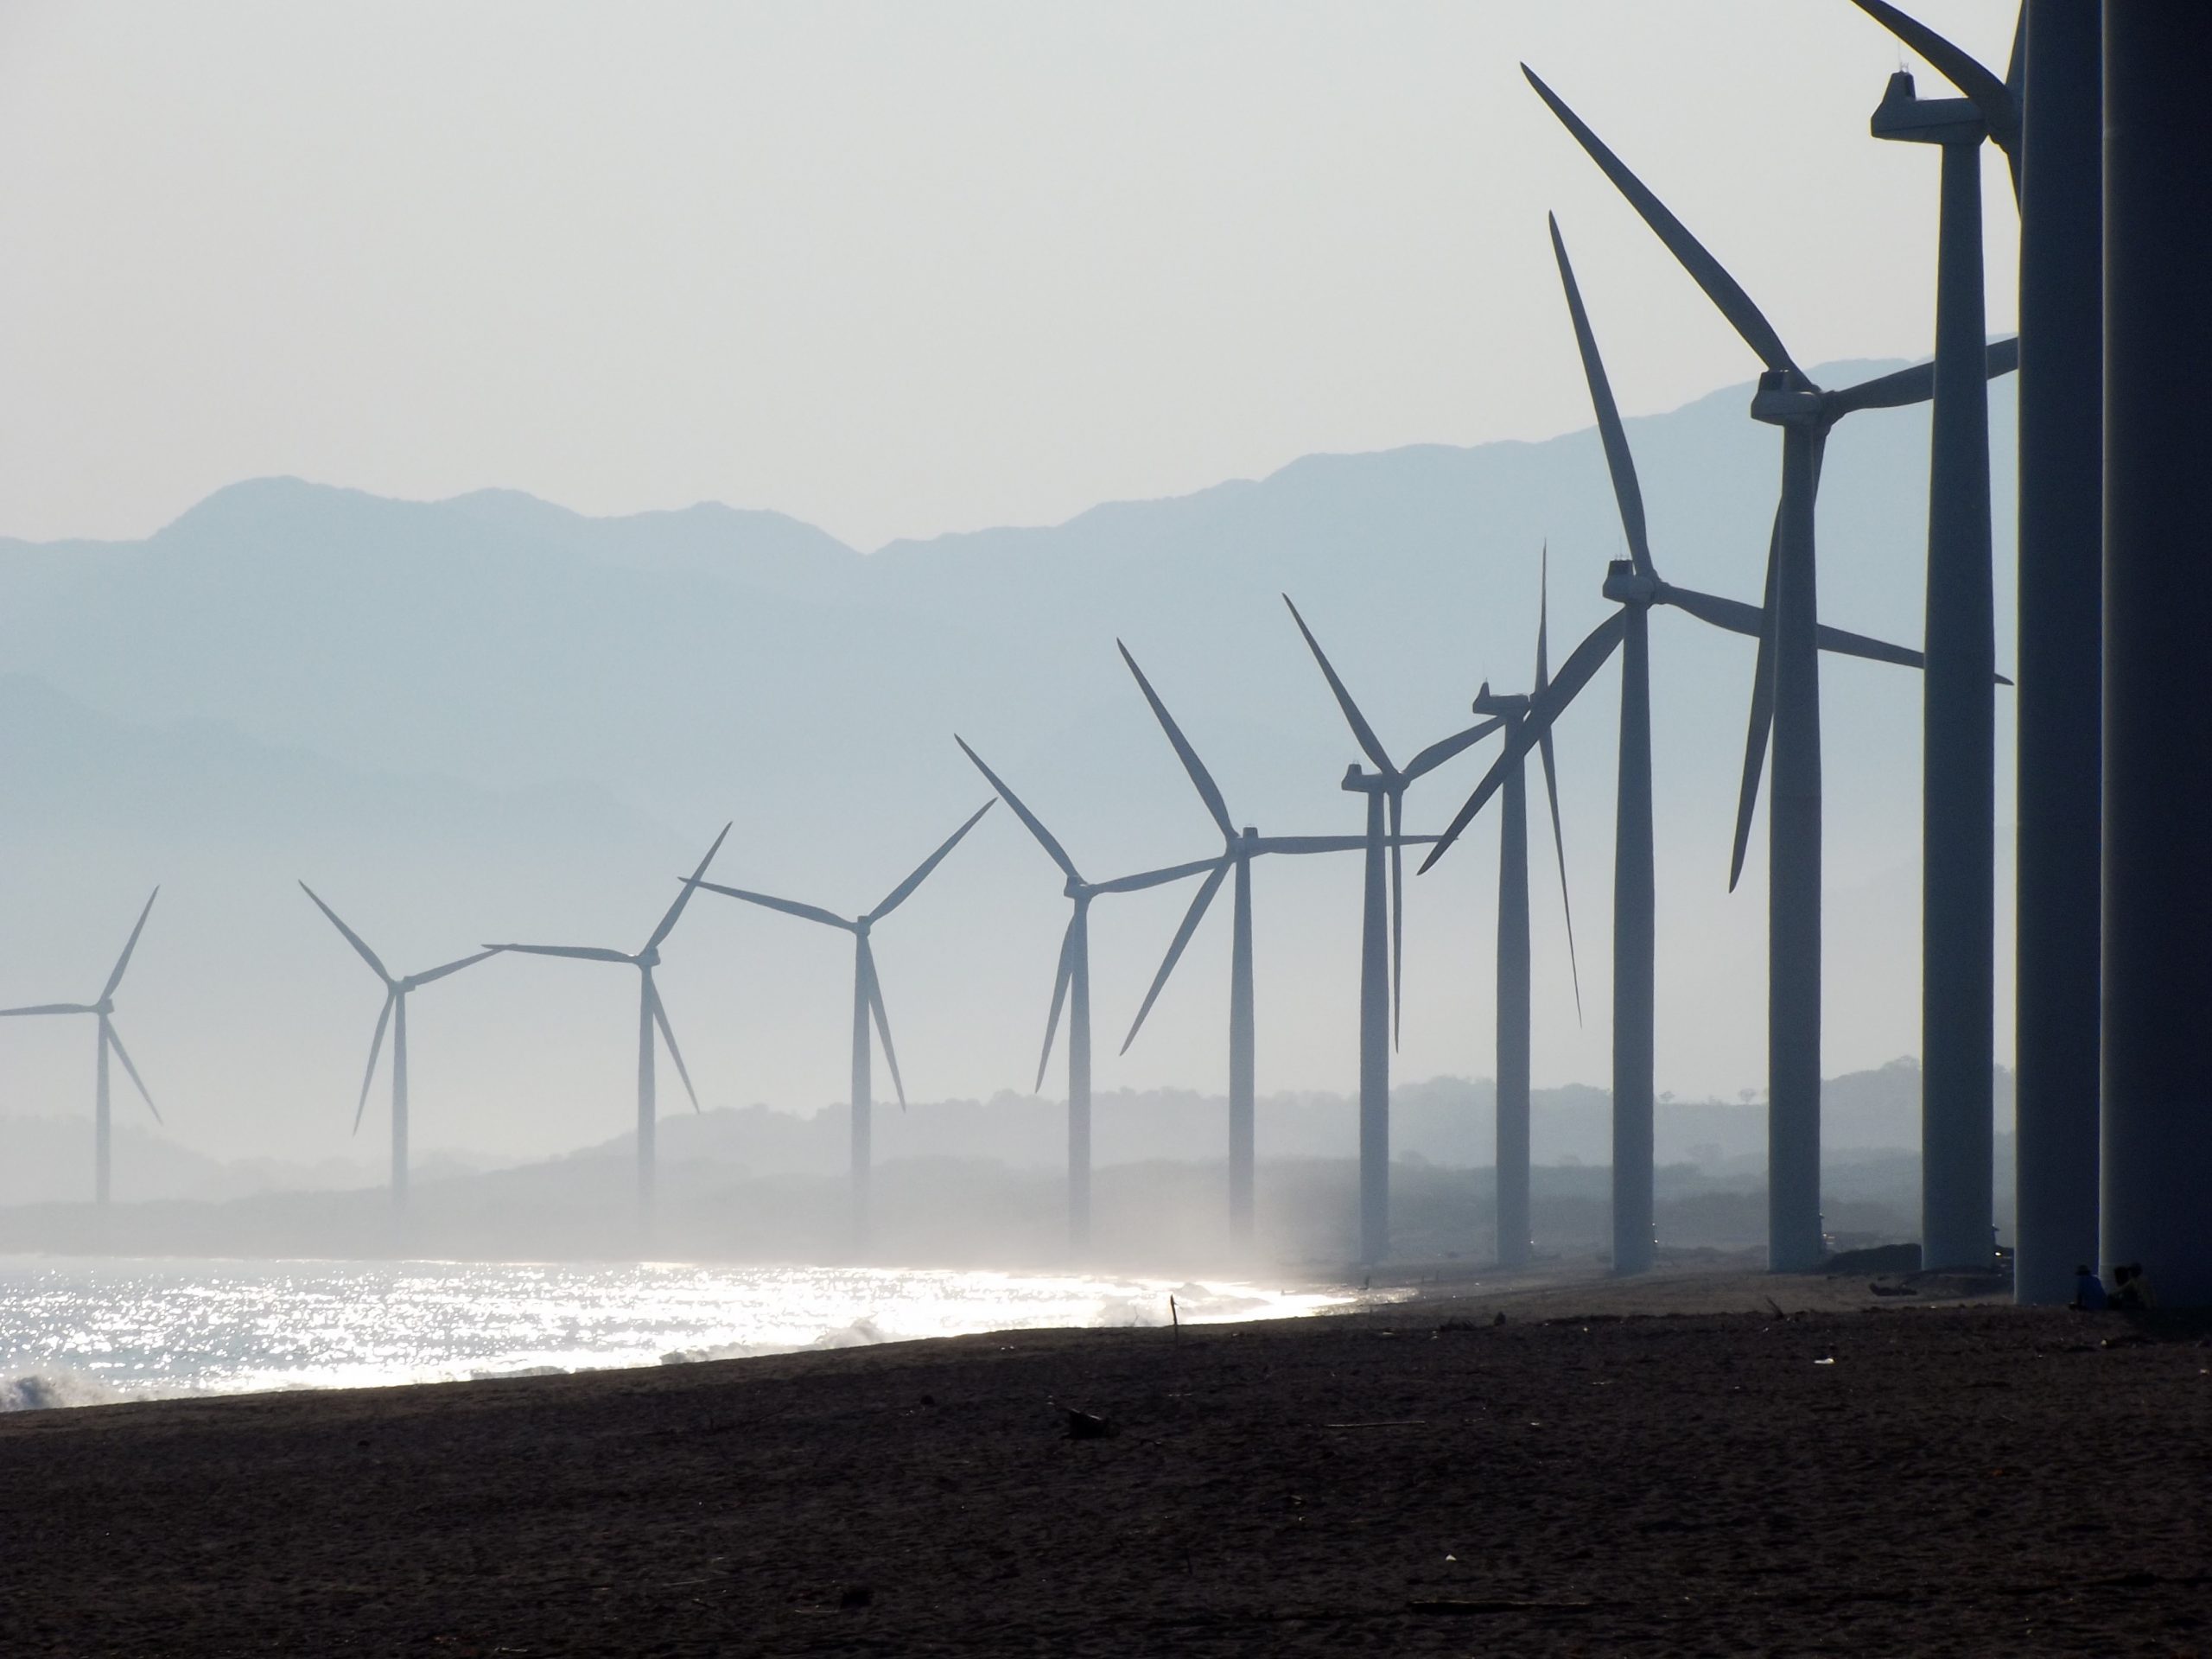
During the week that began on August 31, the wind energy production decreased in all the markets analysed at AleaSoft compared to the previous week. In the markets of France and Portugal the decreases were 58% and 52% respectively. In the German market, the production decreased by 45% and in the Italian market by 26%. The lowest variation was registered in the Spanish market and it was ‑1.6%.
In the year‑on‑year analysis, during the first six days of September, the wind energy production also decreased in all the markets analysed at AleaSoft. In this case, the largest reduction was 53% and it was registered in the Portuguese market. In the French market, the production fell by 33%, in the Spanish and German markets by 30% in each case and in the Italian market by 15%.
For the current week, which began on September 7, the AleaSoft‘s wind energy production forecasting indicates an increase in production in Germany, Portugal and Spain. On the contrary, it is expected that in the Italian and French markets it will decrease compared to the previous week.
 Source: Prepared by AleaSoft using data from ENTSO-E, RTE, REN, REE and TERNA.
Electrcity demand
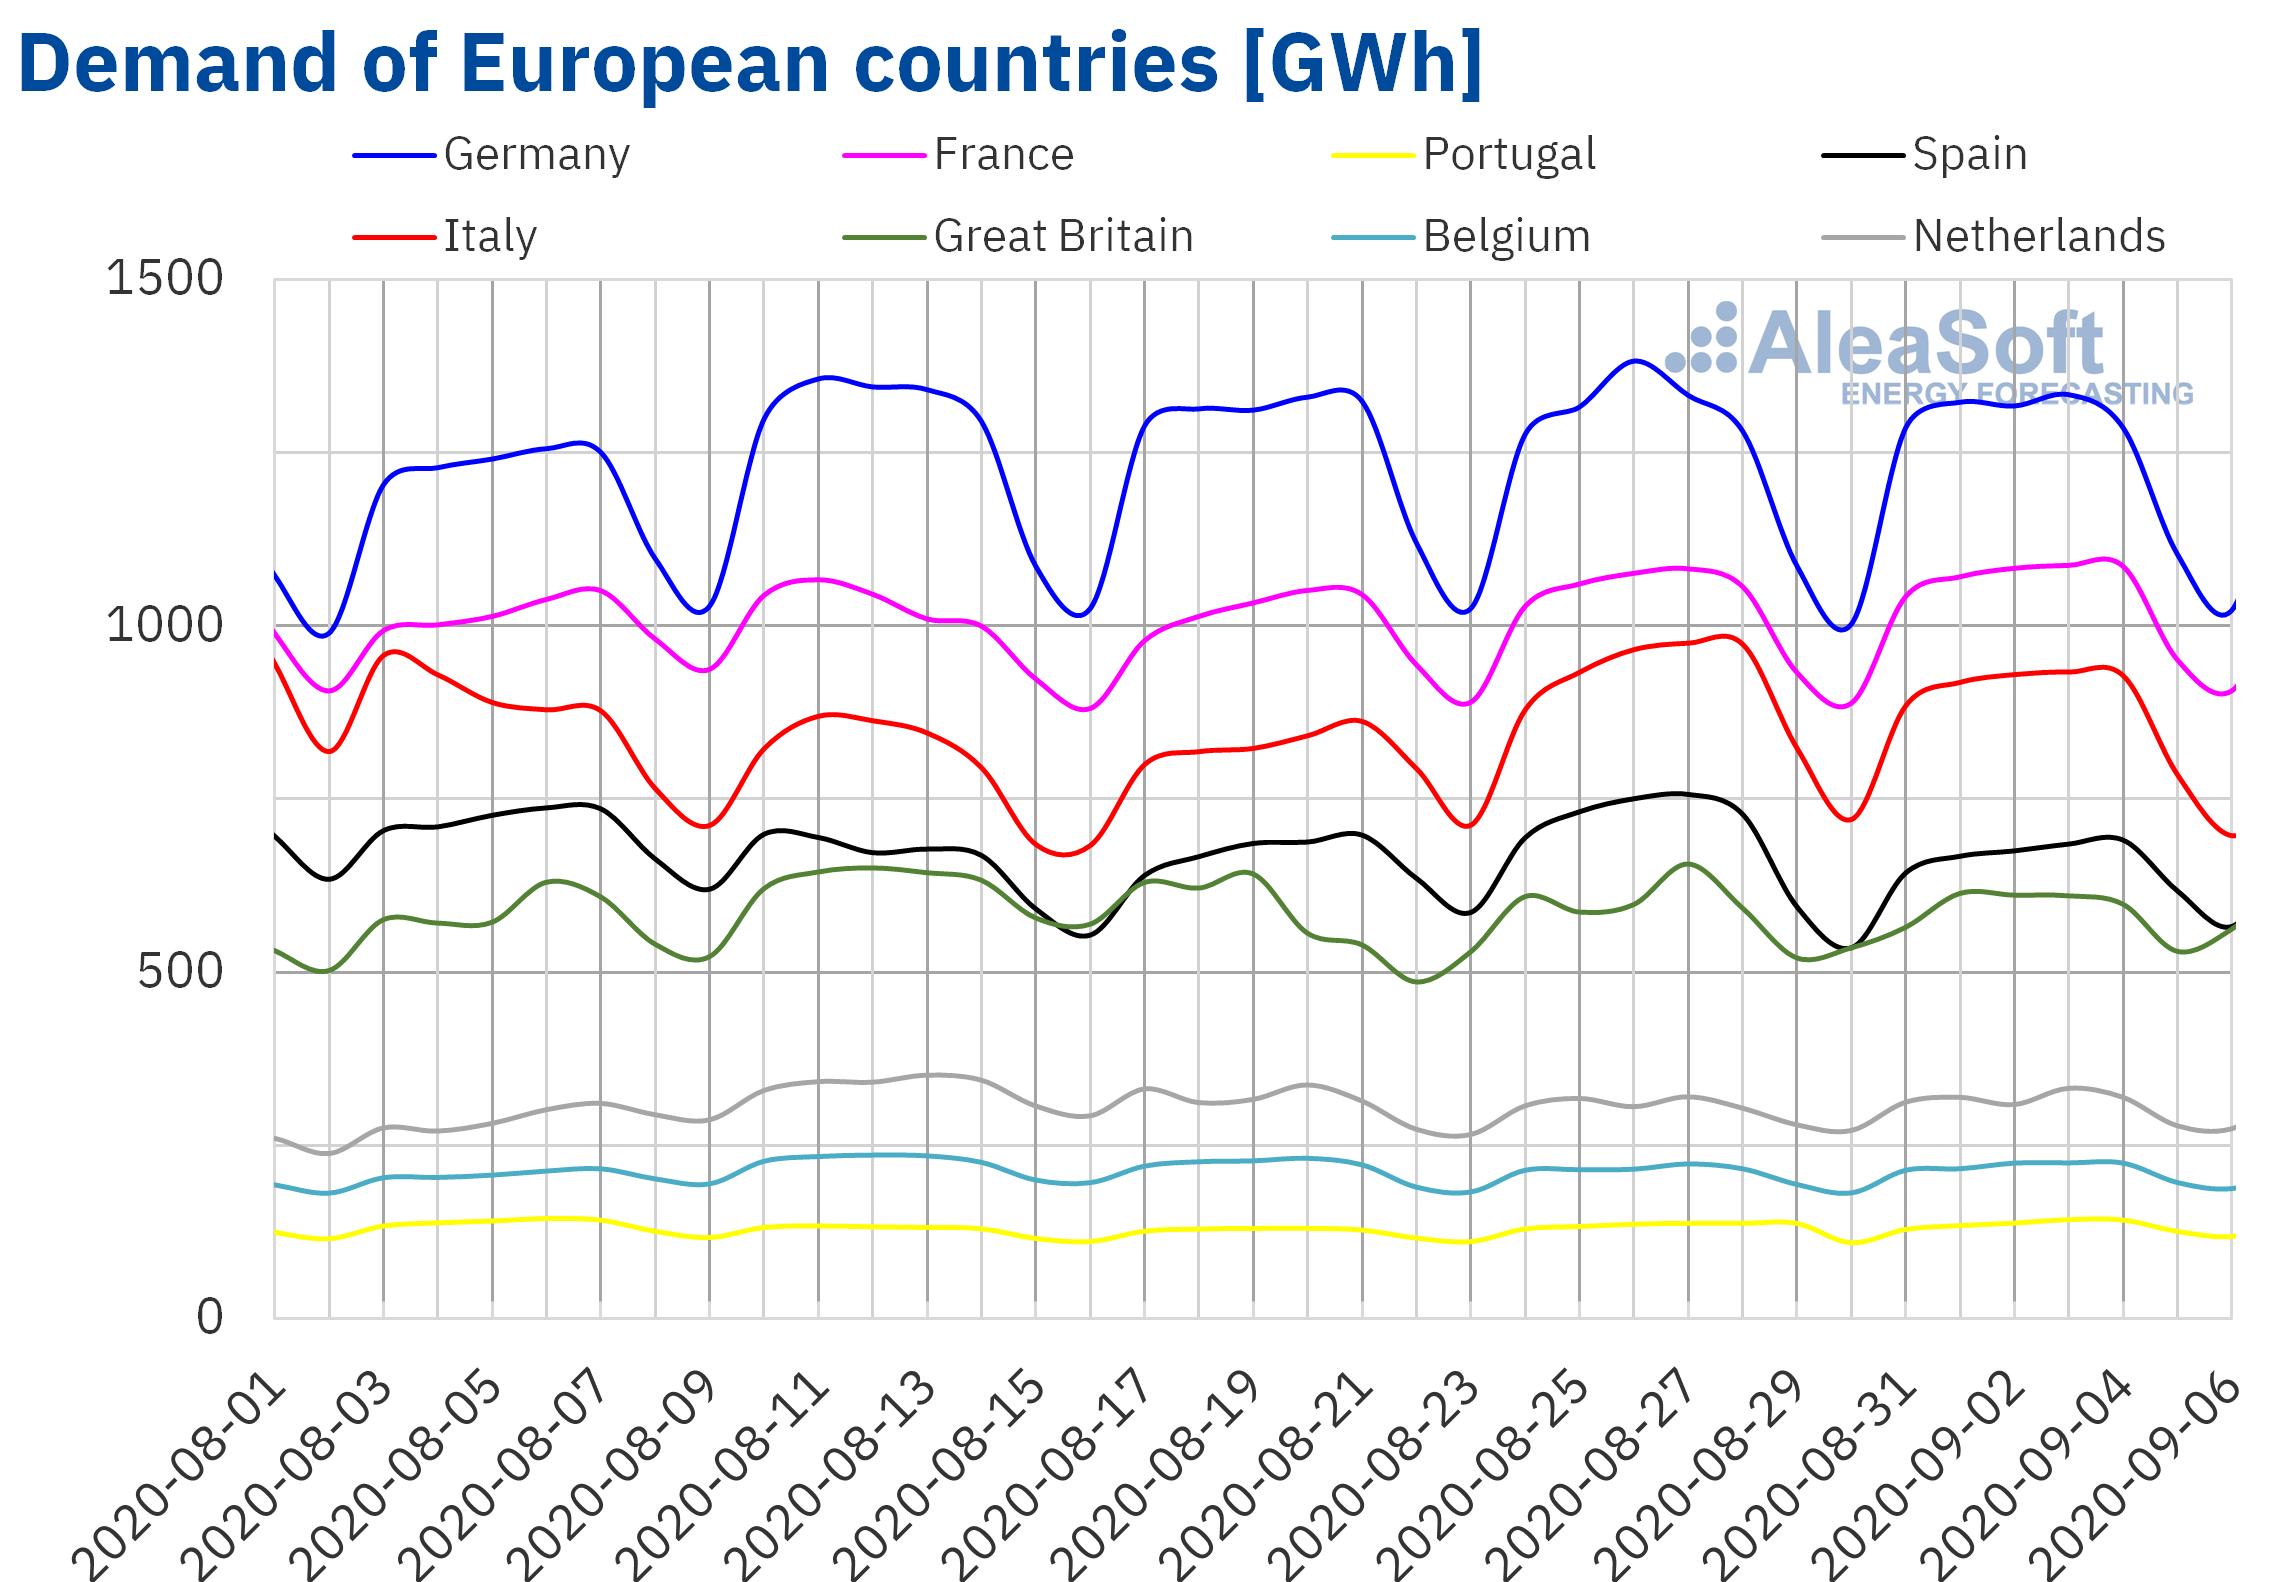
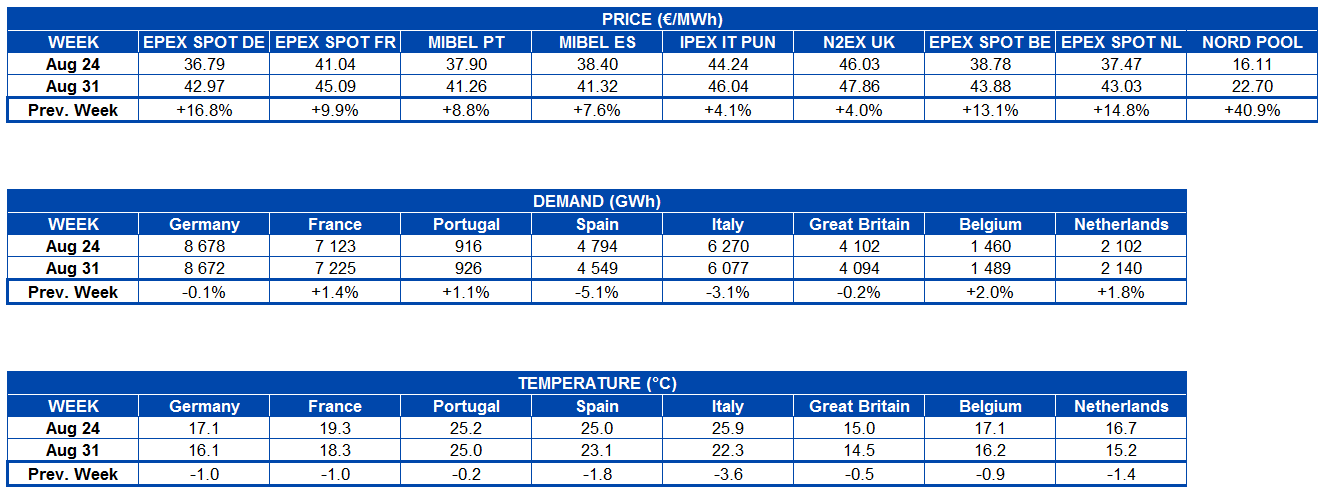
The electricity demand behaved heterogeneously in the European markets during the week of August 31. The average temperatures fell 3.6 °C in Italy and 1.8 °C in Spain compared to those of the previous week, which favoured the declines in demand of 3.1% and 5.1% respectively. In the markets of Great Britain and Germany, the demand remained similar to that of the week of August 24. On the other hand, there were increases in demand below 2% in the markets of France, Portugal and Belgium.
This demand behaviour can be analysed at the AleaSoft’s electricity markets observatories, which have hourly, daily and weekly data visualisations.
For the week of September 7, the AleaSoft’s demand forecasting indicates that the demand will decrease in most European markets.
 Source: Prepared by AleaSoft using data from ENTSO-E, RTE, REN, REE, TERNA, National Grid and ELIA.
 European electricity markets
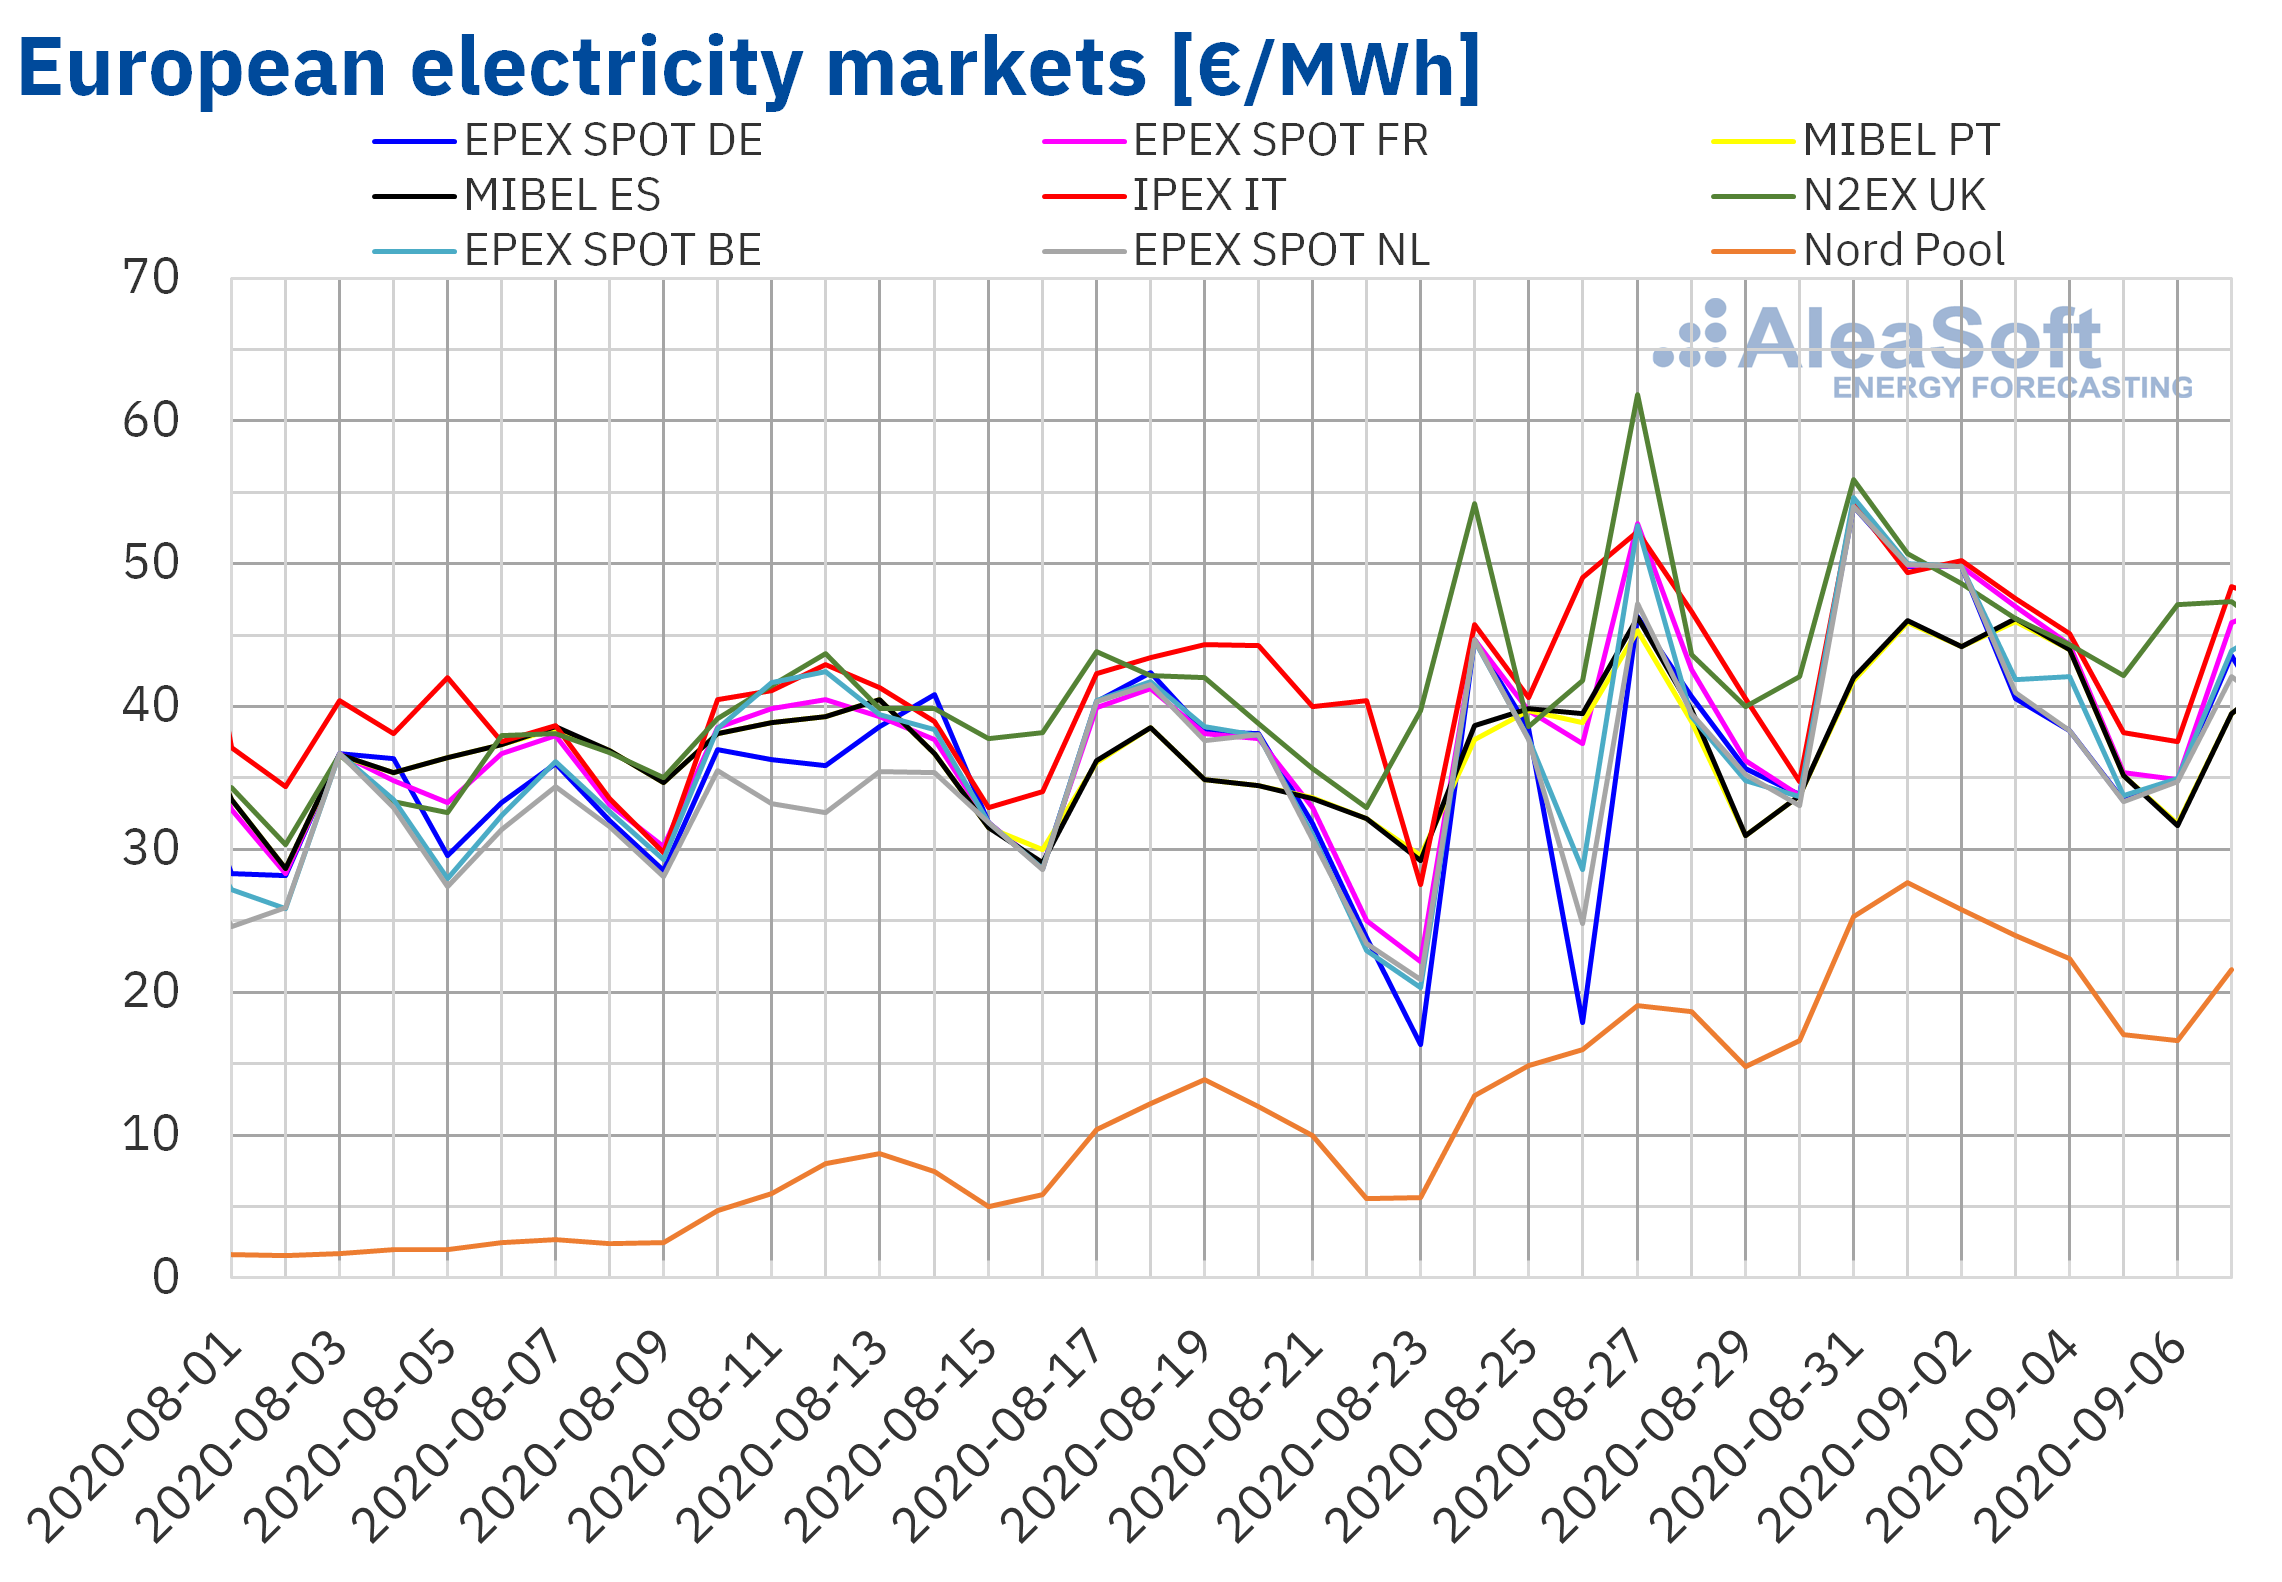
During the week of August 31, the prices continued with the upward trend and they were higher than those of the previous week in all the analysed European electricity markets. The market with the highest price increase, of 41%, was the Nord Pool market of the Nordic countries, followed by the EPEX SPOT market of Germany, with an increase of 17%. In contrast, the markets where the price rose the least were the N2EX market of Great Britain and the IPEX market of Italy, with increases of 4.0% and 4.1% respectively. In the rest of the markets, the price increases were between 7.6% of the MIBEL market of Spain and 15% of the EPEX SPOT market of the Netherlands.
During the week of August 31, all the analysed European electricity markets reached weekly averages above €40/MWh, except the Nord Pool market. This was the market with the lowest average price, of €22.70/MWh. The rest of the markets had average prices between €41.26/MWh of the Portuguese market and €47.86/MWh of the British market.
From Monday, August 31, to Thursday, September 3, the daily prices of all electricity markets, except the Nord Pool market, remained above €40/MWh. Furthermore, in the first week of September, daily prices above €50/MWh were reached in almost all markets, with the exception of the MIBEL and Nord Pool markets. The highest daily price of the week, of €55.87/MWh, was reached on August 31 in the British market.
In the first days of the week of August 31, the electricity markets prices were closely coupled, except those of the MIBEL and Nord Pool markets, which were lower. On the other hand, in the last days of the week, the behaviour of the British market also separated from the general trend of the rest of the markets, being the only market that maintained daily prices above €40/MWh.
 Source: Prepared by AleaSoft using data from OMIE, , N2EX, IPEX and Nord Pool.
The general decline in wind energy production and in solar energy production, in this case in southern Europe, together with the recovery in gas prices, favoured the price increases of the European electricity markets in the week of August 31. Other factors that helped in this rise were the lower French nuclear energy availability and the CO2 prices, which continued with values above €27/t.
The AleaSoft‘s price forecasting indicates that in the week of September 7 the prices might fall in most European markets influenced by the increase in renewable energy production.
Electricity futures
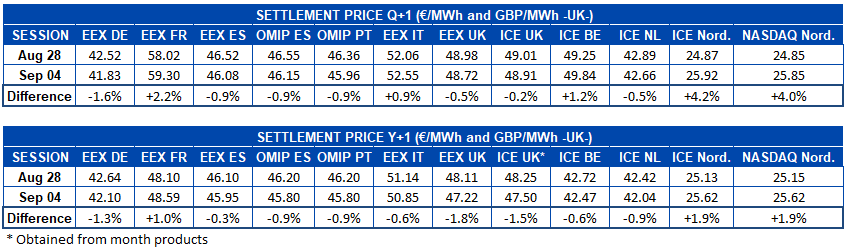
During the week of August 31, the European electricity futures markets registered heterogeneous behaviour for the product of the next quarter. On the one hand, in the EEX market of France and Italy, the ICE market of Belgium and the Nordic countries, together with the NASDAQ market also of the Nordic countries, the prices increased compared to the end of the previous week of August 24. Out of all those mentioned, the ICE market of the Nordic countries was the one with the highest percentage increase, with a 4.2% difference. However, as happened on other occasions, the high percentage increase is fundamentally due to the fact that the prices in this market are considerably lower than those of the rest of the markets, since in absolute terms, the EEX market of France was the one with the highest increase, of €1.28/MWh. In the rest of the markets analysed at AleaSoft, the decreases did not exceed 1%, except in the case of the EEX market of Germany, which registered the greatest decrease of the week, with a 1.6% decrease.
The product of the calendar year 2021 had a similar behaviour, although more marked downwards in general. In this case, the prices only increased in the EEX market of France and the Nordic region, both in the ICE market and in the NASDAQ market. In the rest of the markets there were decreases that vary between 0.3% of the EEX market of Spain and 1.8% of the same market of Great Britain. In this product, the British and German markets were the only markets in which the decreases were greater than 1%.
Brent, fuels and CO2
The Brent oil futures prices for the month of November 2020 in the ICE market, every day of the week of August 31, had prices lower than those of the same days of the week of August 24. The maximum settlement price of the week, of $45.58/bbl, was reached on Tuesday, September 1. While the minimum settlement price, of $42.66/bbl, was registered on Friday, September 4. This price was 6.9% lower than that of Friday, August 28, and the lowest since the beginning of July.
During the first week of September, the concerns about the evolution of the demand due to the increase in COVID‑19 cases continued to exert its downward influence on the Brent oil futures prices. The strengthening of the dollar was added to this, also favouring the decline in prices. Although the decrease in production that occurred in America due to the hurricanes Marco and Laura partially offset these influences.
The second week of September begins with news of price cuts from Saudi Arabia to its Asian customers. This, together with the recovery of the production levels in America, may help the prices to continue falling in the coming days.
As for the TTF gas futures prices in the ICE market for the month of October 2020, the first week of September they remained above €11/MWh. The maximum settlement price of the week, of €11.73/MWh, was reached on Thursday, September 3. This value is 14% higher than that of the previous Thursday, August 27. In addition, it is the highest since the second fortnight of February.
Regarding the TTF gas in the spot market, the first week of September the prices had a generally upward trend, going from €9.63/MWh of Monday, August 31, to €11.51/MWh of the weekend of September 5 and 6. This index price reached at the weekend is the highest since the first fortnight of January.
On the other hand, the API 2 coal futures in the ICE market for the month of October 2020 began the first week of September with price increases. As a result, on Tuesday, September 1, the maximum settlement price of the week, of $53.75/t, was reached. This price was 9.1% higher than that of Tuesday, August 25, and the highest since the beginning of August. However, the declines in subsequent days led to a settlement price of $52.30/t on Friday, September 4, which was 0.9% lower than that of the Friday of the previous week.
As for the CO2 emission rights futures prices in the EEX market for the reference contract of December 2020, during the first week of September they oscillated taking values between €28.74/t of Thursday, September 3, and the €27.35/t of Friday, September 4.
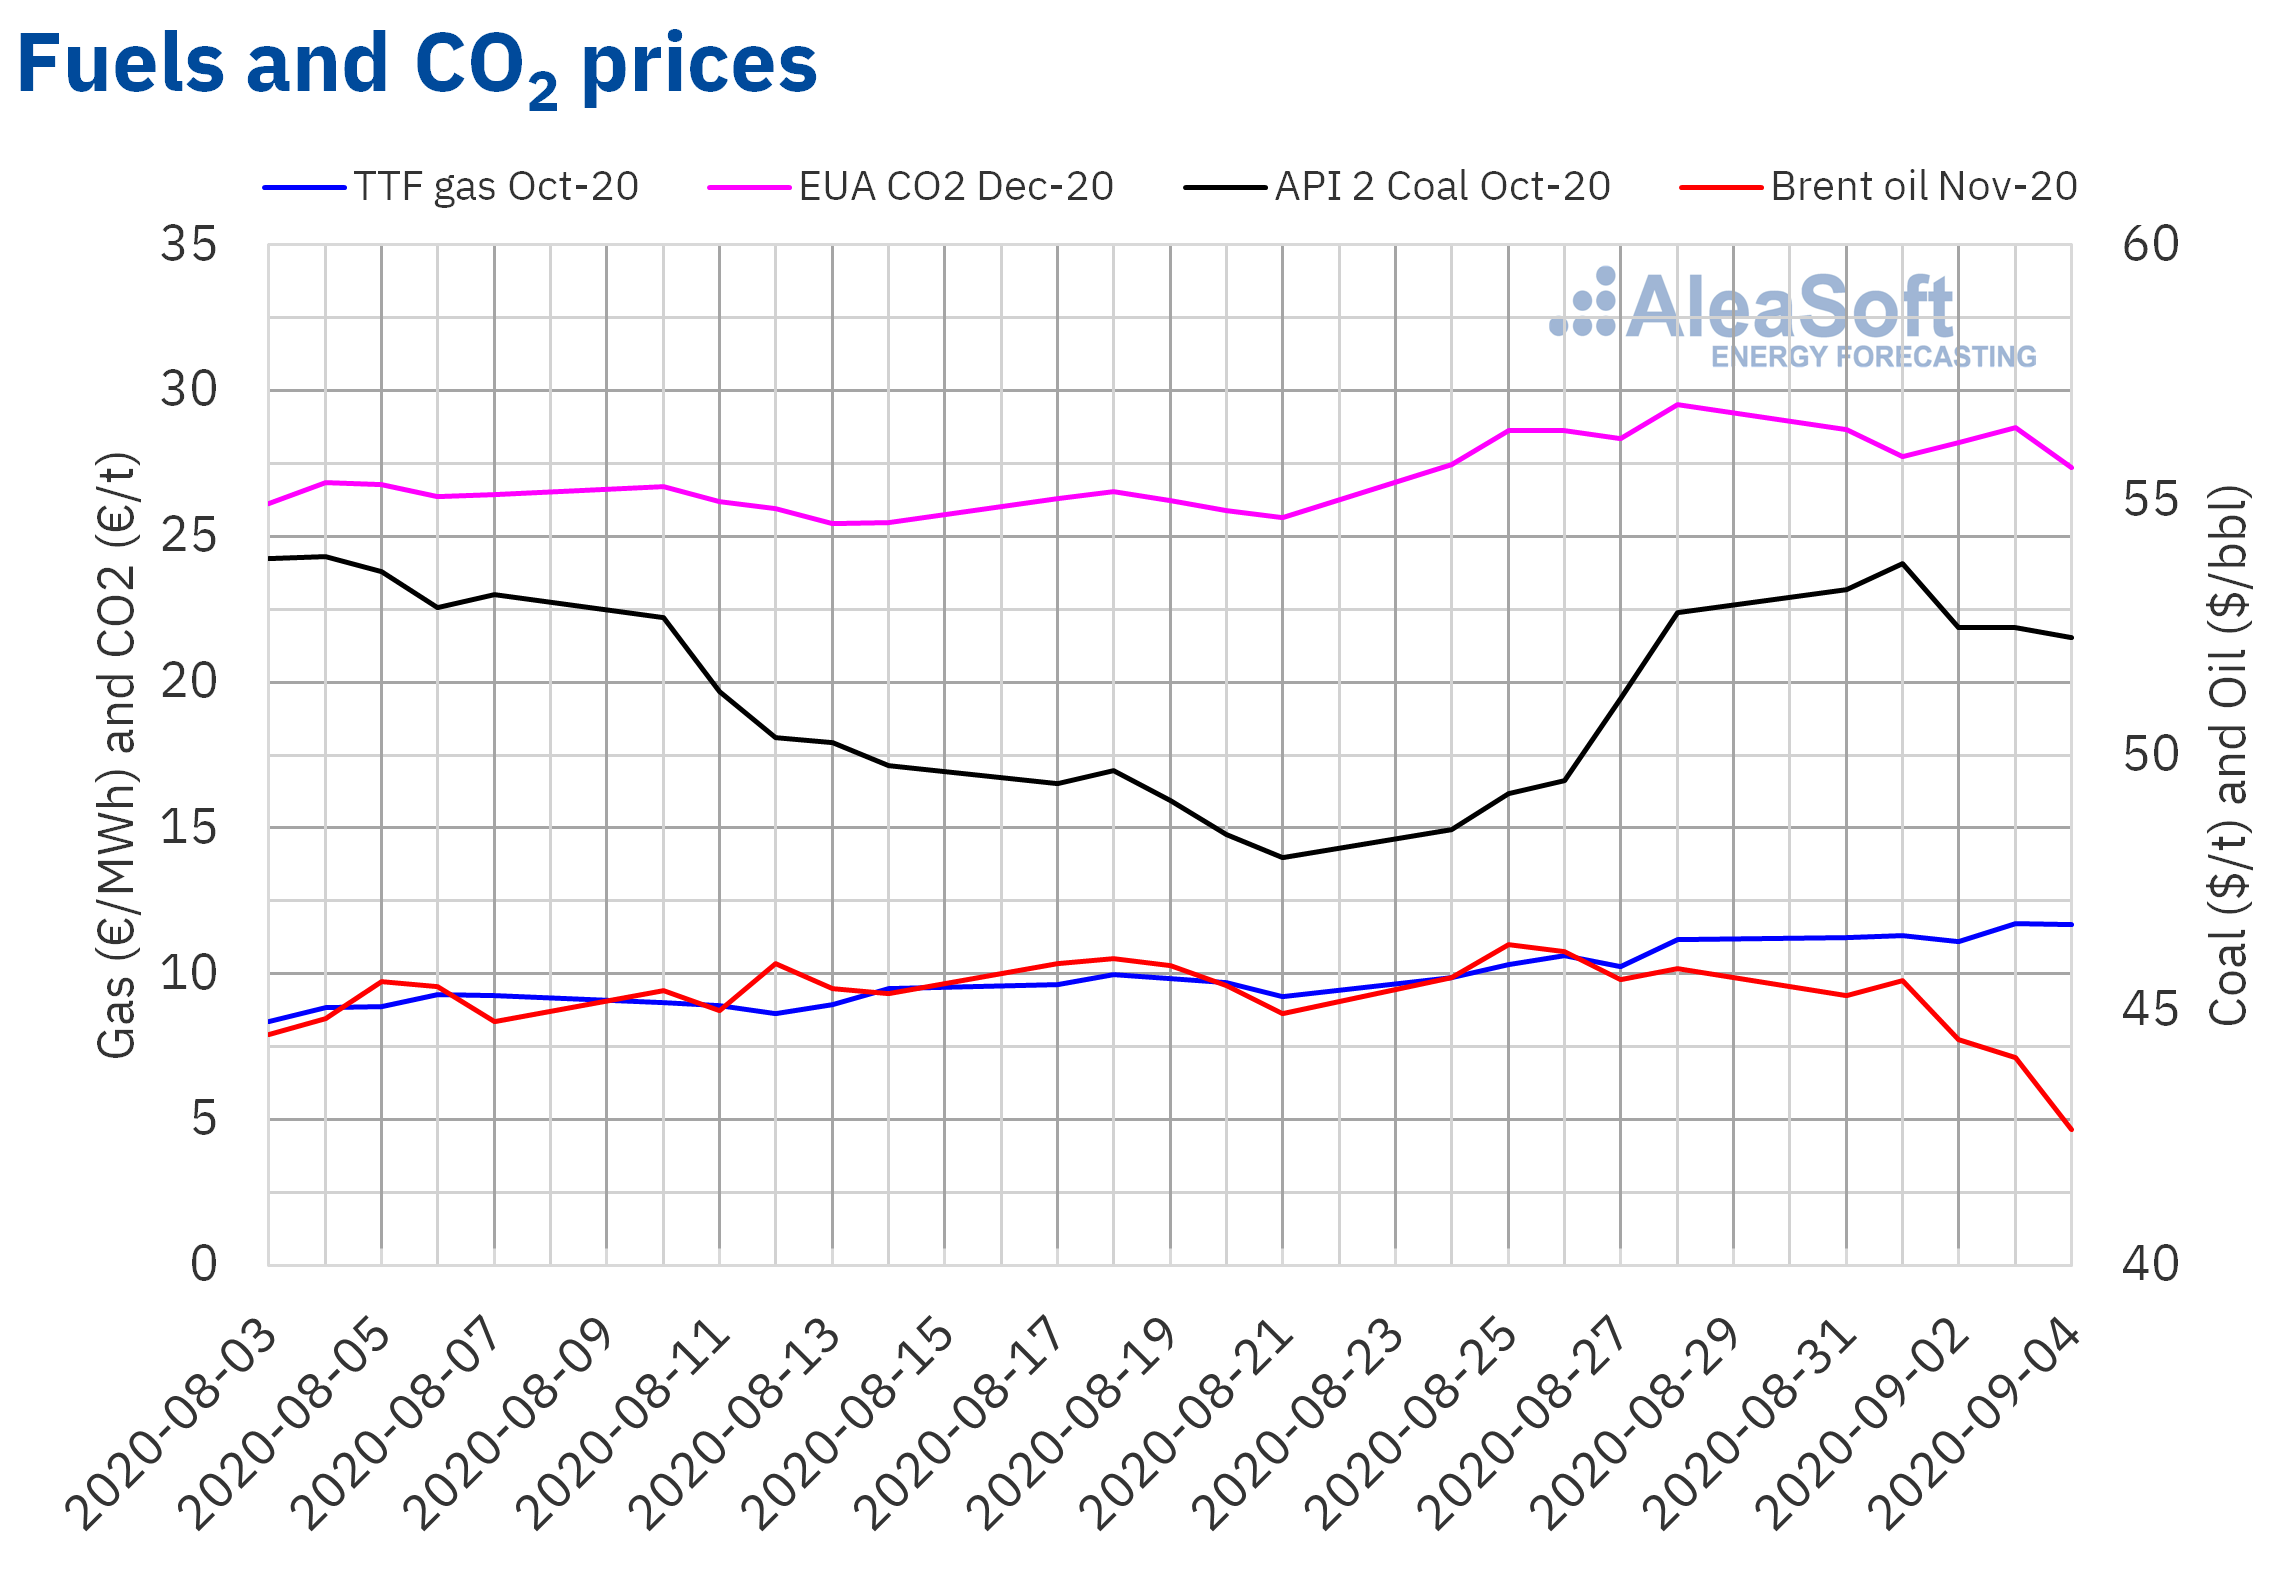 Source: Prepared by AleaSoft using data from ICE and EEX.
AleaSoft analysis of the recovery of the energy markets at the end of the economic crisis
On September 17, the first part of the series of webinars “Energy markets in the recovery of the economic crisis” that is being organised at AleaSoft will be held. The topics to be discussed will be the evolution of the energy markets in the economic recovery, the financing of the renewable energy projects and the importance of the forecasting in the audits and in the portfolio valuation. All these issues are being affected by the uncertainty that the increase in COVID‑19 cases is generating, which is feared that they may continue to increase with the face‑to‑face return to classrooms and with the arrival of autumn, and that make it difficult to predict when and how the coronacrisis will end. On October 29, the second part of this series of webinars will be held in which the evolution of the markets will be analysed and all these topics will be studied in depth. The webinar series will feature speakers from Deloitte, Engie, Banco Sabadell and AleaSoft.
The AleaSoft‘s price curves of the European electricity markets are periodically updated with the most up‑to‑date economic growth data and taking into account the most recent scenarios of recovery from the economic crisis.
To analyse the evolution of the energy markets, the observatories were enabled on the AleaSoft website. This tool includes graphs that are generated with daily updated data of the main variables of the European electricity, fuels and CO2 emission rights markets.
Source: AleaSoft Energy Forecasting.