AleaSoft, January 2, 2020. The year 2019 was a good year for the European solar and wind energy production as it increased in all markets. The electricity demand declined across the continent. The combination of these factors, as well as the decrease in gas and coal prices, favoured the decrease in the electricity markets prices.
Photovoltaic and solar thermal energy production, wind energy production and electricity demand
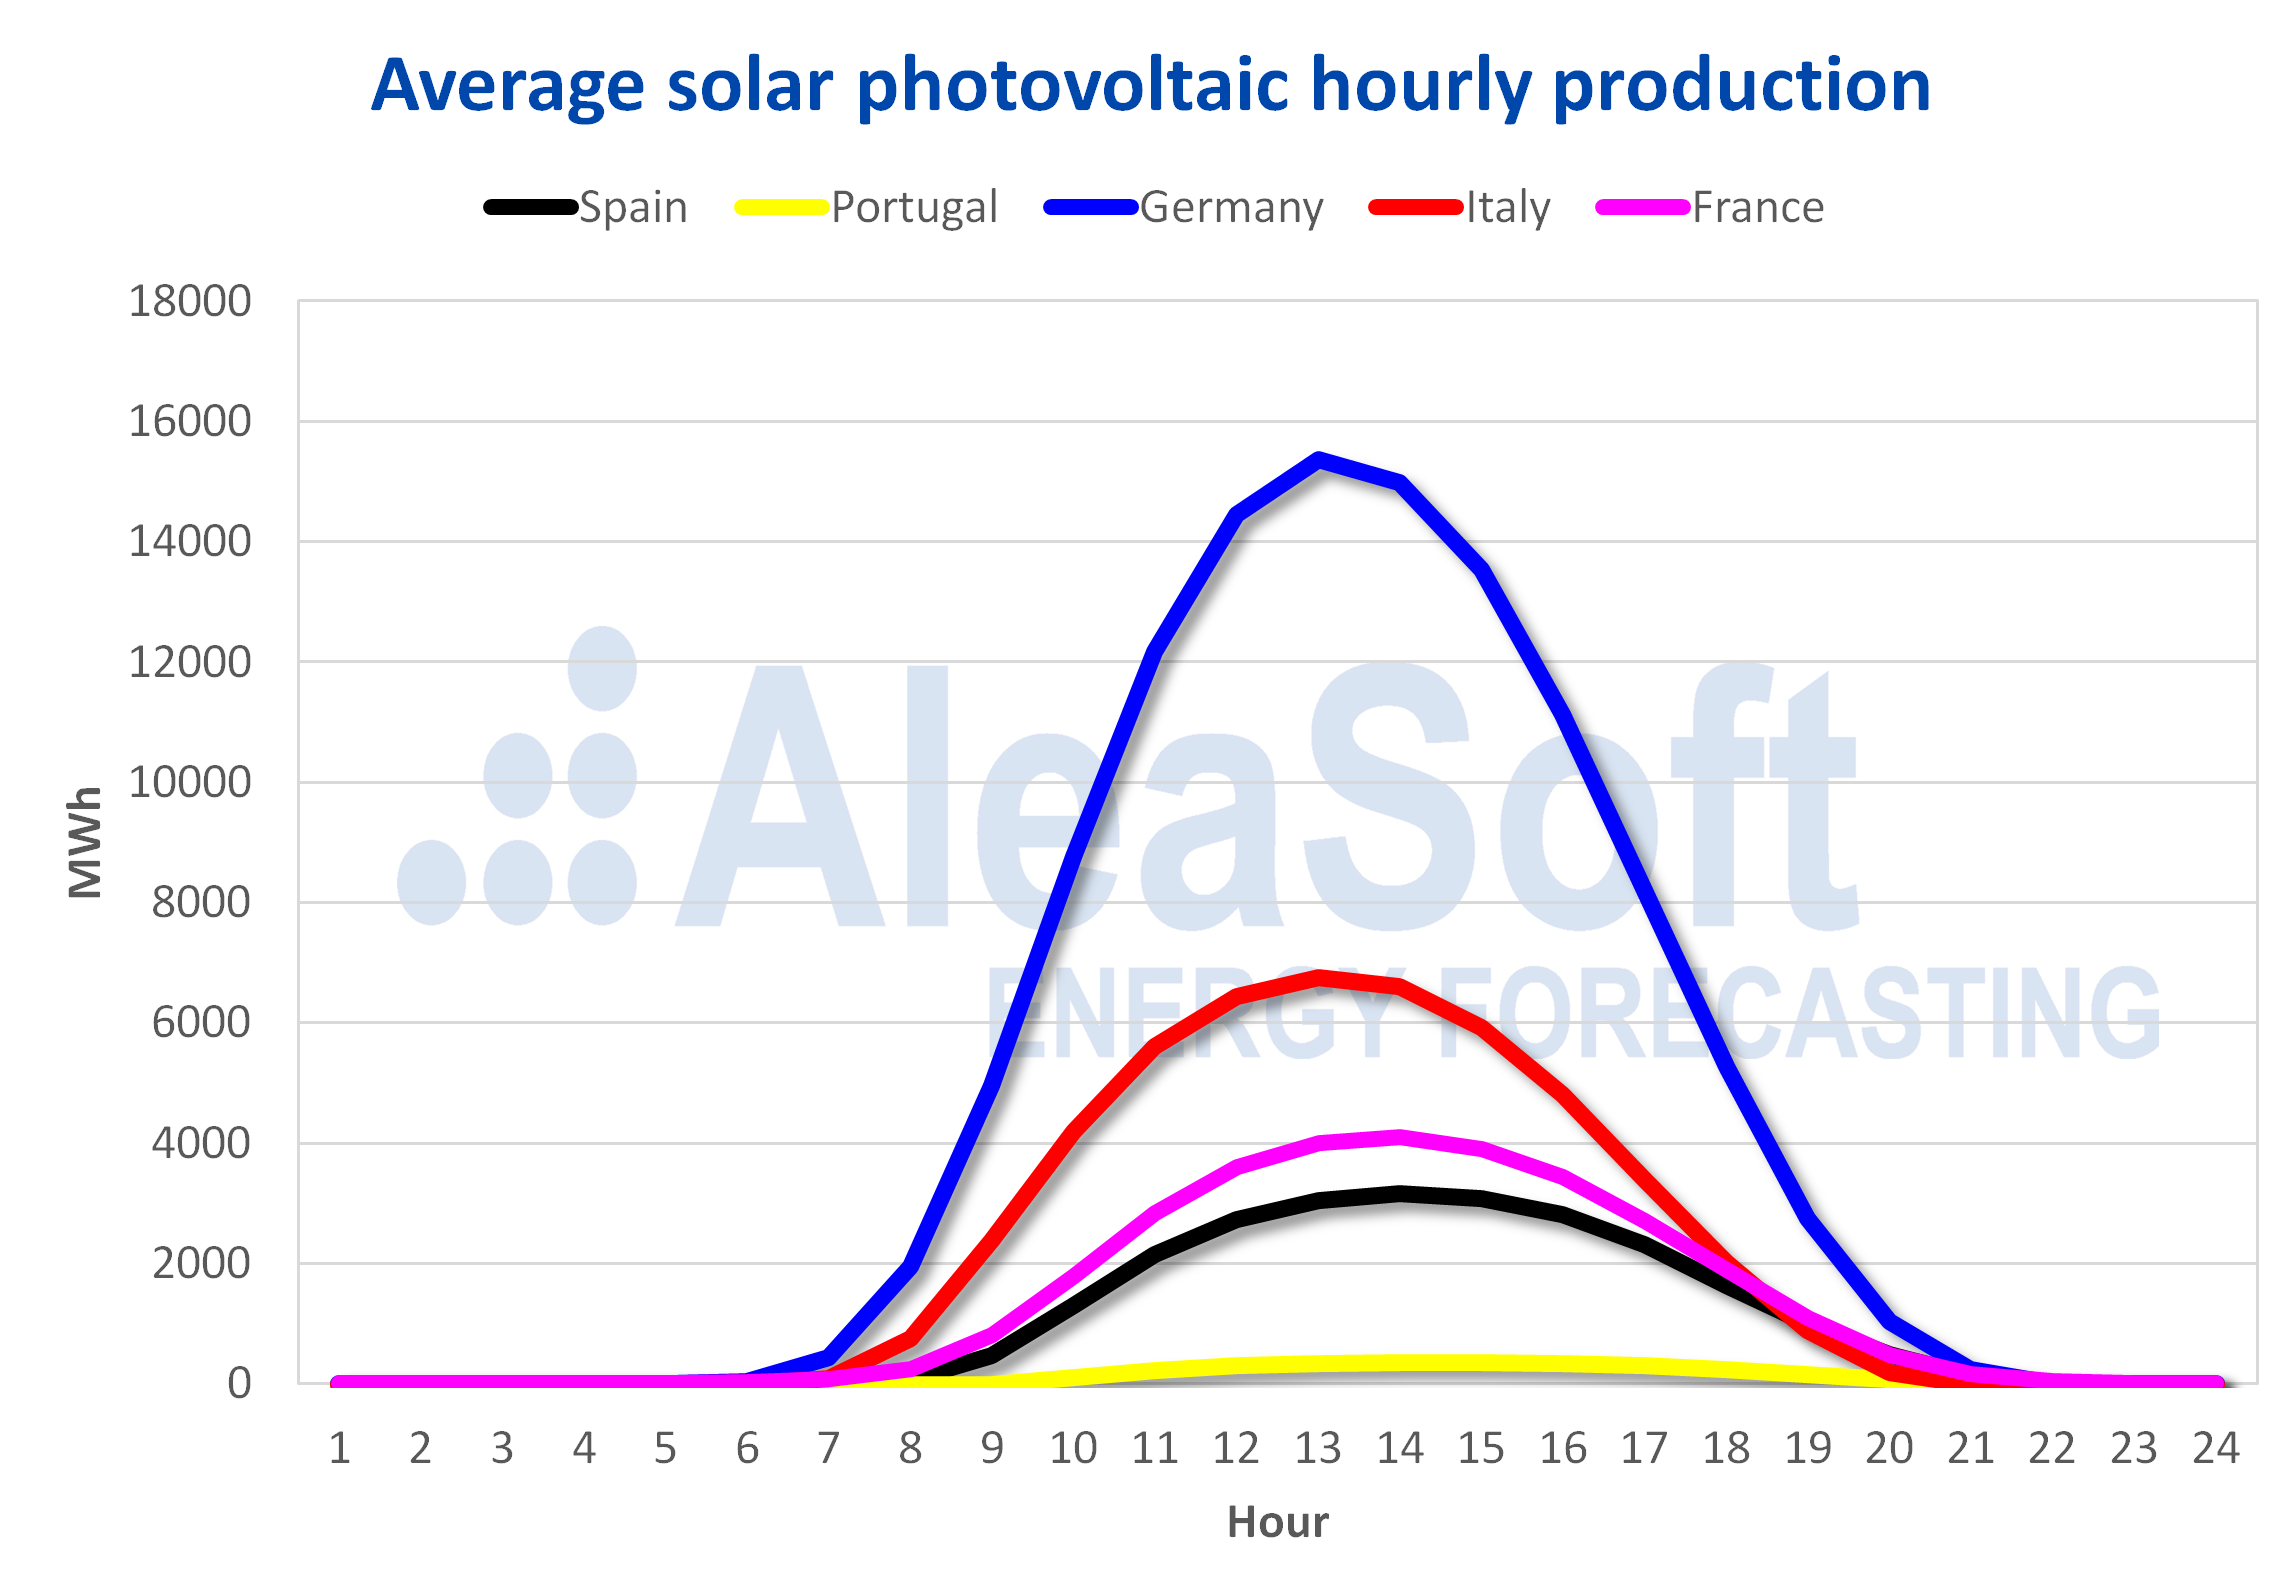
Within the framework of the energy transition that crosses the European continent, the increase in the installed capacity of solar energy, mainly photovoltaic energy, led to a 2019 when the solar energy production was superior to that of 2018 in general. The Spanish market was the one that advanced the most in absolute terms, exceeding the annual record of the previous year by 2.2 TWh. In the Portuguese market, the production exceeded the terawatt hour for the first time and the increase was 27%. The increases in the rest of the markets were between 1 TWh and 2 TWh, among which Germany had the most discrete percentage growth in Europe, of 2.5%.
Among the highlighted data, there was the rise of the solar energy production in the French market in all monthly periods or higher, compared to 2018. Germany remained being the country that covers most of the demand with solar energy, which in 2019 represented 8.7% of the electricity consumed. A record of hourly energy production was reached in the case of Spain, which is discussed below. Across the European continent, March was the month of the greatest increase in solar energy generation in 2019 compared to the same month of 2018. In contrast, the largest year‑on‑year decline in solar energy production in Europe was recorded in May.

Source: Prepared by AleaSoft using data from ENTSO-E, RTE, REN, REE and TERNA.
Source: Prepared by AleaSoft using data from ENTSO-E, RTE, REN, REE and TERNA.
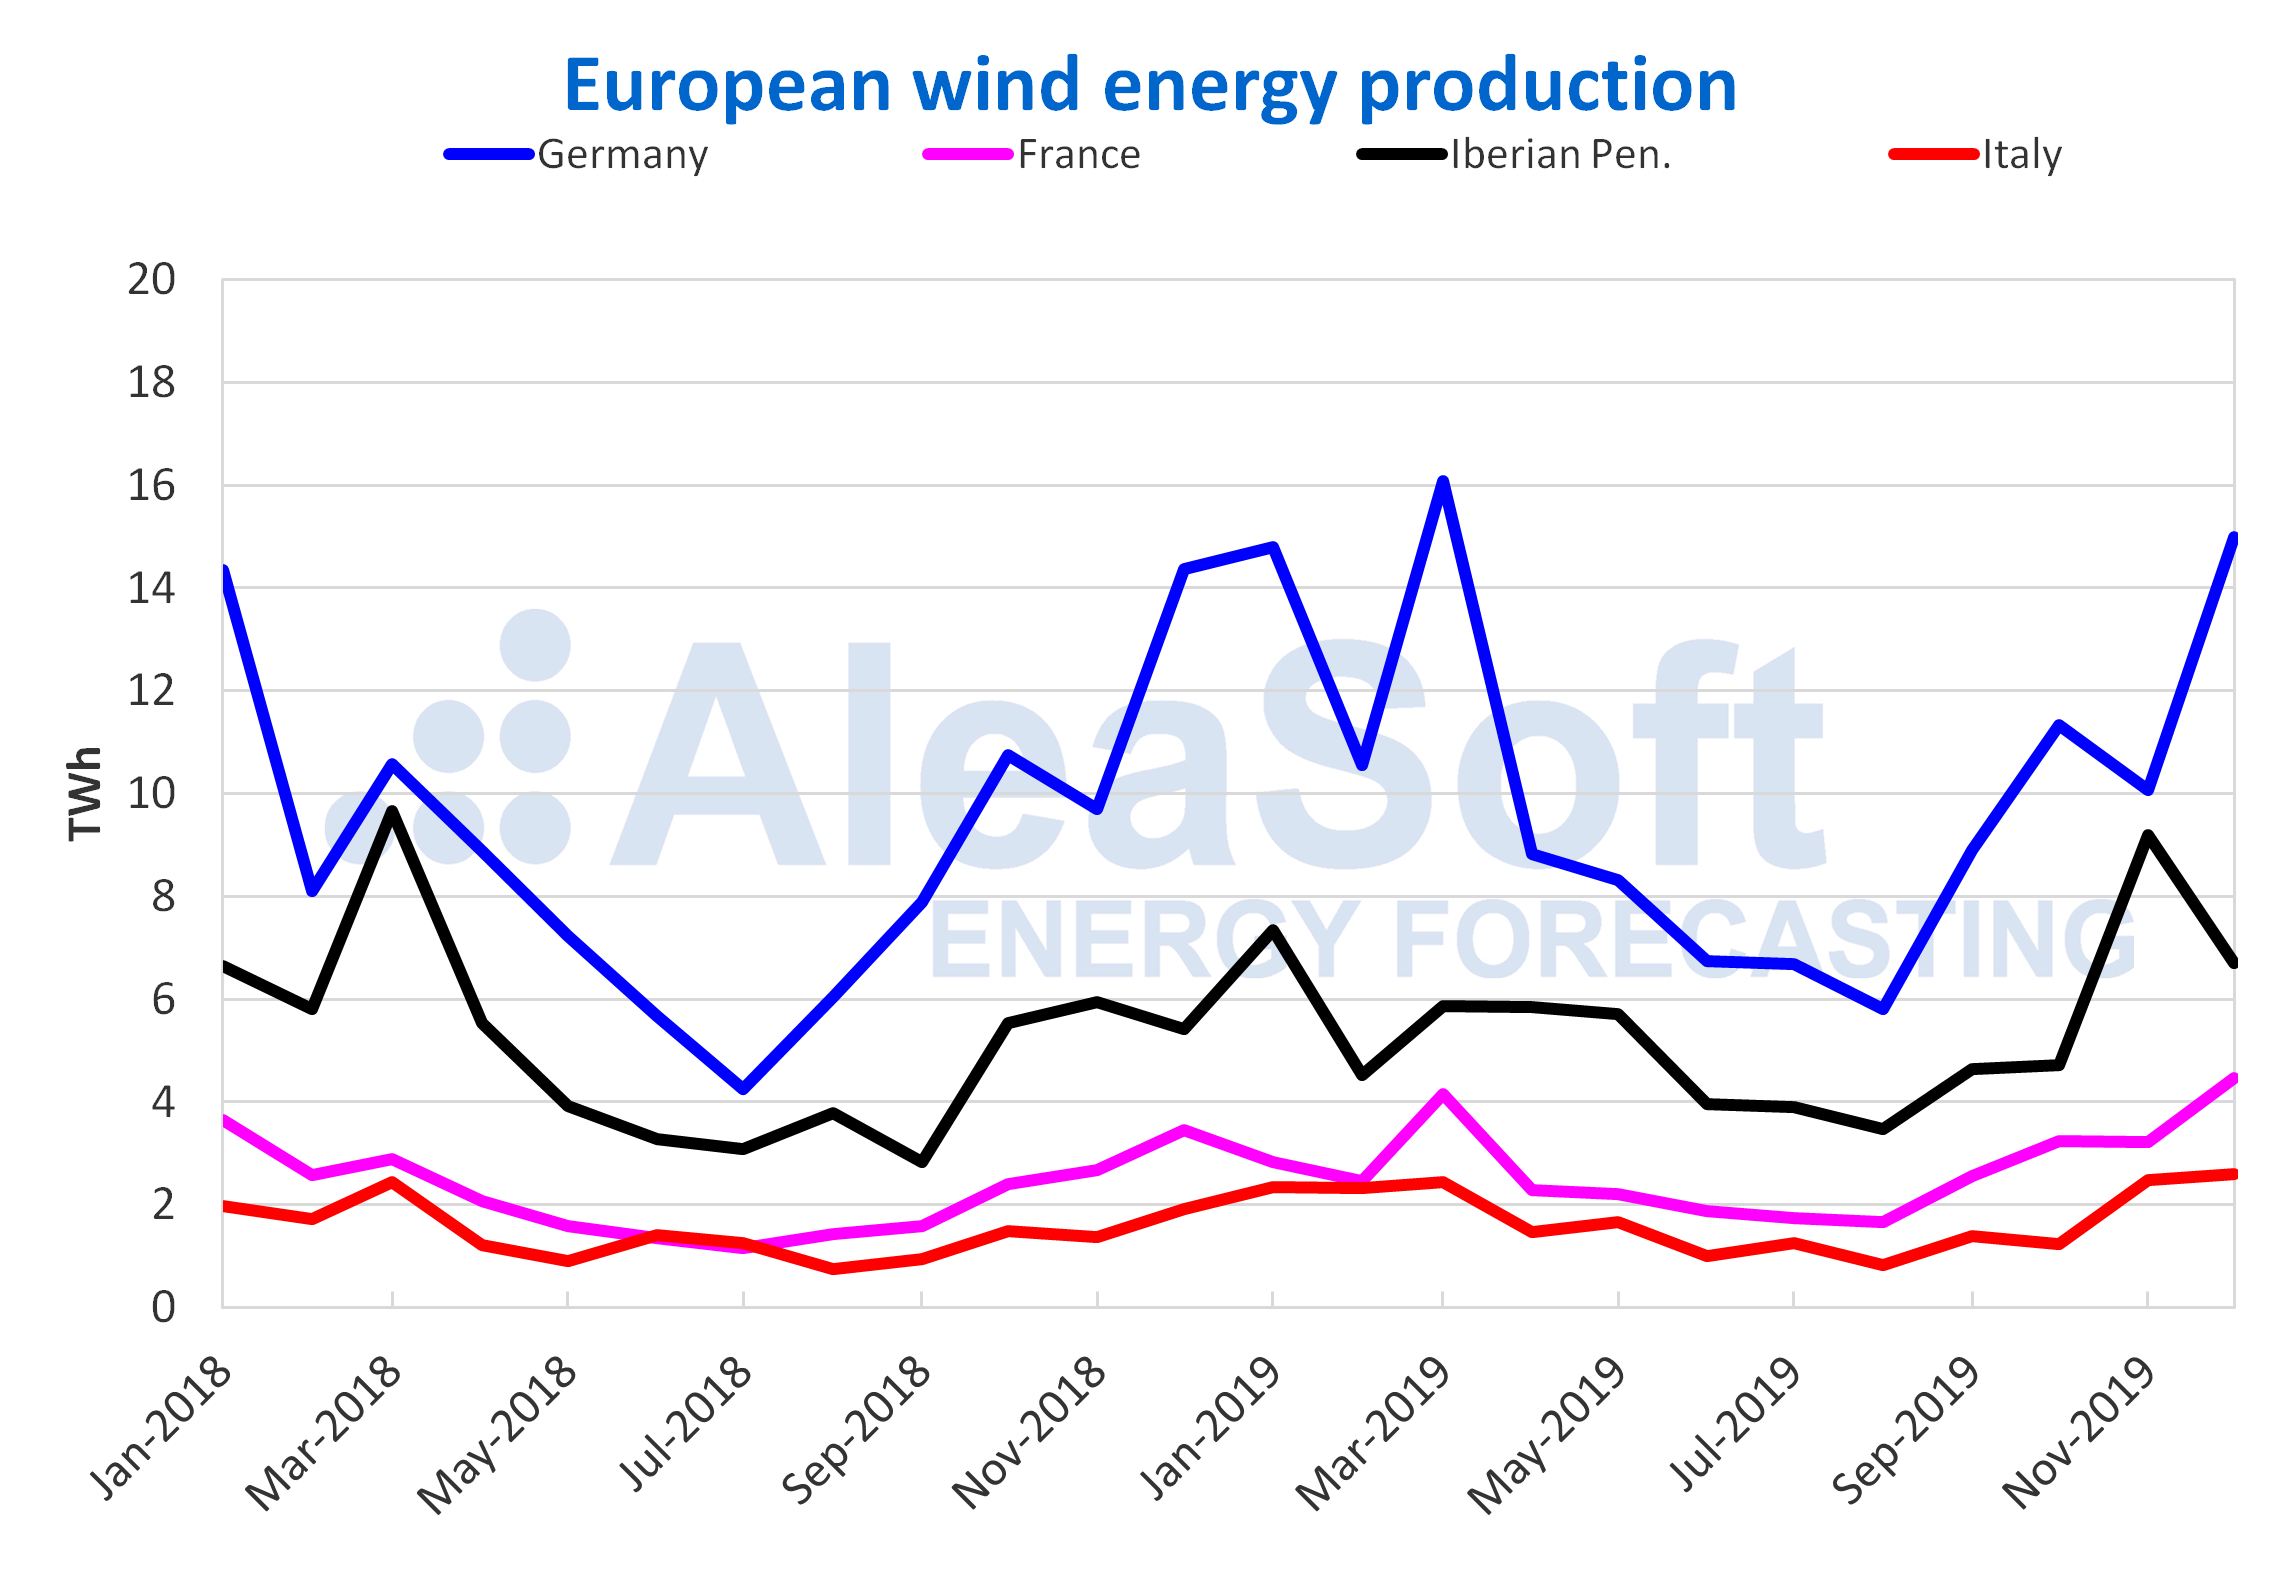
The year 2019 had Germany as its best exponent of the continent in terms of wind energy production, again above 100 TWh per year, reaching 123 TWh, which represented an increase of 14%. The markets of France and Italy were the fastest growing compared to 2018, of 22% and 21% respectively. The generation from this renewable source was higher in 2019 in all European markets compared to the previous year.
The month with the highest increase in wind energy production compared to 2018 was July. However, in September the production of Portugal doubled annually. The only month where the wind energy production in Europe was lower than in 2018 was August.
Source: Prepared by AleaSoft using data from ENTSO-E, RTE, REN, REE and TERNA.
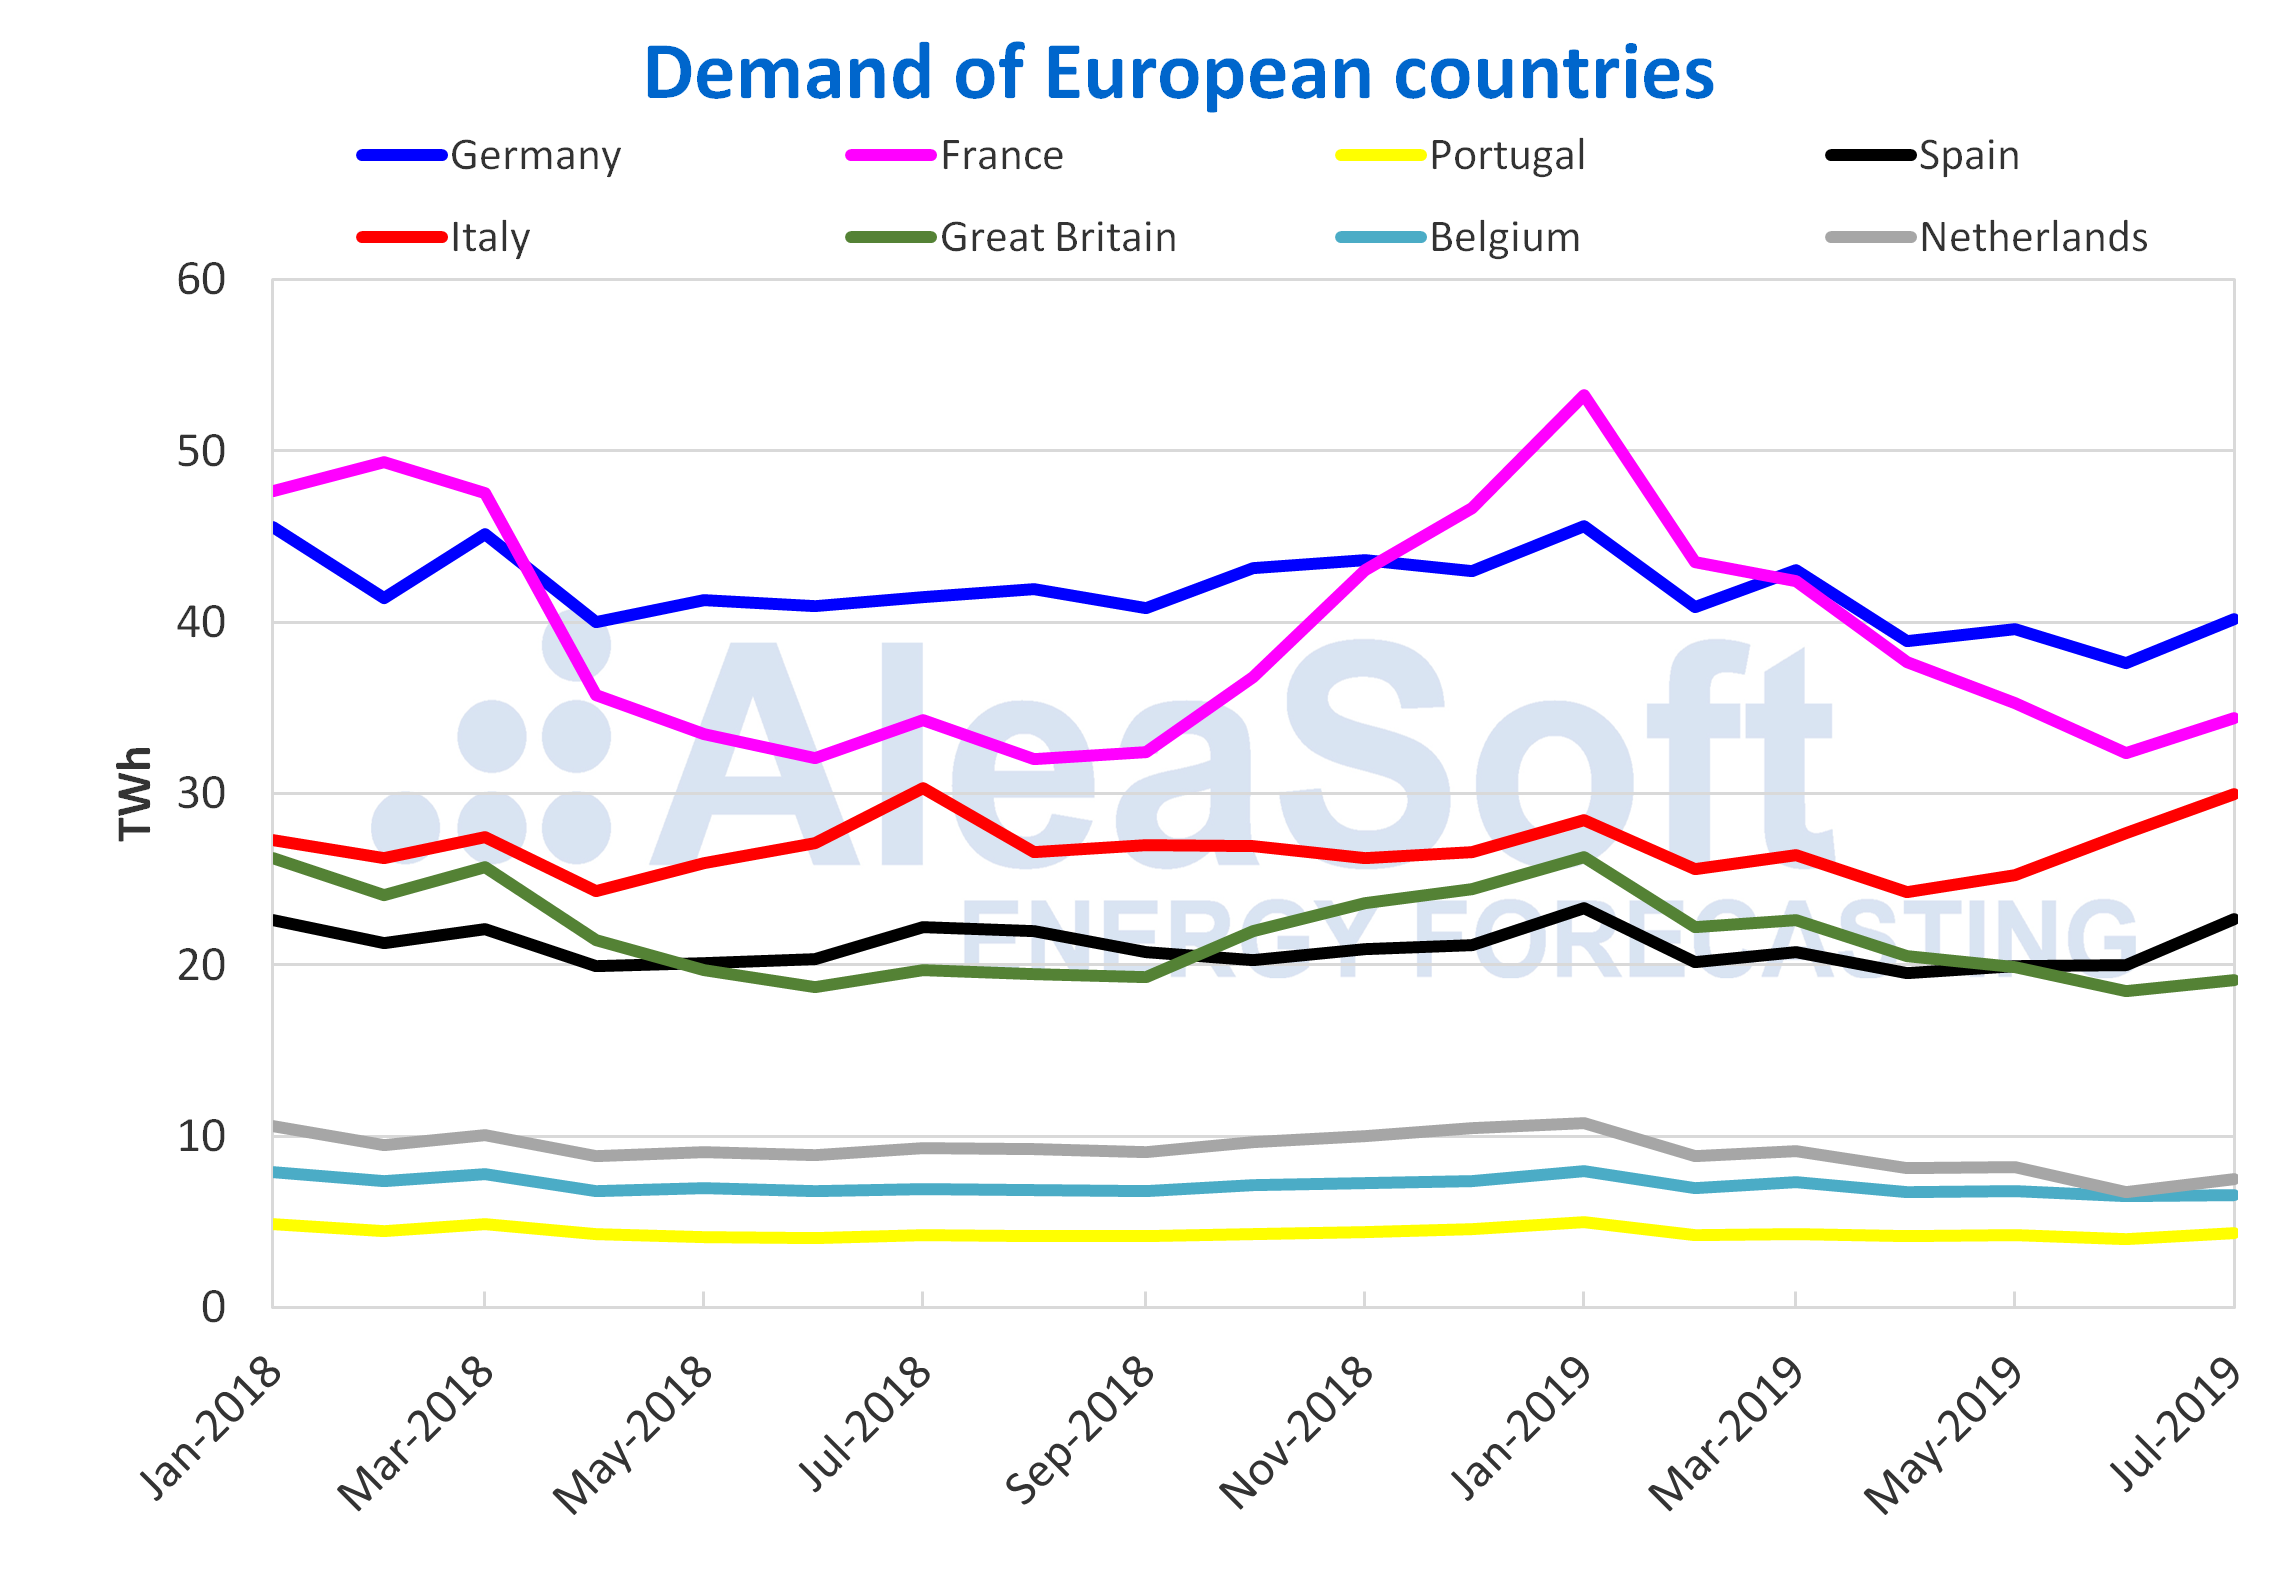
As for the electricity demand of the last year, it was lower than that of 2018 uniformly throughout the European continent. Where it decreased most during 2019 was in the German market, which had a variation of ‑4.6% compared to 2018. The smallest decrease occurred in the Italian market, being 0.5%.
Among the countries that covered most of the demand with these renewable energies was Germany, where the wind and photovoltaic energy binomial occupied 34% of the electricity consumed. That result was followed by Spain and Portugal, where 27% and 28% of these renewable technologies, respectively, were used to meet the demand.
Source: Prepared by AleaSoft using data from ENTSO-E, RTE, REN, REE, TERNA, National Grid and ELIA.
Mainland Spain, photovoltaic and solar thermal energy production and wind energy production
The photovoltaic energy was one of the most important issues of the Spanish electricity sector during 2019 and, as we mentioned earlier, it set a record for hourly energy production of more than 4 GWh in July, and for monthly energy production in August with 964 GWh. This technology, in combination with solar thermal energy, allowed the annual solar energy production of Mainland Spain during 2019 to increase by 19%.
The Spanish wind energy production also registered significant figures during the last year, including a record of peak wind energy production of 17 388 MWh on December 12. In 2019, the monthly wind energy production was higher year‑on‑year in 8 of the 12 months of the year and totalled an annual increase of 7.9%.
The photovoltaic installed capacity closed 2019 with more than 7800 MW, which represented an increase of 66% compared to what was installed at the end of 2018, according to data from Red Eléctrica de España (REE). As for the wind energy, at least 1600 MW were added to the Spanish wind park during 2019, ending the year with more than 25 200 MW of installed capacity.

Sources: Prepared by AleaSoft using data from REE.
On the other hand, the electricity demand decreased by 1.8% last year, which, when correcting the effects of temperature and labour, is equivalent to a fall of 2.8%. A curious fact is that the year‑on‑year difference between the months of 2019 and 2018 was only positive at the beginning of each semester, in the months of January and July.
The nuclear energy was the one that contributed the most to the energy mix of Spain last year, with 22% of the total, followed by the 21% of the wind energy and the 21% of the combined cycle gas turbines. Particularly, the combined cycle gas turbine production was the one that grew the most compared to the previous year, increasing 94%. In the other sense, the coal energy production suffered the greatest decrease, reaching 69% less than in 2018. The hydraulic energy generation decreased this time by 28%, after almost doubling last year.

Sources: Prepared by AleaSoft using data from REE.
European electricity markets
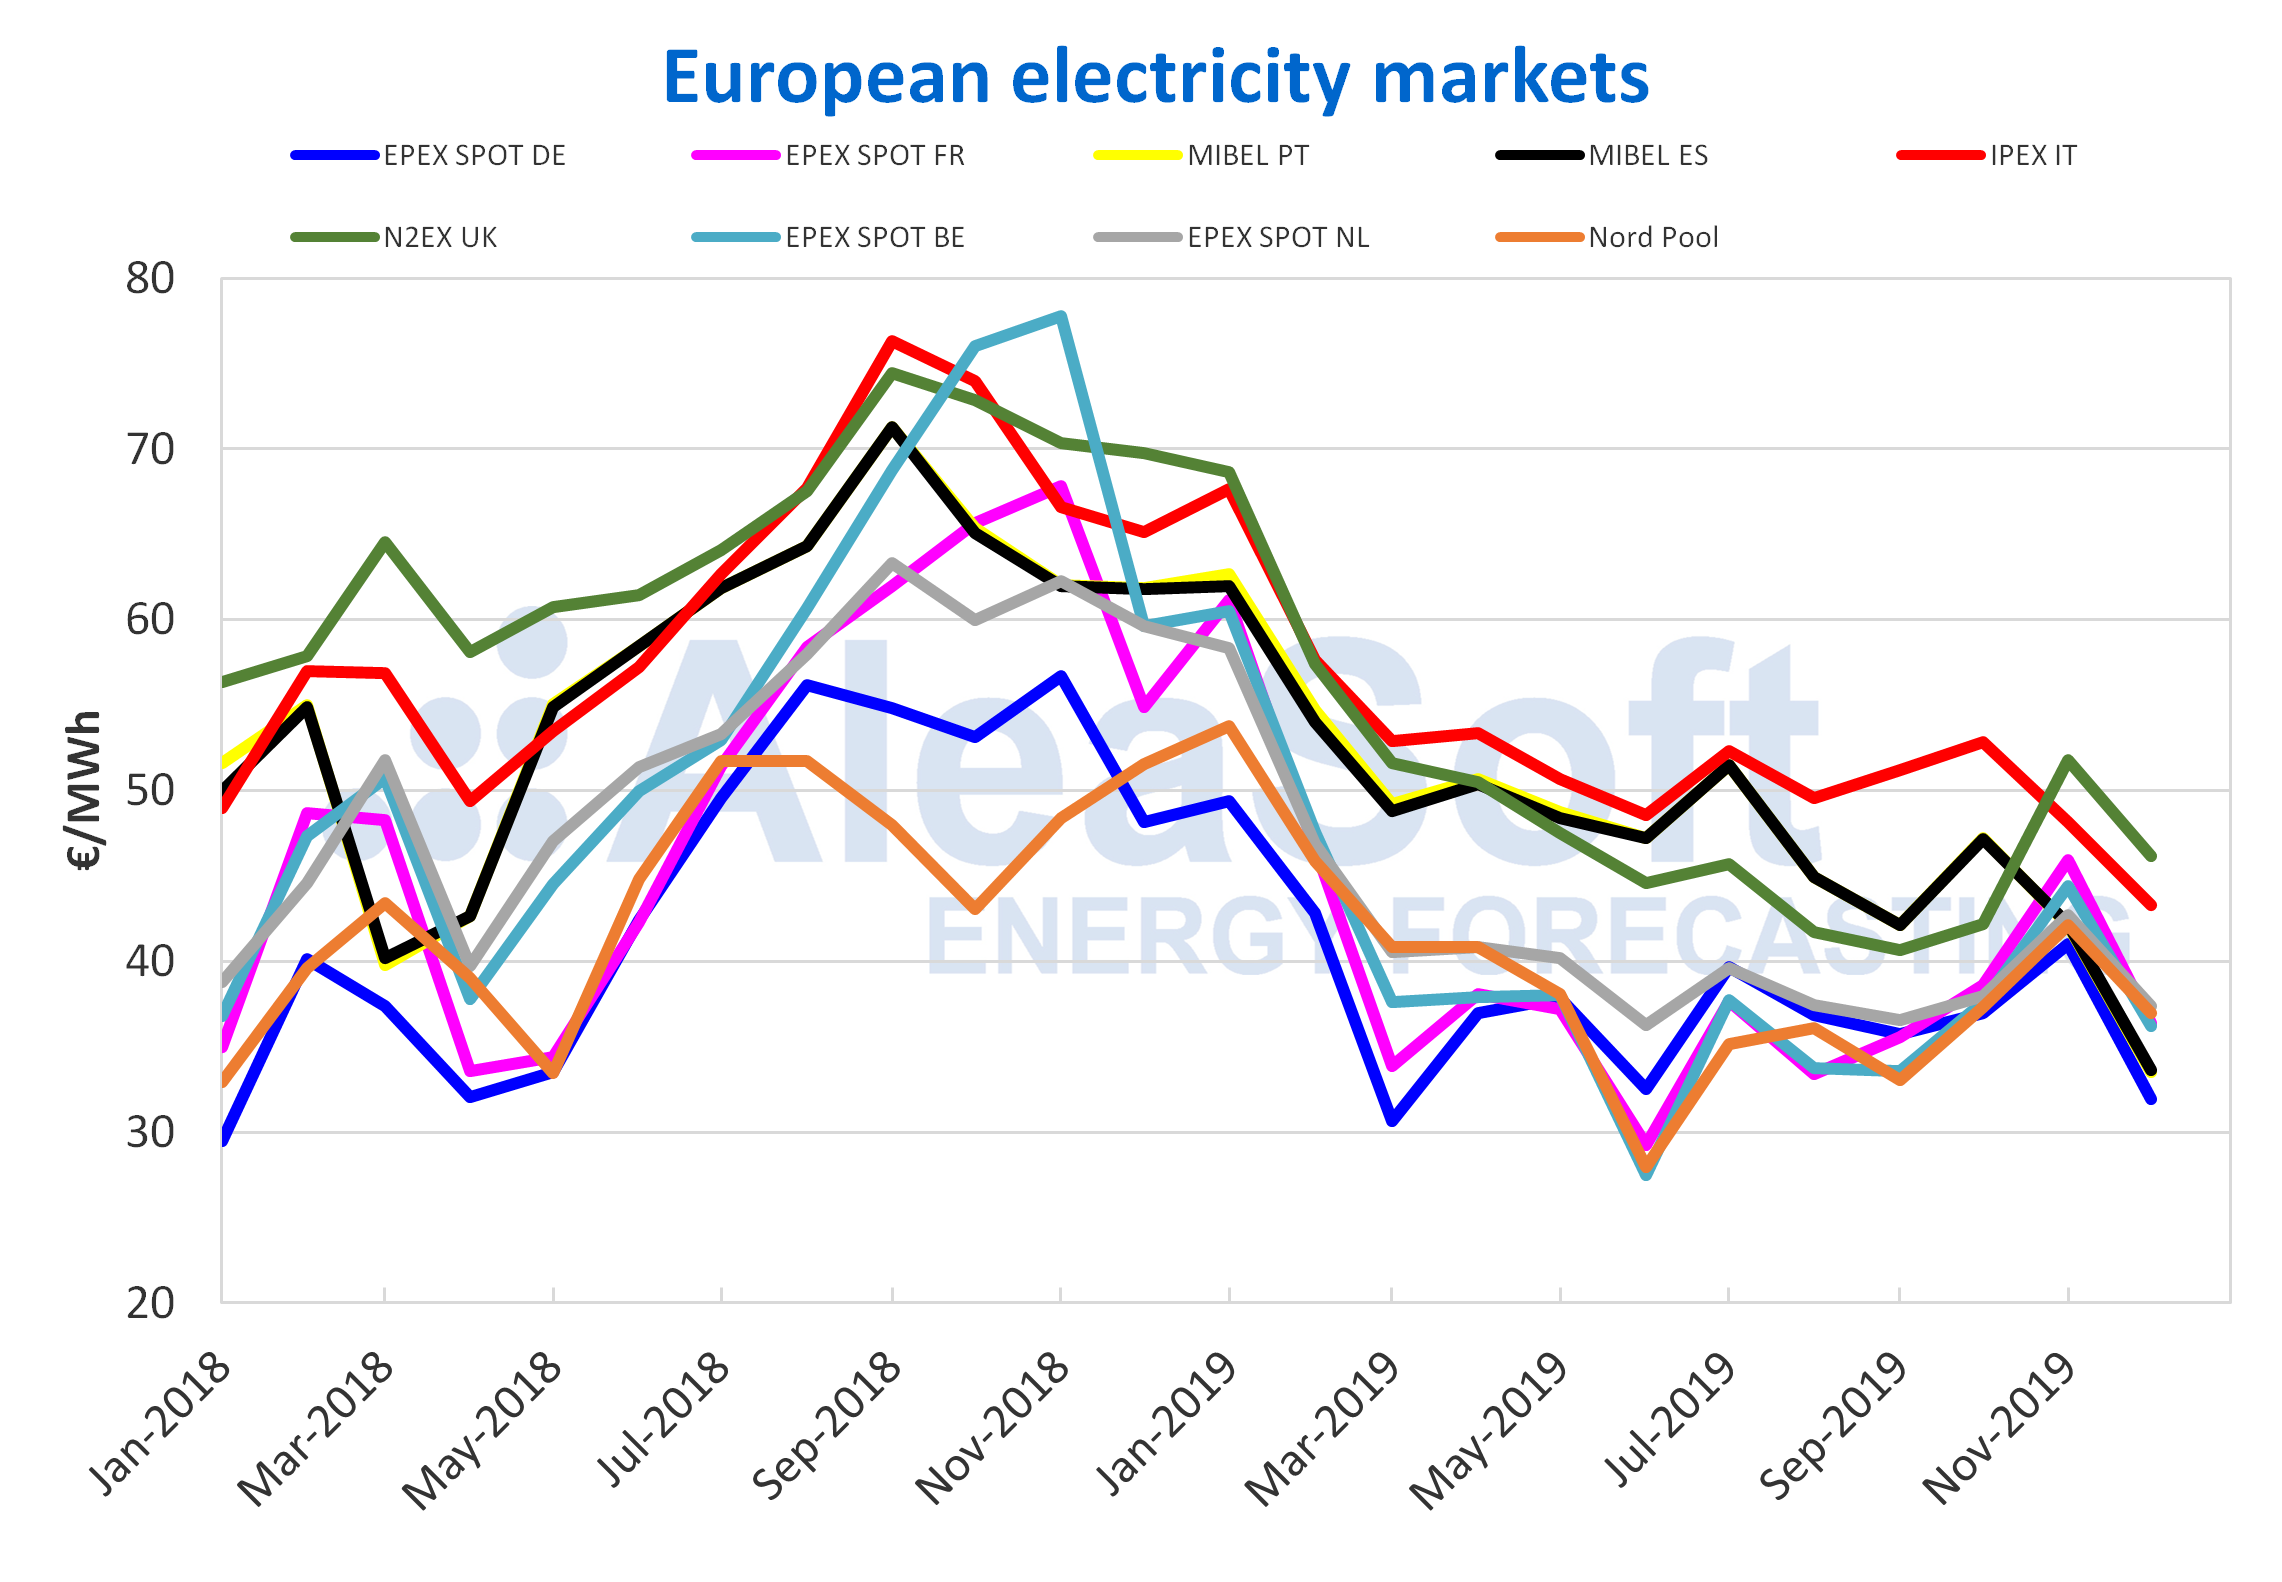
The prices of the main European electricity markets during the year 2019 were markedly lower than those of the previous year. In general, the average price in the markets analysed by AleaSoft was €10/MWh lower in 2019 than in 2018. This price decline was due to the decrease in electricity demand and the increase in renewable energy production. To the causes of the price decrease is added the decrease in gas and coal prices, which was 60% and 40% respectively.
The IPEX market of Italy was the one with the highest price during 2019, with an average of €52.32/MWh, thus removing this position from the N2EX market of Great Britain, which had been the one with the highest price in 2018 with €64.89/MWh of average price. At the end of the ranking the positions also change. The Nord Pool market of the Nordic countries was the one of the lowest price in 2018, with an average price of €43.99/MWh. However, in the recently concluded 2019, the market of Germany achieved the lowest average price, with €38.08/MWh.
On the other hand, the record of the day with the highest daily price is held in 2019 by the N2EX market of Great Britain, reaching €86.44/MWh on January 24. This figure is much lower than the 2018 daily price record, which in that year was recorded by the Belgian market, reaching €184.86/MWh on November 21 of that year. It is interesting that it is precisely this market that now in 2019 has the record of the lowest daily average price, with the ‑€133.56/MWh reached on June 8, 2019. A value that is also extraordinarily lower than the same record of 2018, reached by the market in Germany, with ‑€25.30/MWh on January 1, 2018.
The price volatility of most markets also decreased in 2019. In this regard the exception was the N2EX market of Great Britain, which in 2018 had more stable prices than those registered in 2019.
Source: Prepared by AleaSoft using data from OMIE, , N2EX, IPEX and Nord Pool.
MIBEL market
Regarding the MIBEL market of Spain and Portugal, the prices in 2019 were, as in the rest of European markets, €10/MWh lower on average. The highest price reached in the market for both countries in 2019 was €69.43/MWh, on January 16. This value is €6.50/MWh lower than the maximum price reached in the previous year, when a daily average price of €75.93/MWh was registered on September 19, 2018.
The minimum annual MIBEL market record is also lower in 2019 than in the previous year. In 2018 the lowest price was reached on March 30, when both countries had a daily price of €4.50/MWh. In the case of 2019, the record was reached without coupling between Spain and Portugal, since recently, on December 22, 2019, the minimum was reached at €1.94/MWh and €1.68/MWh respectively.
And precisely, in reference to the coupling between Spain and Portugal, the results of both years are practically the same. In 2018, a coupling of 94.79% was achieved while 94.83% was registered in 2019. This small difference is given because 2019 had just 3 more hours of coupling than 2018.
Electricity futures
The electricity futures of the 2020 calendar year during the second half of the recently concluded year 2019 presented, in most markets, a downward trend. The exceptions were the Nordic countries, both in the ICE market and in the NASDAQ market. The Nordic region is characterised by having the lowest electricity prices in Europe. During the last six months of 2019, the ICE and NASDAQ markets of these countries kept oscillating around €36/MWh. It should also be noted that in this period the ICE market of the Nordic countries together with the NASDAQ market were the markets with the lowest price variation.
On the other hand, the EEX market of Italy registered the highest price of the next year future in Europe during all the second half of 2019. Even though the price fell more than €8/MWh during the semester, it ended 2019 being clearly the highest priced market.
As for price variability, the market with the highest volatility in the YR‑20 product was the EEX market of Great Britain. This market is also the one that registered the greatest difference during the second half of 2019 for this product, with a drop of more than €10/MWh.

Source: Prepared by AleaSoft using data from EEX, OMIP, ICE and NASDAQ
Brent, fuels and CO2
The Brent oil futures prices for the month M+2 in the ICE market during the year 2019 rose from the minimum annual value of $54.91/bbl, registered on January 2, to reach its maximum value of $74.57/bbl on April 24. Then there were declines and on August 7 the lowest price since the beginning of the year was registered, of $56.23/bbl. But in the last quarter they recovered the upward trend and ended the year with a settlement price of $68.44/bbl, corresponding to December 30, 2019, higher than the annual average value of $64.16/bbl.
The evolution of the Brent oil futures prices in 2019 was influenced by the concerns about the pace of global economic growth related to the trade dispute between China and the United States, the tensions in the Middle East, the production cuts agreed by the OPEC+ and the levels of US crude oil reserves. The instability in Venezuela and the US sanctions against Iran and Venezuela also exerted their influence in the first half of the year. Meanwhile the supply interruptions due to the Hurricane Barry did so in July. On the other hand, on Monday, September 16, the most pronounced increase with respect to the price of the previous session, of 15%, was registered after the attacks on the oil facilities of Saudi Arabia.
The TTF gas futures prices in the ICE market for the month M+1, decreased throughout the year 2019 and their average value was €14.61/MWh. The maximum settlement price, of €22.99/MWh, was reached on January 17, 2019, while the minimum settlement price of 2019, of €9.38/MWh, is that corresponded to June 27. In the first semester there was a clear downward trend, but, despite the general downward trend, there was a rise of more than €3/MWh in early April. In the second semester, the behaviour experienced more pronounced oscillations, reaching the maximum value of the semester of €16.79/MWh on November 5. The last days of the year, the behaviour was descending, reaching €12.29/MWh on December 30.
The evolution of the prices was influenced by the news about problems at the French nuclear power plants in the second half of the year. Also the reduction in gas production in the Netherlands as of October 1, the high levels of gas reserves in the last months of the year, the fluctuations in gas supply from Norway and the wind energy production levels exerted their influence on prices during the second half of 2019.
With regard to the API 2 coal futures prices in the ICE market for the month M+1, they decreased throughout the year 2019. They began the year 2019 with values above $80/t and, on January 17, 2019, the annual maximum settlement price of $85.70/t was registered. On the other hand, at the end of the year, on December 31, the settlement price was $53.30/t. The price fell more rapidly in the first half of the year, reaching the annual minimum settlement price of $49.30/t on June 27, 2019. Subsequently, the prices recovered somewhat in July and September, reaching the maximum value of the second semester of $61.75/t on September 16. However, this value was lower than the annual average price of $61.86/t and the year ended with decreases.
During 2019, the CO2 emission rights futures prices in the EEX market for the December 2020 reference contract reached values between €19.22/t on February 21, 2019, and €30.19/t on July 23, 2019. In general, the lowest values were registered during the first quarter of the year and the highest during the third quarter. The average settlement price was €25.22/t in 2019 and the year ended with a settlement price of €25.08/t corresponding to December 30, just €0.14/t below the annual average value. In 2019, the CO2 emission rights futures prices were mainly influenced by the negotiations around Brexit. The weather conditions that led to higher electricity demand, combined with the problems in the French nuclear power plants in the second half of the year, also led to price increases.
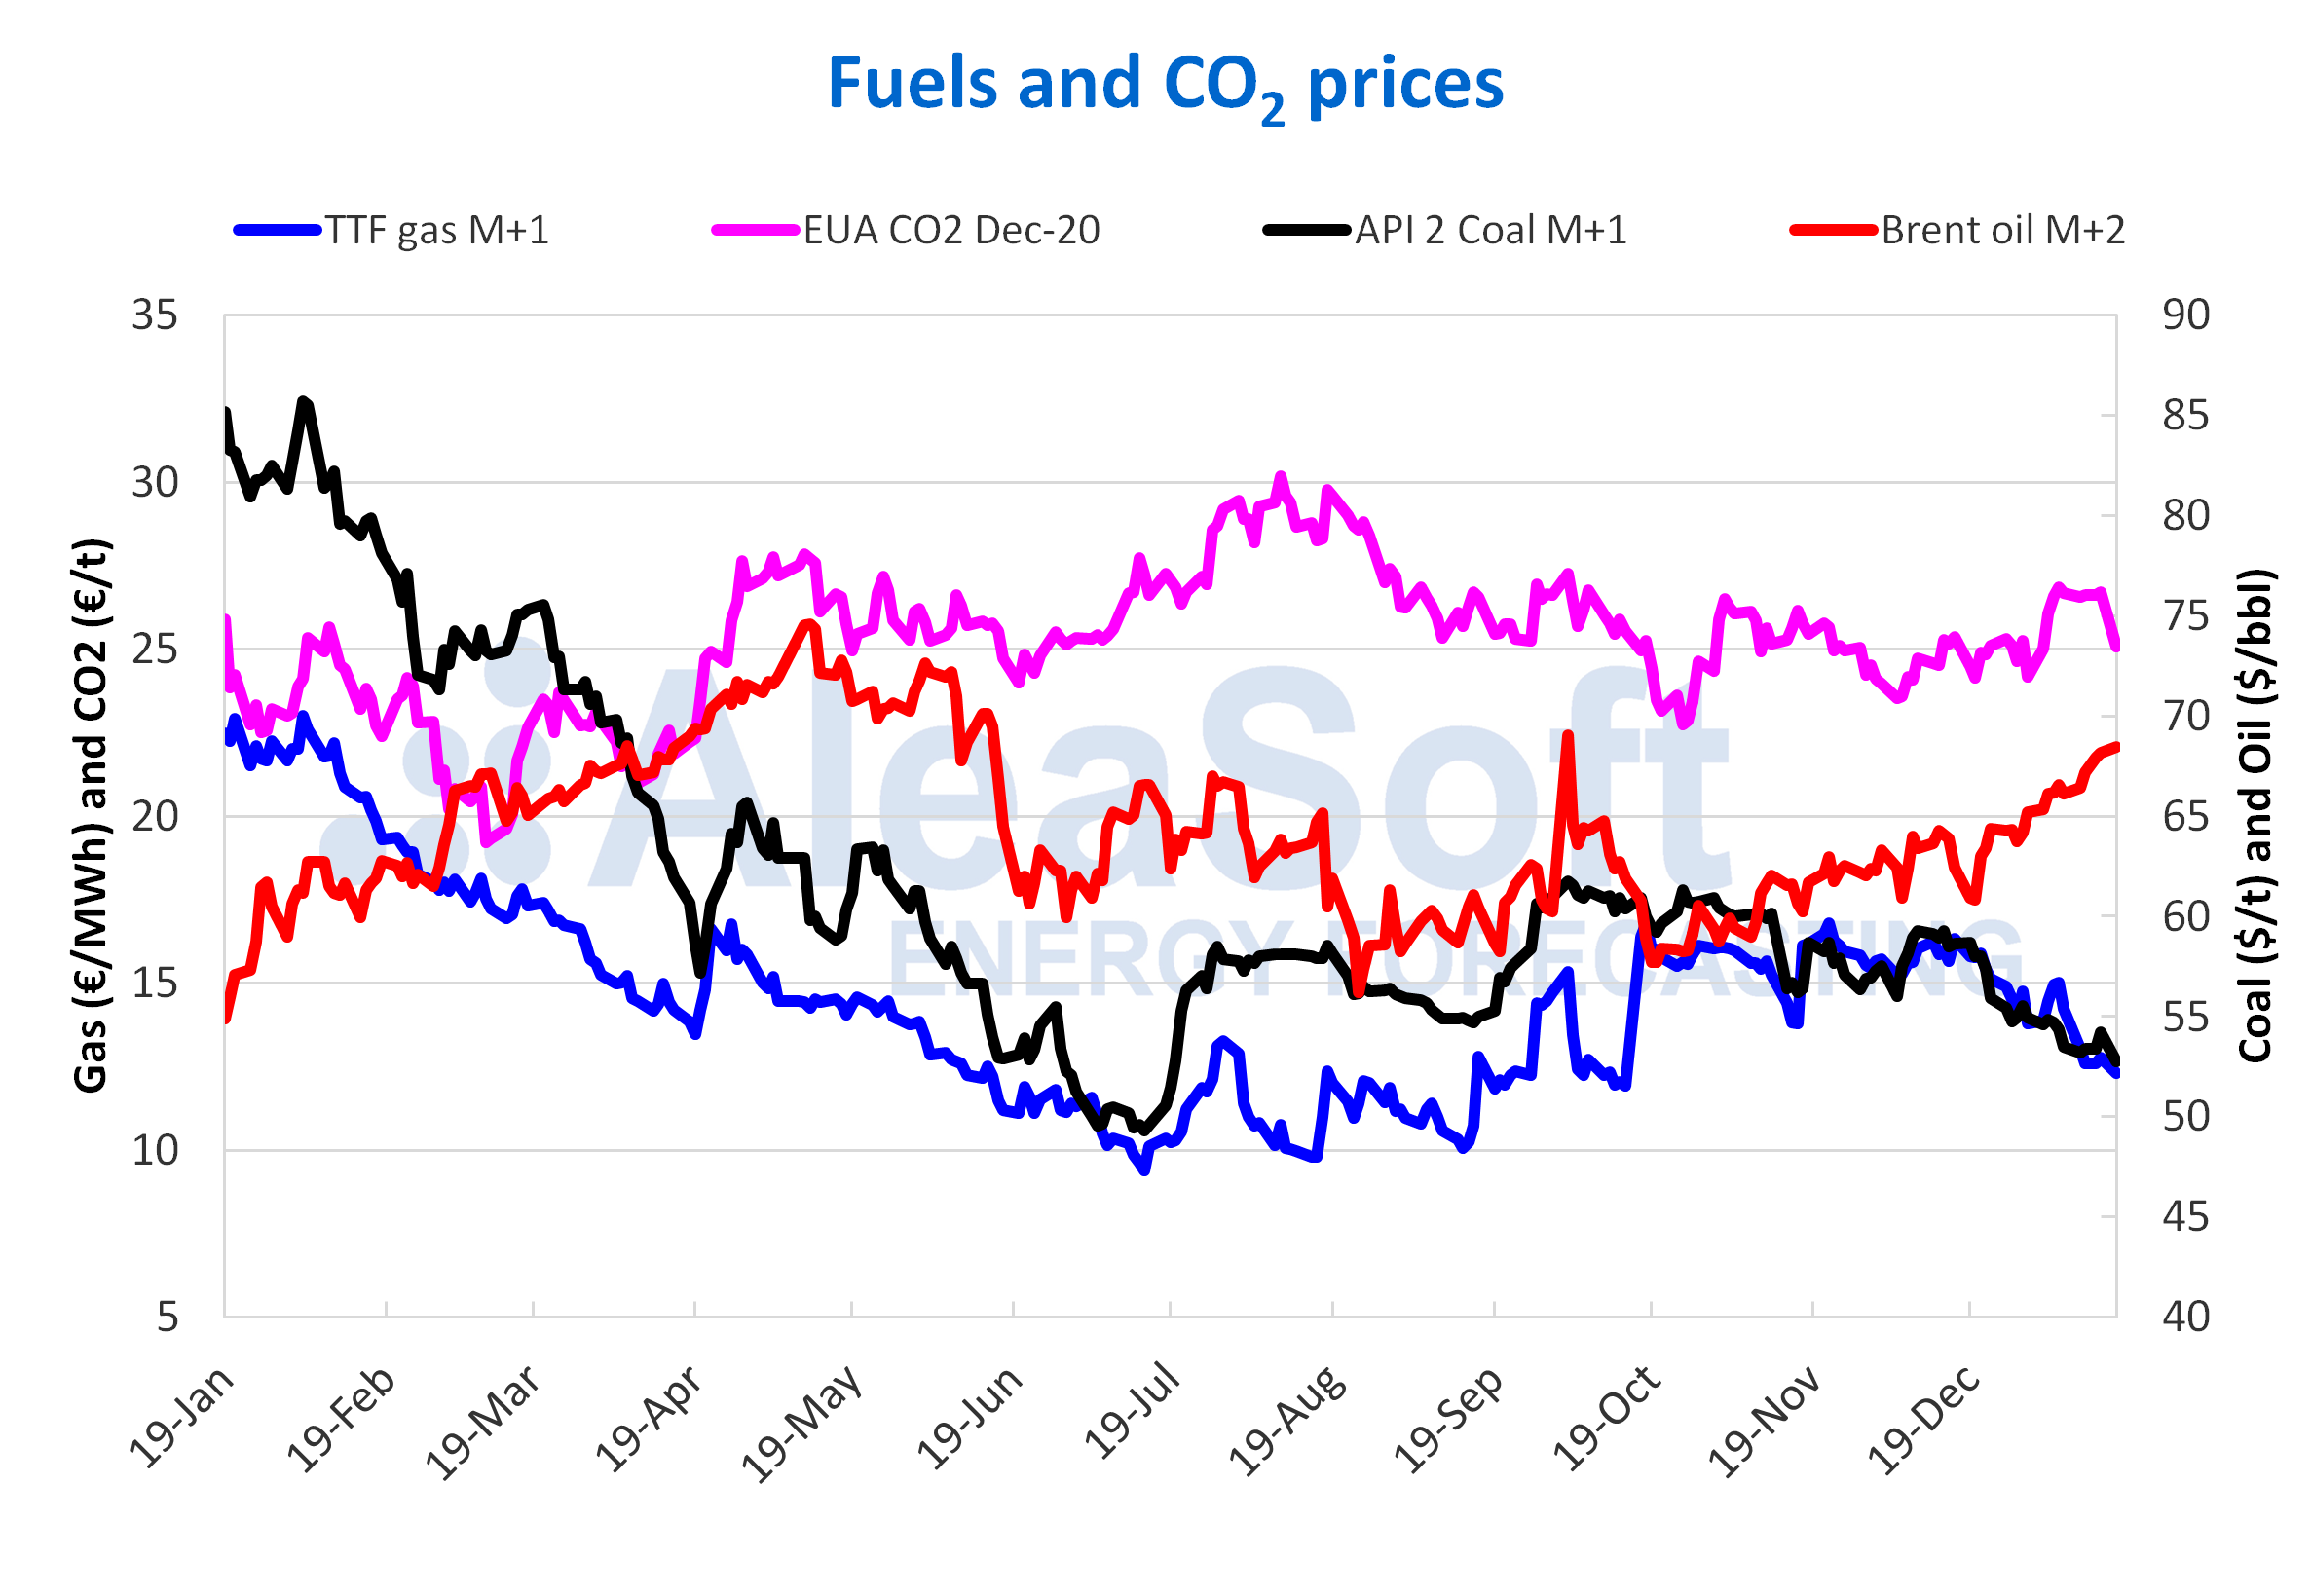
Source: Prepared by AleaSoft using data from ICE and EEX.
Source: AleaSoft Energy Forecasting.