


AleaSoft Energy Forecasting, August 4, 2026. In July 2026, monthly prices rose in most of the main European electricity markets. The rise in gas prices and CO2 emission rights prices, the increase in demand and lower wind energy production in several markets drove this trend. Solar photovoltaic energy production reached record highs in Germany, Spain, France, Italy and Portugal. Demand also marked record highs in some markets and reached its highest levels in years in others.
Solar photovoltaic and wind energy production
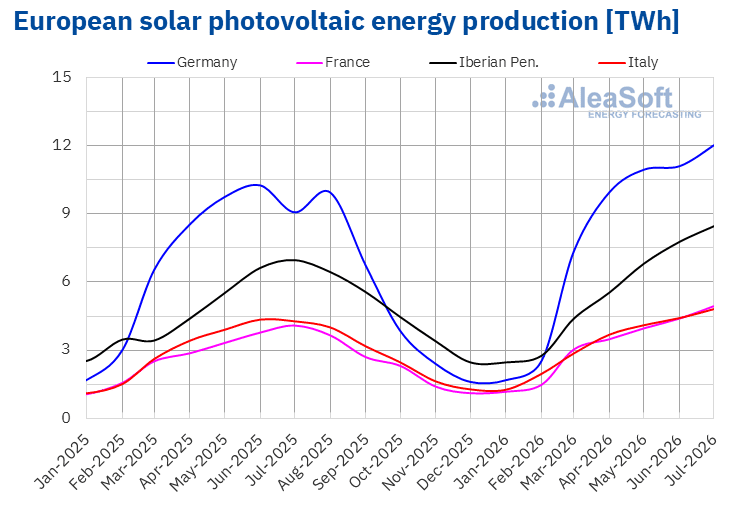
In July 2026, photovoltaic production increased in the main European electricity markets compared with the same month of the previous year. Production registered the largest percentage growth in Germany, with 33%, and the smallest in Portugal, with 12%. In Spain, France and Italy, production grew by 22%, 21% and 13%, respectively.
Compared with June 2026, photovoltaic production also increased in the main European electricity markets analysed. France registered the largest increase, with 8.8%, while Spain posted the smallest rise, with 4.5%. In Germany, production grew by 4.9%, while in Portugal and Italy it increased by 5.4% in both cases.
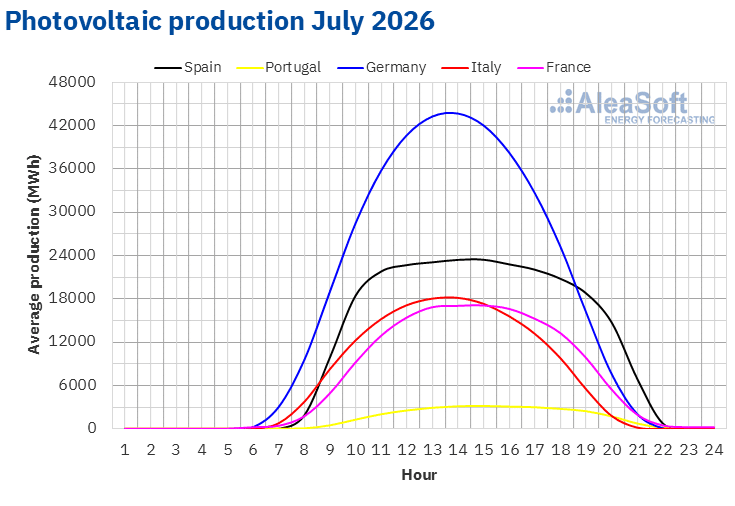
In July 2026, monthly photovoltaic production reached record highs in all the European electricity markets analysed. Generation stood at 12 044 GWh in Germany, 7575 GWh in Spain, 4931 GWh in France, 4823 GWh in Italy and 895 GWh in Portugal.
The year-on-year growth in installed capacity favoured these photovoltaic production record highs. Between July 2025 and July 2026, installed photovoltaic capacity in Spain increased by approximately 7765 MW, not including self-consumption, according to data from Red Eléctrica. During the same period, installed photovoltaic capacity in Portugal increased by approximately 672 MW, according to data from REN.
 Source: Prepared by AleaSoft Energy Forecasting with data from ENTSO-E, RTE, REN, Red Eléctrica and TERNA.
 Source: Prepared by AleaSoft Energy Forecasting with data from ENTSO-E, RTE, REN, Red Eléctrica and TERNA.
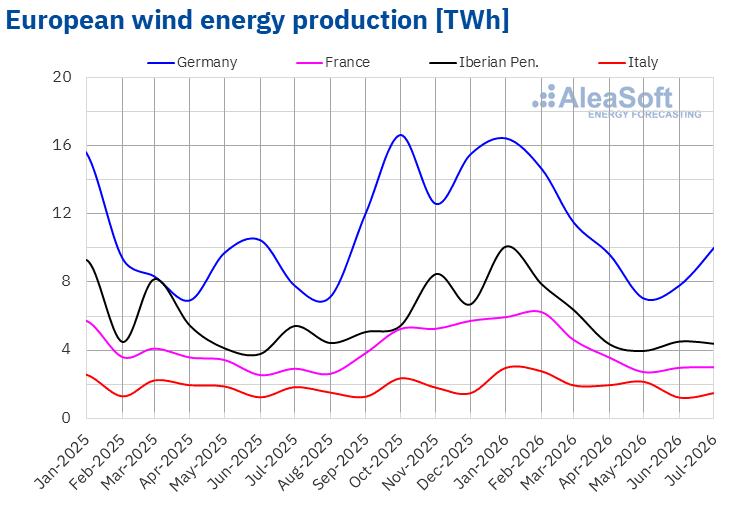
In July 2026, the wind energy production increased year-on-year in Germany and France. Germany registered the largest growth, with 29%, while France had an increase of 3.0%. In contrast, the Portuguese, Italian and Spanish markets registered decreases in wind power generation. Portugal presented the largest drop, of 36%, while in Italy and Spain it decreased by 19% and 16%, respectively.
Compared with June 2026, wind energy production increased in the German and Italian markets, by 24% and 19%, respectively. In contrast, wind generation decreased in Portugal, Spain and France. Portugal registered the largest drop, of 29%, followed by decreases of 3.2% in Spain and 2.1% in France.
In Germany, France and Italy, wind energy production reached the second highest value for a month of July in their respective historical series, with 10 018 GWh, 3004 GWh and 1473 GWh, respectively. In Portugal, wind generation reached its lowest value for a month of July since 2018, with 641 GWh.
According to data from Red Eléctrica, between July 2025 and July 2026, installed wind capacity in mainland Spain increased by approximately 581 MW, not including self-consumption. During the same period, installed wind capacity in Portugal increased by 323 MW, according to data from REN.
 Source: Prepared by AleaSoft Energy Forecasting with data from ENTSO-E, RTE, REN, Red Eléctrica and TERNA.
Electricity demand
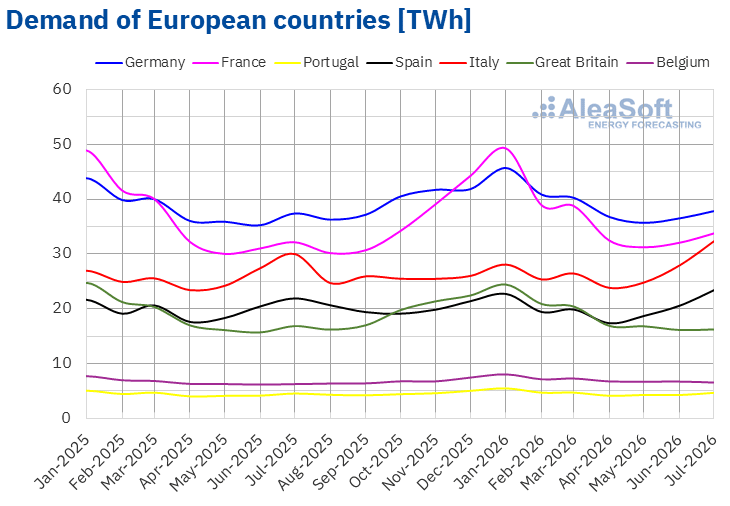
In July 2026, electricity demand increased year-on-year in most of the main European markets. Italy registered the largest increase, of 7.9%, while Germany posted the smallest rise, of 1.2%. In Portugal, Belgium, France and Spain, demand increased between 3.0% in Portugal and 6.8% in Spain. The British market was the exception, with a decrease of 3.6%.
Compared with June 2026, demand increased in most of the main European markets analysed. Italy also registered the largest increase, of 12%, followed by Spain, with a rise of 8.9%. Portugal and France registered increases of 5.6% and 1.9%, respectively, while Germany posted the smallest rise, of 0.3%. In contrast, demand fell in Belgium and Great Britain by 5.7% and 2.6%, respectively.
In July 2026, monthly electricity demand reached record highs of recent years in several markets analysed. Spain registered 23 458 GWh, the highest value since February 2011 and the historical high for a month of July. Italy reached 32 430 GWh, its highest value in the last 26 years. Portugal marked a historical high for a month of July, with 4616 GWh. Germany, for its part, registered 37 845 GWh, its highest value for a month of July in the last four years. France and Belgium reached 33 812 GWh and 6536 GWh, respectively, their highest values for a month of July in the last seven years.
The average temperatures were higher than those of July 2025 in all the European markets analysed. France registered the largest increase, of 2.5°C, while Belgium presented the smallest increase, of 0.5°C. In the rest of the markets, average temperatures increased by between 1.1°C in Portugal and Germany and 1.6°C in Italy.
Compared with the previous month, July average temperatures also increased in all the markets analysed. Spain and Italy registered the largest rise, of 2.4°C in both cases, while Germany posted the smallest increase, of 0.2°C. In the rest of the markets, average temperatures increased by between 1.2°C in Belgium and 2.3°C in Portugal.
 Source: Prepared by AleaSoft Energy Forecasting with data from ENTSO-E, RTE, REN, Red Eléctrica, TERNA, National Grid and ELIA.
European electricity markets
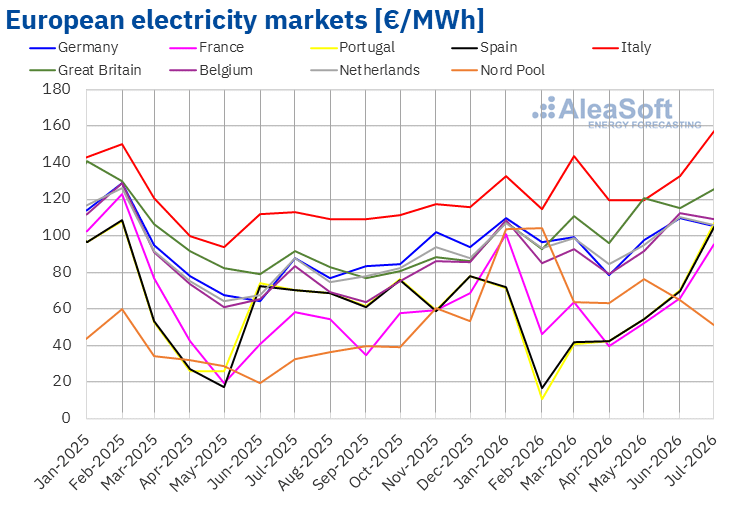
In July 2026, the average monthly price exceeded €95/MWh in most of the main European electricity markets. The exception was the Nordic market, which presented the lowest price, of €51.26/MWh. In contrast, the Italian and British markets registered the highest prices, with averages of €157.04/MWh and €125.44/MWh, respectively. In the rest of the European electricity markets analysed by AleaSoft Energy Forecasting, the averages ranged between €95.23/MWh in the French market and €109.25/MWh in the Belgian market.
Compared with June, average prices rose in most of the European electricity markets analysed by AleaSoft Energy Forecasting. The Portuguese market registered the largest percentage price increase, of 52%. In the rest of the markets with increases, prices rose between 9.1% in the British market and 51% in the Spanish market. In contrast, prices fell in the Nordic, Dutch, German and Belgian markets, with decreases of 21%, 3.8%, 3.7% and 2.6%, respectively.
Comparing average July prices with those registered in the same month of 2025, prices rose in all European electricity markets. The French and Nordic markets reached the largest percentage price increases, of 64% and 59%, respectively. In the rest of the markets, price increases ranged between 20% in the German market and 53% in the Portuguese market.
As a result of the price increases, in July 2026 the Italian market reached its highest average since March 2023. The British, Spanish and Portuguese markets registered their highest monthly prices since March 2025. The French market average, meanwhile, was the highest since February 2026. In contrast, the Nordic market registered its lowest average since November 2025.
The rise in gas prices and CO2 emission rights prices compared with June drove the price increase in most European electricity markets. The rise in demand in many markets, together with the drop in wind production in Spain, France and Portugal, reinforced this upward trend, while the increase in wind generation in Germany and Italy helped to moderate or reverse the price rise in those markets.
Compared with the same month of 2025, the rise in gas prices and CO2 emission rights prices, together with the increase in electricity demand in most markets, drove the year-on-year price increases in Europe. Lower wind production in Spain, Portugal and Italy also contributed to this upward trend.
 Source: Prepared by AleaSoft Energy Forecasting with data from OMIE, RTE, Nord Pool and GME.
Brent, fuels and CO2
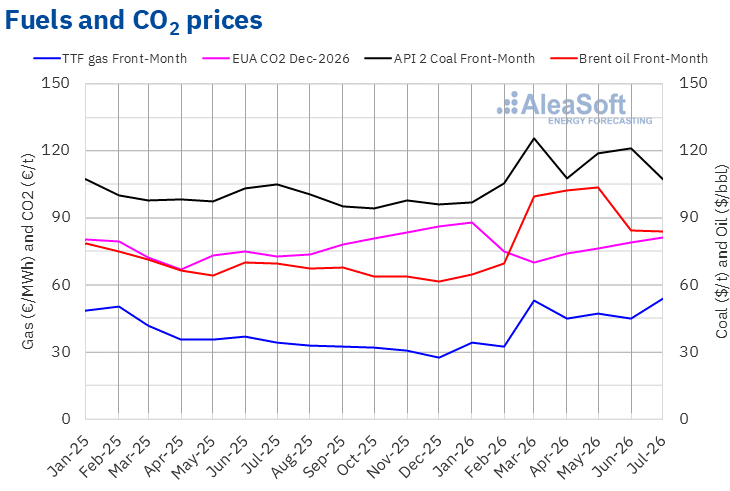
The Brent oil futures for the Front-Month on the ICE market registered an average price of $83.97/bbl in July 2026. This value was 0.5% lower than in June 2026, when it stood at $84.43/bbl, although it exceeded the July 2025 price by 21%, which reached $69.42/bbl.
During July, progress in negotiations between the United States and Iran reduced fears of new supply disruptions through the Strait of Hormuz, which put downward pressure on Brent oil futures prices. The OPEC+ announcement to increase production from August also contributed to this decrease compared with the previous month.
Regarding the TTF gas futures on the ICE market for the Front-Month, the average price registered in July 2026 was €53.99/MWh. This figure was 20% higher than in June 2026, when the average stood at €44.94/MWh. Compared with July 2025, when the average price was €34.03/MWh, the increase reached 59%. In addition, according to the data analysed by AleaSoft Energy Forecasting, the July 2026 average was the highest since February 2023.
During July, the attack on the Qatari LNG tanker Al-Rekayyat on 7 July interrupted the expected increase in liquefied natural gas exports from Qatar. This disruption, together with European gas reserve levels around 23 percentage points below the five-year seasonal average, drove up TTF gas futures prices.
Regarding the CO2 emission rights futures on the EEX market for the December 2026 reference contract, the average price reached €81.26/t in July. This value was 2.8% higher than that registered in June 2026, of €79.06/t, and exceeded the July 2025 average by 12%, of €72.88/t.
 Source: Prepared by AleaSoft Energy Forecasting with data from ICE and EEX.
AleaSoft Energy Forecasting analysis for energy storage
To achieve a profitable and bankable investment, energy storage projects need to identify the configuration that maximises revenue, anticipate the evolution of arbitrage and balancing services participation opportunities, assess the impact that growing penetration of batteries will have on that revenue and define the optimal sizing in hybrid projects. These issues are especially relevant both in stand-alone systems and in hybrid installations, such as photovoltaic solar or wind power plants with batteries.
To address these challenges, the AleaStorage division of AleaSoft Energy Forecasting produces forecasting reports for energy storage projects, which help optimise revenue, sizing and profitability of storage systems.
Source: AleaSoft Energy Forecasting.