AleaSoft, July 1, 2020. The balance of the first semester in the European electricity markets shows falls in prices and demand due to the measures taken to control the COVID‑19 pandemic. The six‑monthly average price is the lowest in the history since 2011 and in most of the markets it was below €30/MWh. The Brent oil, gas and CO2 markets were also affected and registered falls. On the other hand, the solar energy production increased in all markets in this period.
Photovoltaic and solar thermal energy production and wind energy production
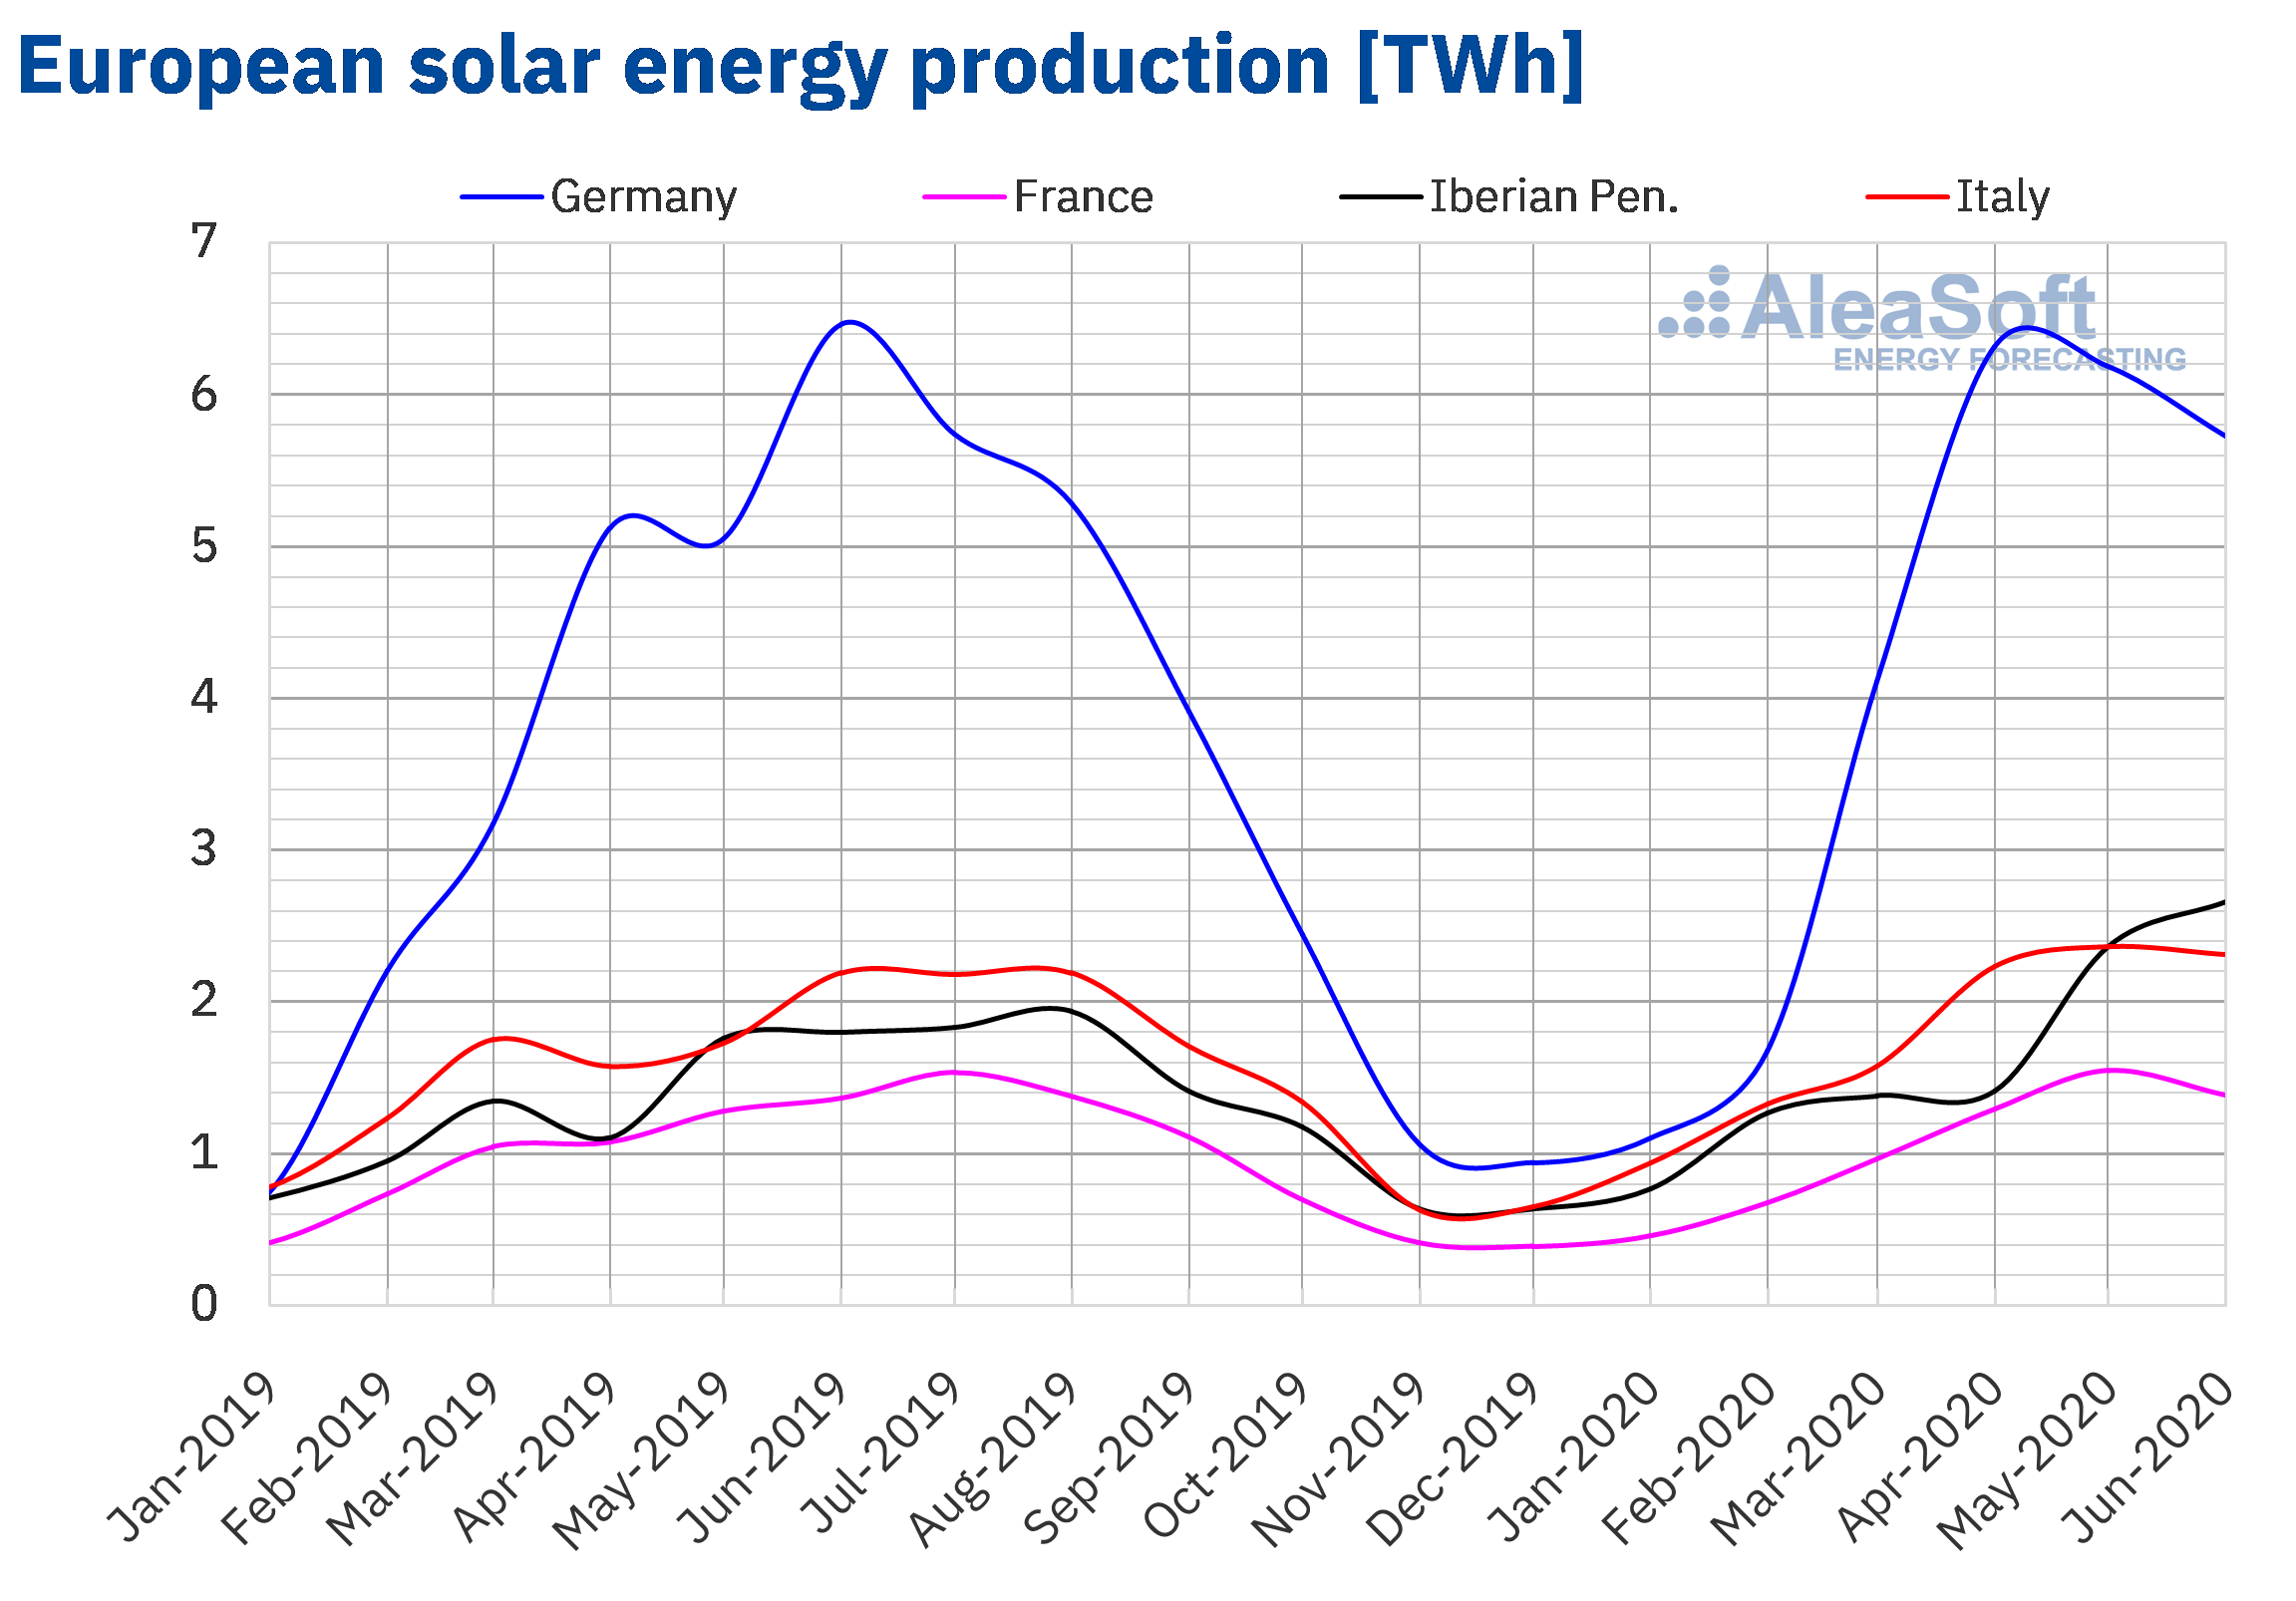
The solar energy production during the first half of 2020 increased in all the European markets analysed at AleaSoft compared to the second half of 2019. The greatest increase was 34% and was registered in the Spanish market. In the German market the increase was 30% and a historical record was registered in the production on the first day of June. In the Italian at the end of the semester, the production increased by 22%. The smallest variations in solar energy production during the analysed semester compared to the previous semester were registered in France and Portugal and were 15% and 14% respectively.
In the comparison of the solar energy production between the first half of 2020 and the first half of 2019, the increase in solar energy production in Spain also stands out, which in this case was 27%. In the rest of the markets analysed at AleaSoft, the solar energy production also increased year‑on‑year between 7.3% and 15%.
 Source: Prepared by AleaSoft using data from ENTSO-E, RTE, REN, REE and TERNA.
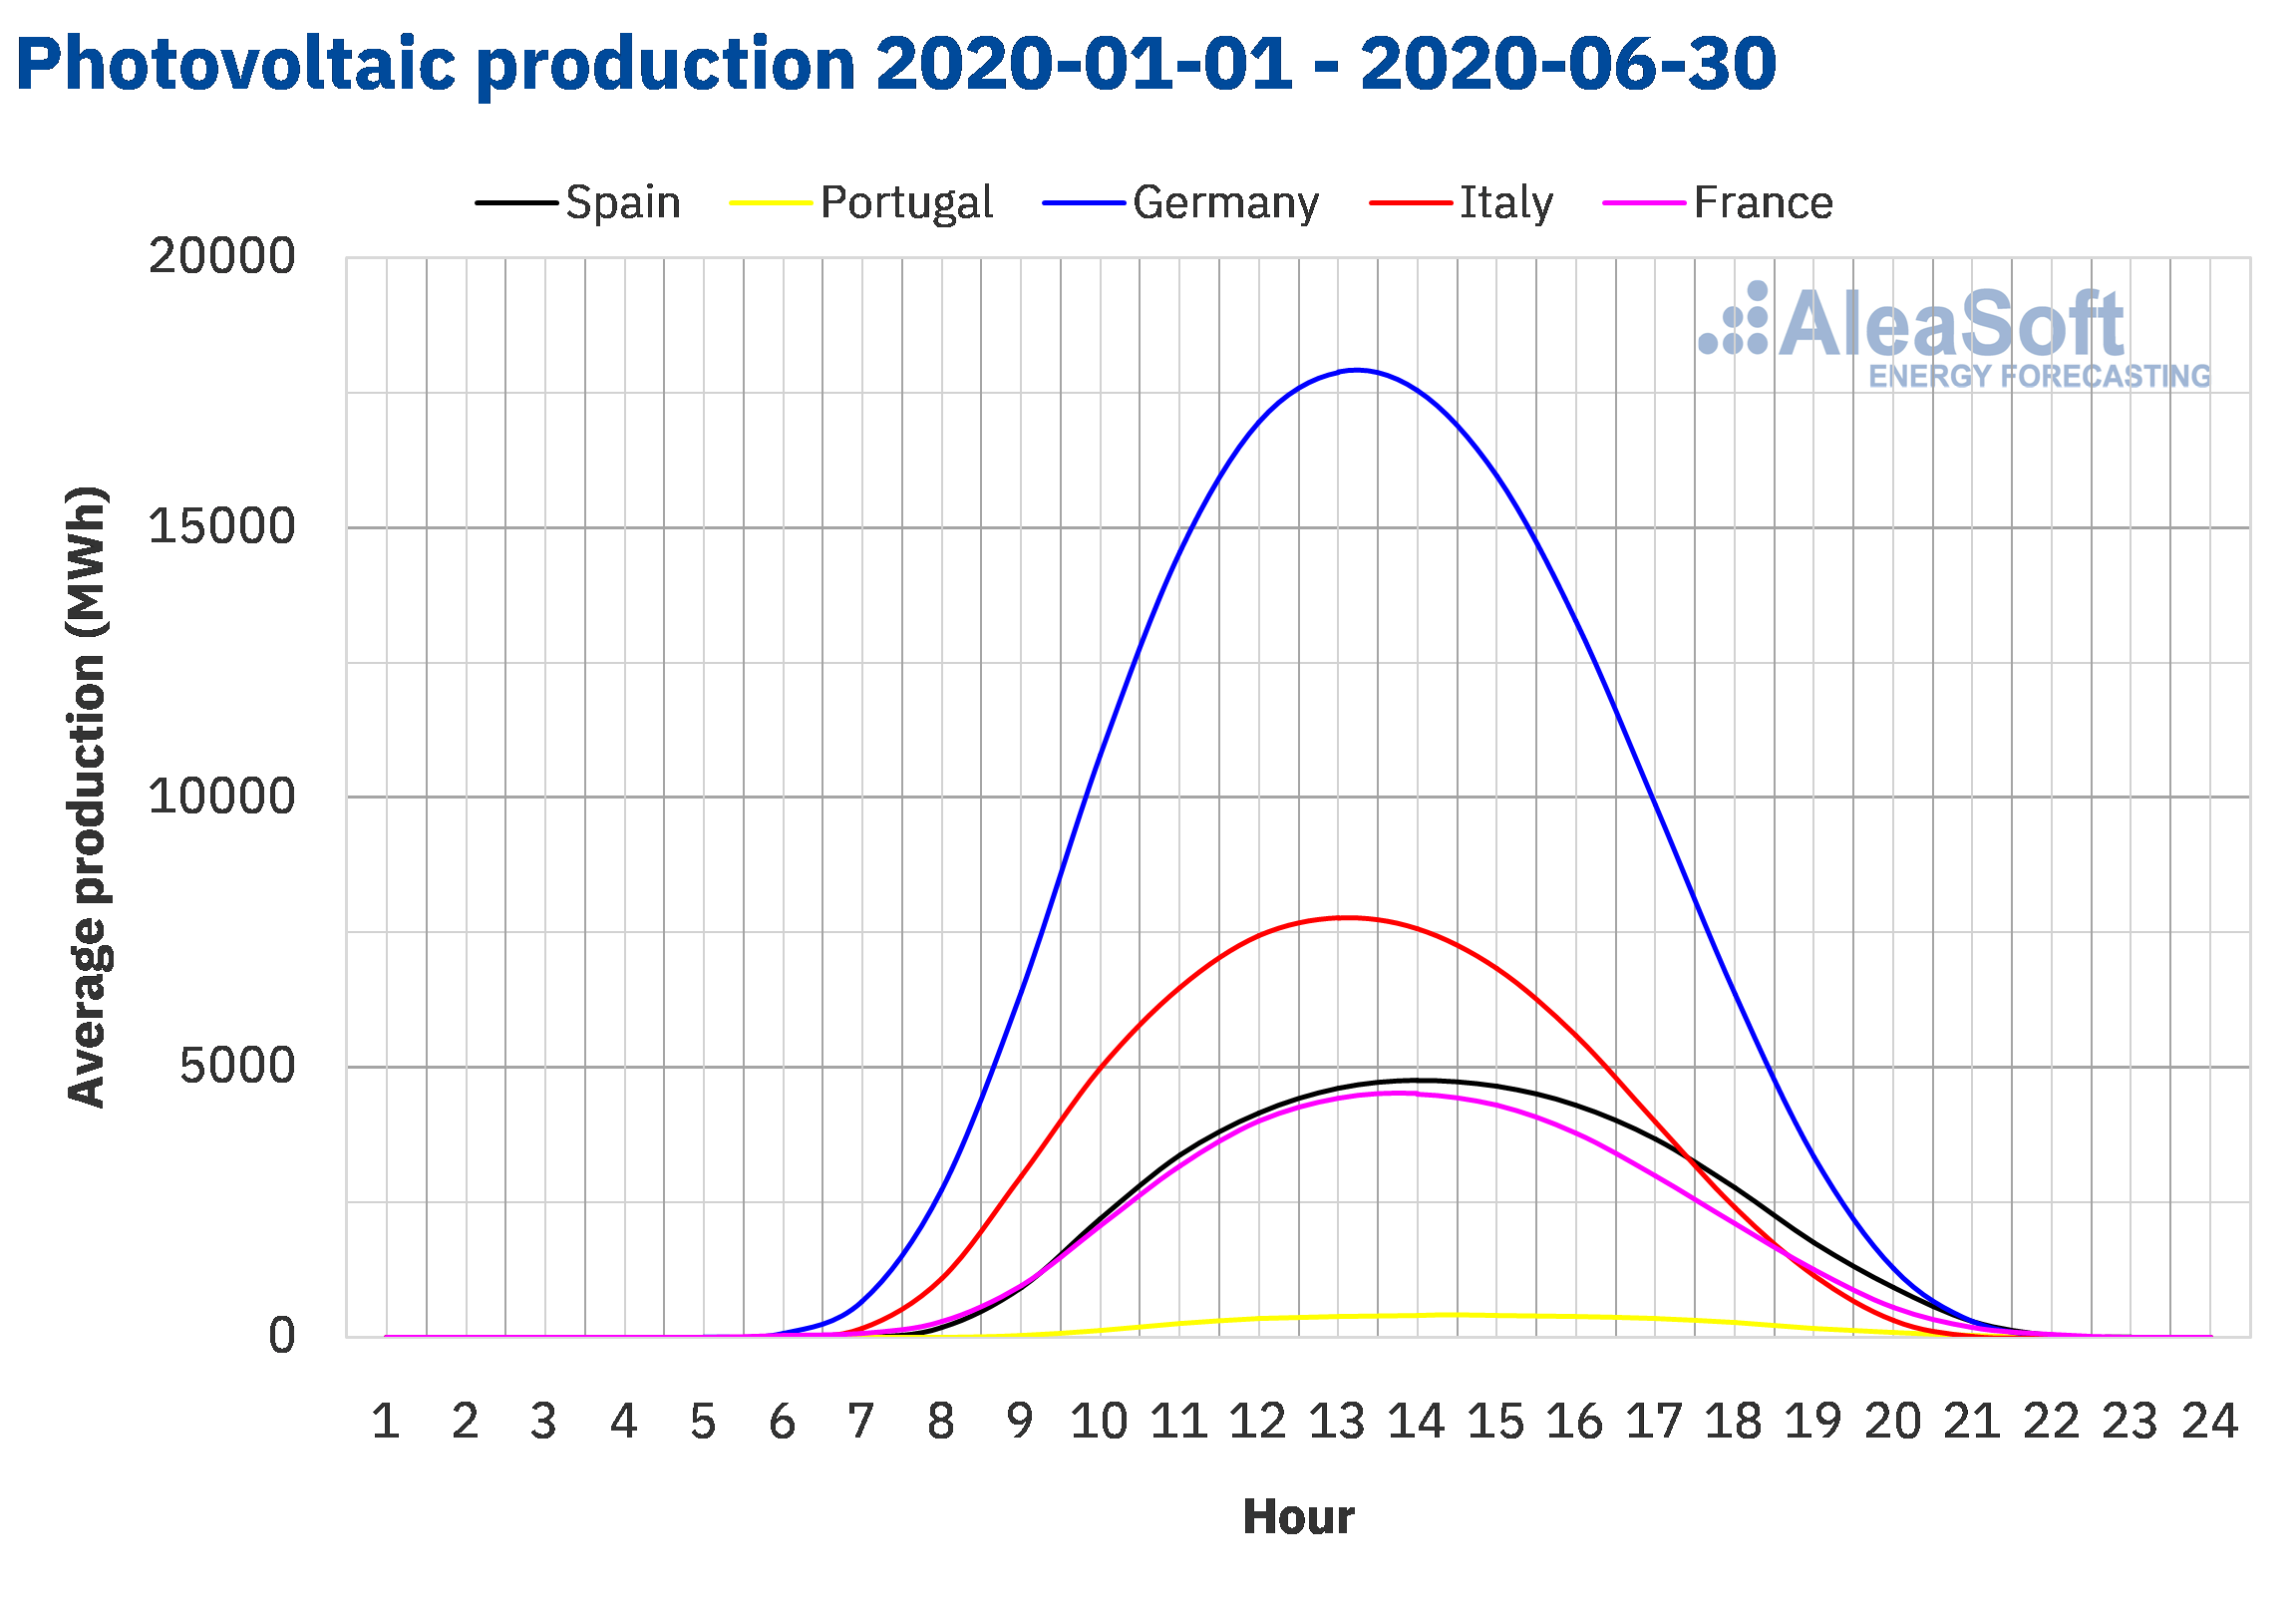 Source: Prepared by AleaSoft using data from ENTSO-E, RTE, REN, REE and TERNA.
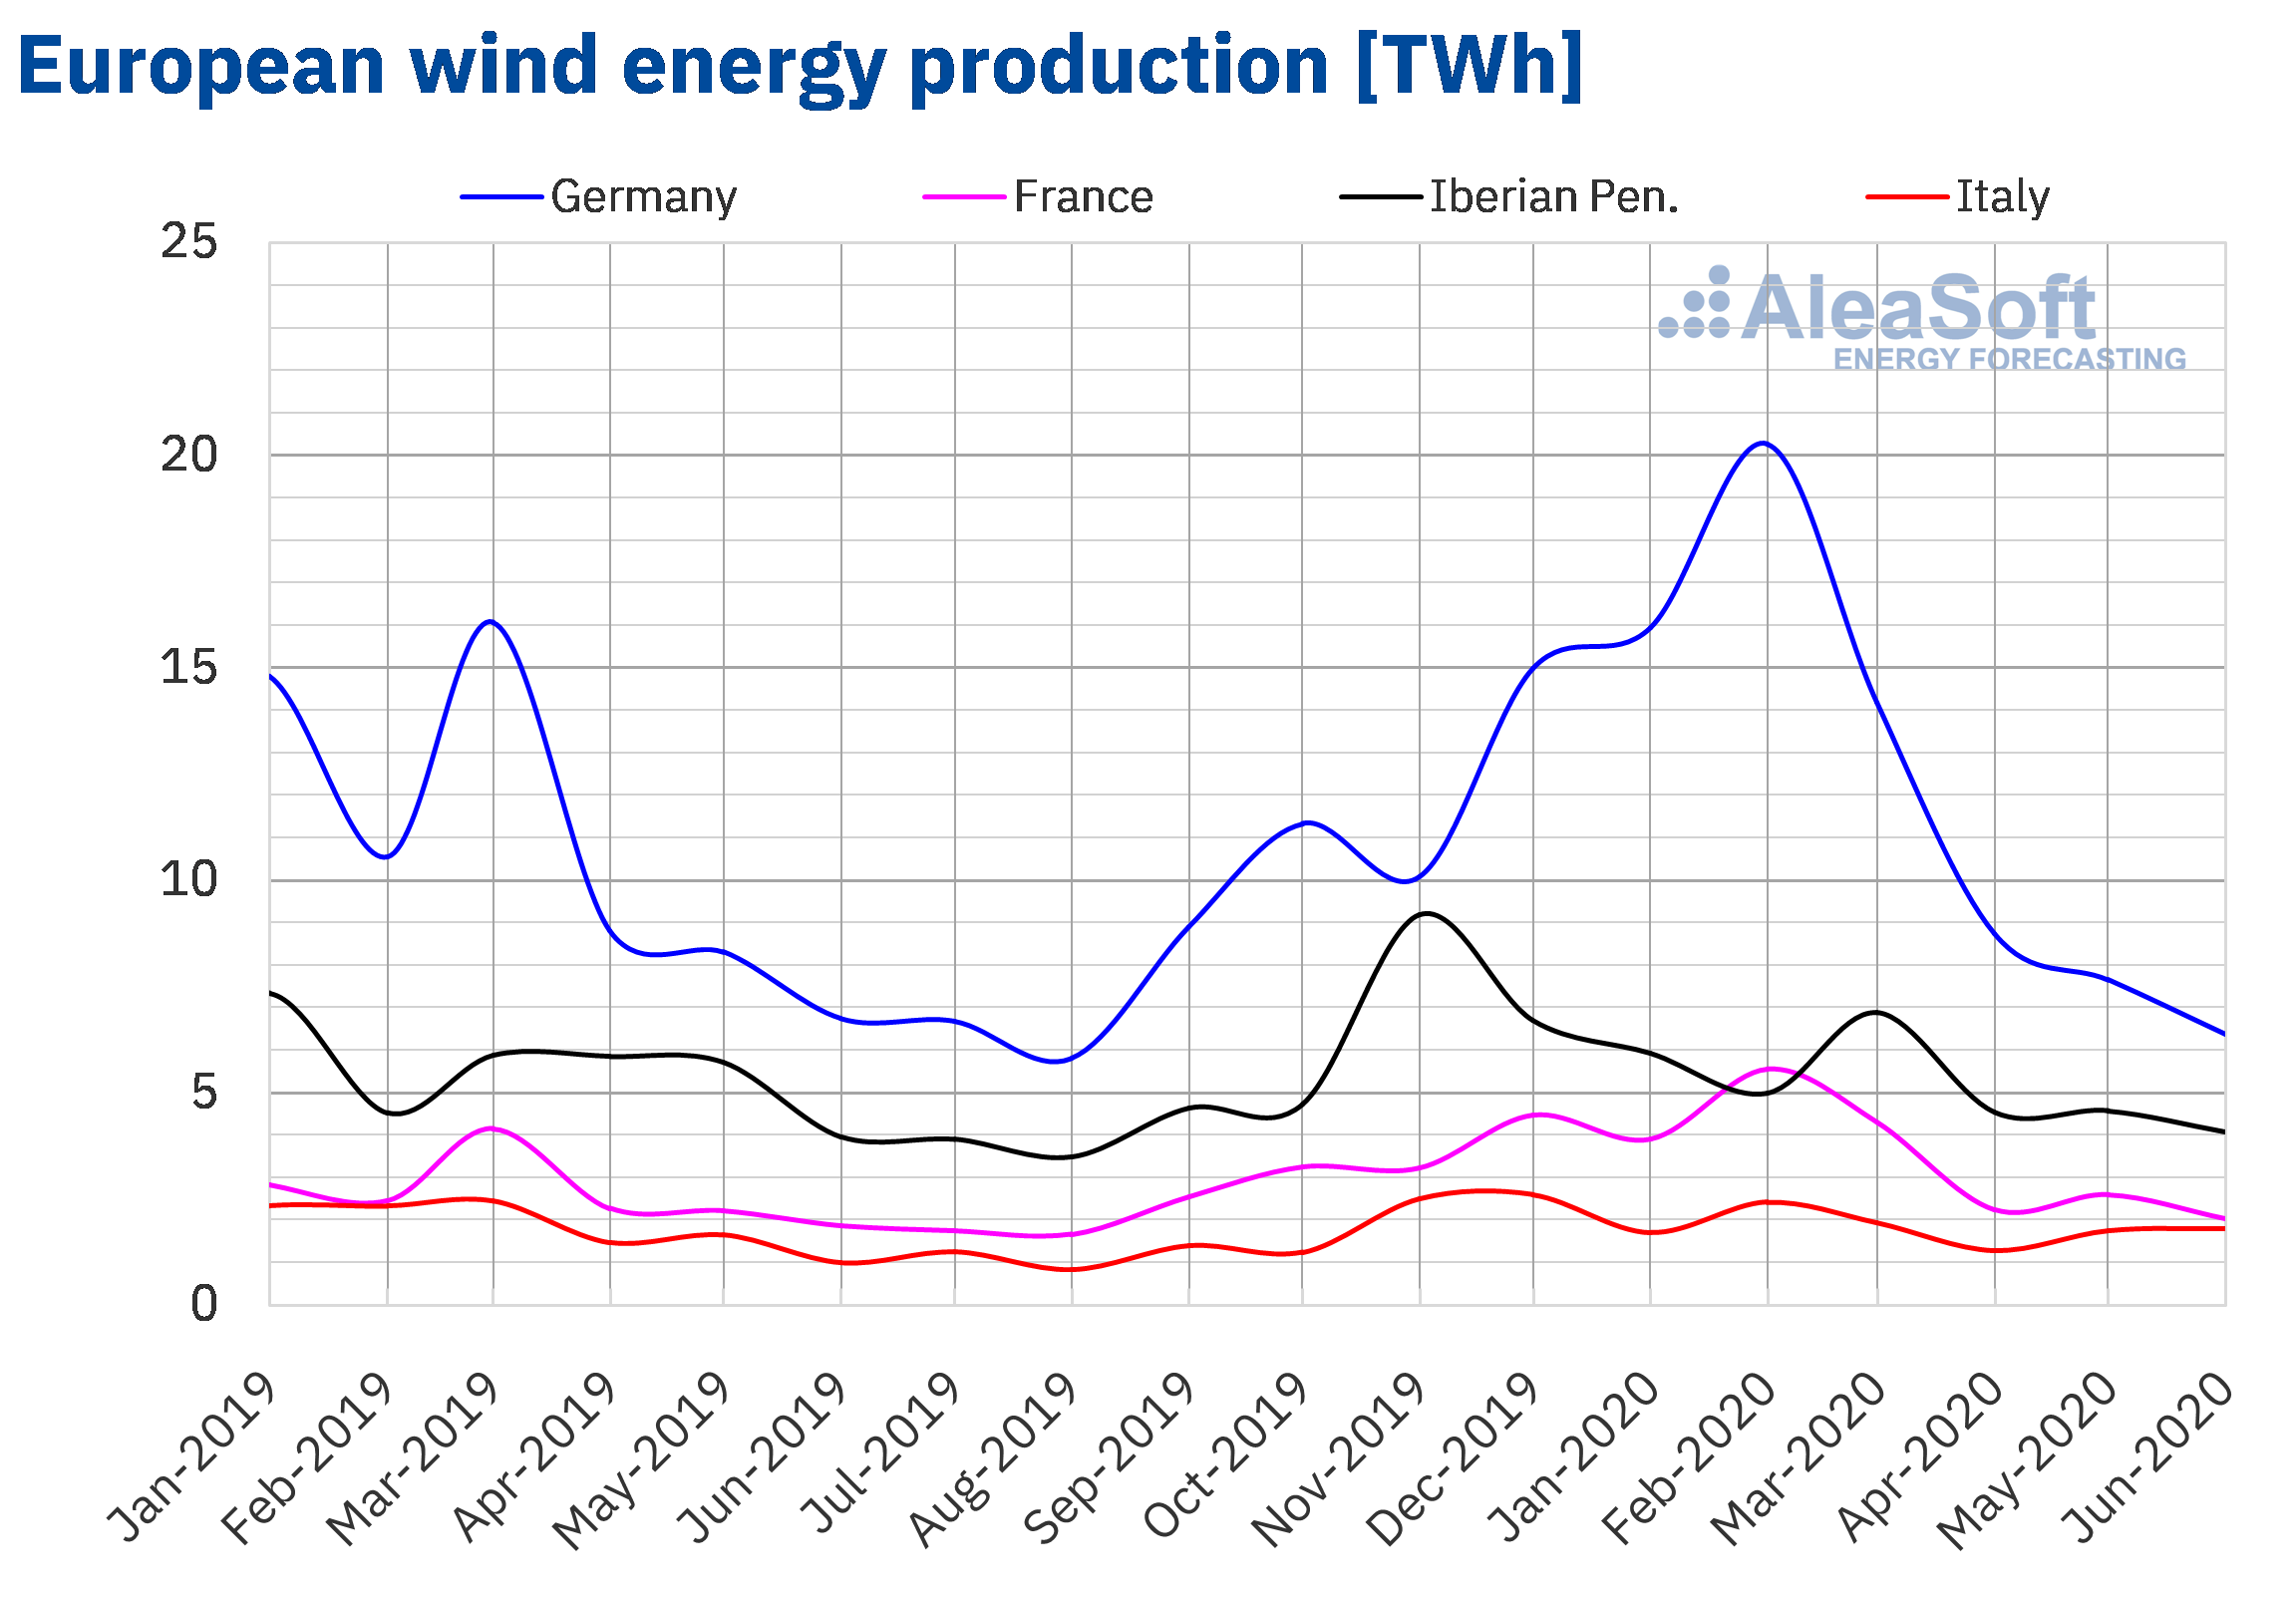
Regarding the wind energy production during the first half of this year, it increased compared to the same half of 2019 in the French and German markets. In the case of the French market, the increase was 31%, while in the German it was 12%. On the contrary, there was a reduction in production in the Iberian Peninsula of 6.8% and in the Italian market of 3.1%.
 Source: Prepared by AleaSoft using data from ENTSO-E, RTE, REN, REE and TERNA.
Electricity demand
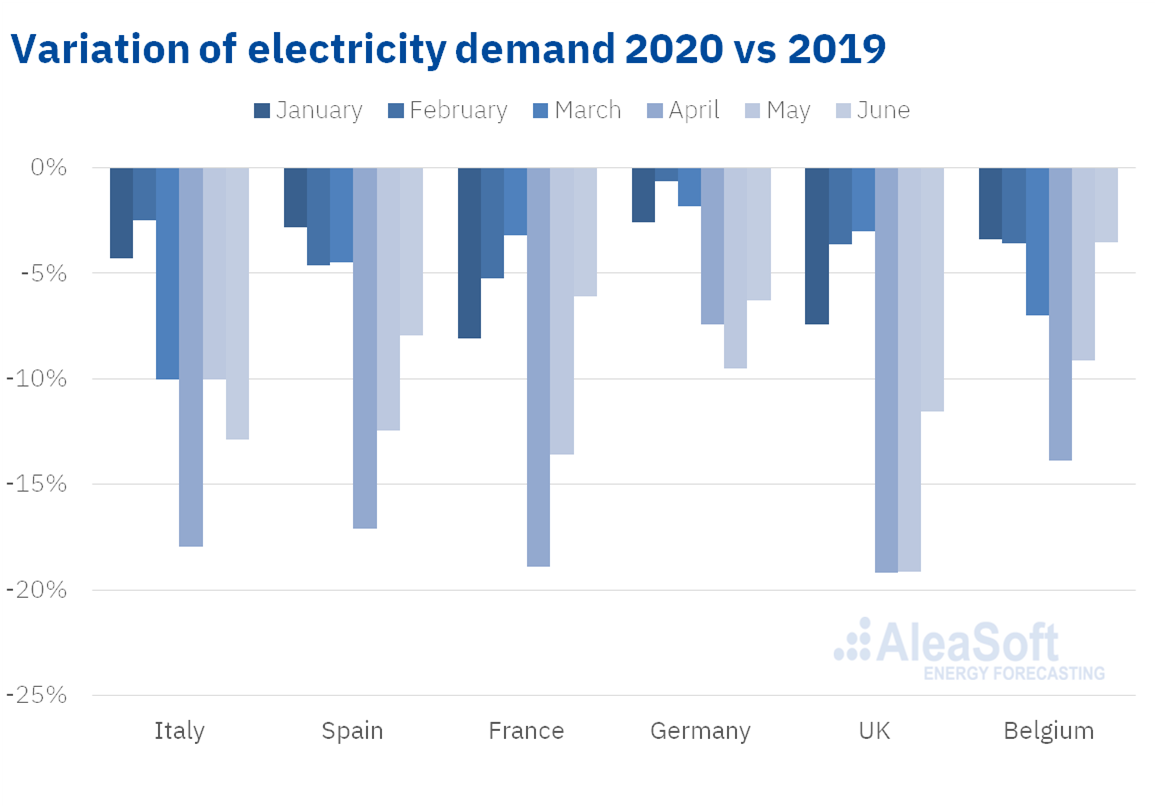
The electricity demand in the first half of 2020 broke the ground of the last 15 years in all European markets, with the exception of Germany, where these low values date back to 2014. The low demand during this period caused that in a large part of Europe the hourly, daily and in some cases monthly, minimums lowered to levels not seen for more than 10 years. All the markets were affected by the confinement measures to stop the spread of COVID‑19, and this was reflected in the monthly demand that did not exceed that of 2019 in any month. The first indications of this influence on the demand were in Italy, which was the first country in Europe to apply the confinement since March 7. This progressive decrease in demand was partially offset by the arrival of summer in the final days of June and by the relaxation of the measures taken to curb the pandemic, ending the confinement on June 15 in most of Europe, which allowed the recovery of the demand in some markets.
The most important falls in demand in these first six months were in the markets of Great Britain, Italy, France and Spain, which registered decreases of 9.7%, 8.9%, 8.3% and 8.3% in year‑on‑year terms respectively. On the other hand, the falls in Germany, Belgium and Portugal were 4.0%, 6.1% and 3.9% respectively.
 Source: Prepared by AleaSoft using data from ENTSO-E, RTE, REN, REE, TERNA, National Grid and ELIA.
The AleaSoft‘s energy markets observatories emerged precisely in this first semester of 2020 to show the trends in the electricity demand and other variables of interest of the electricity markets during this period of coronavirus crisis.
Mainland Spain, photovoltaic and solar thermal energy production and wind energy production
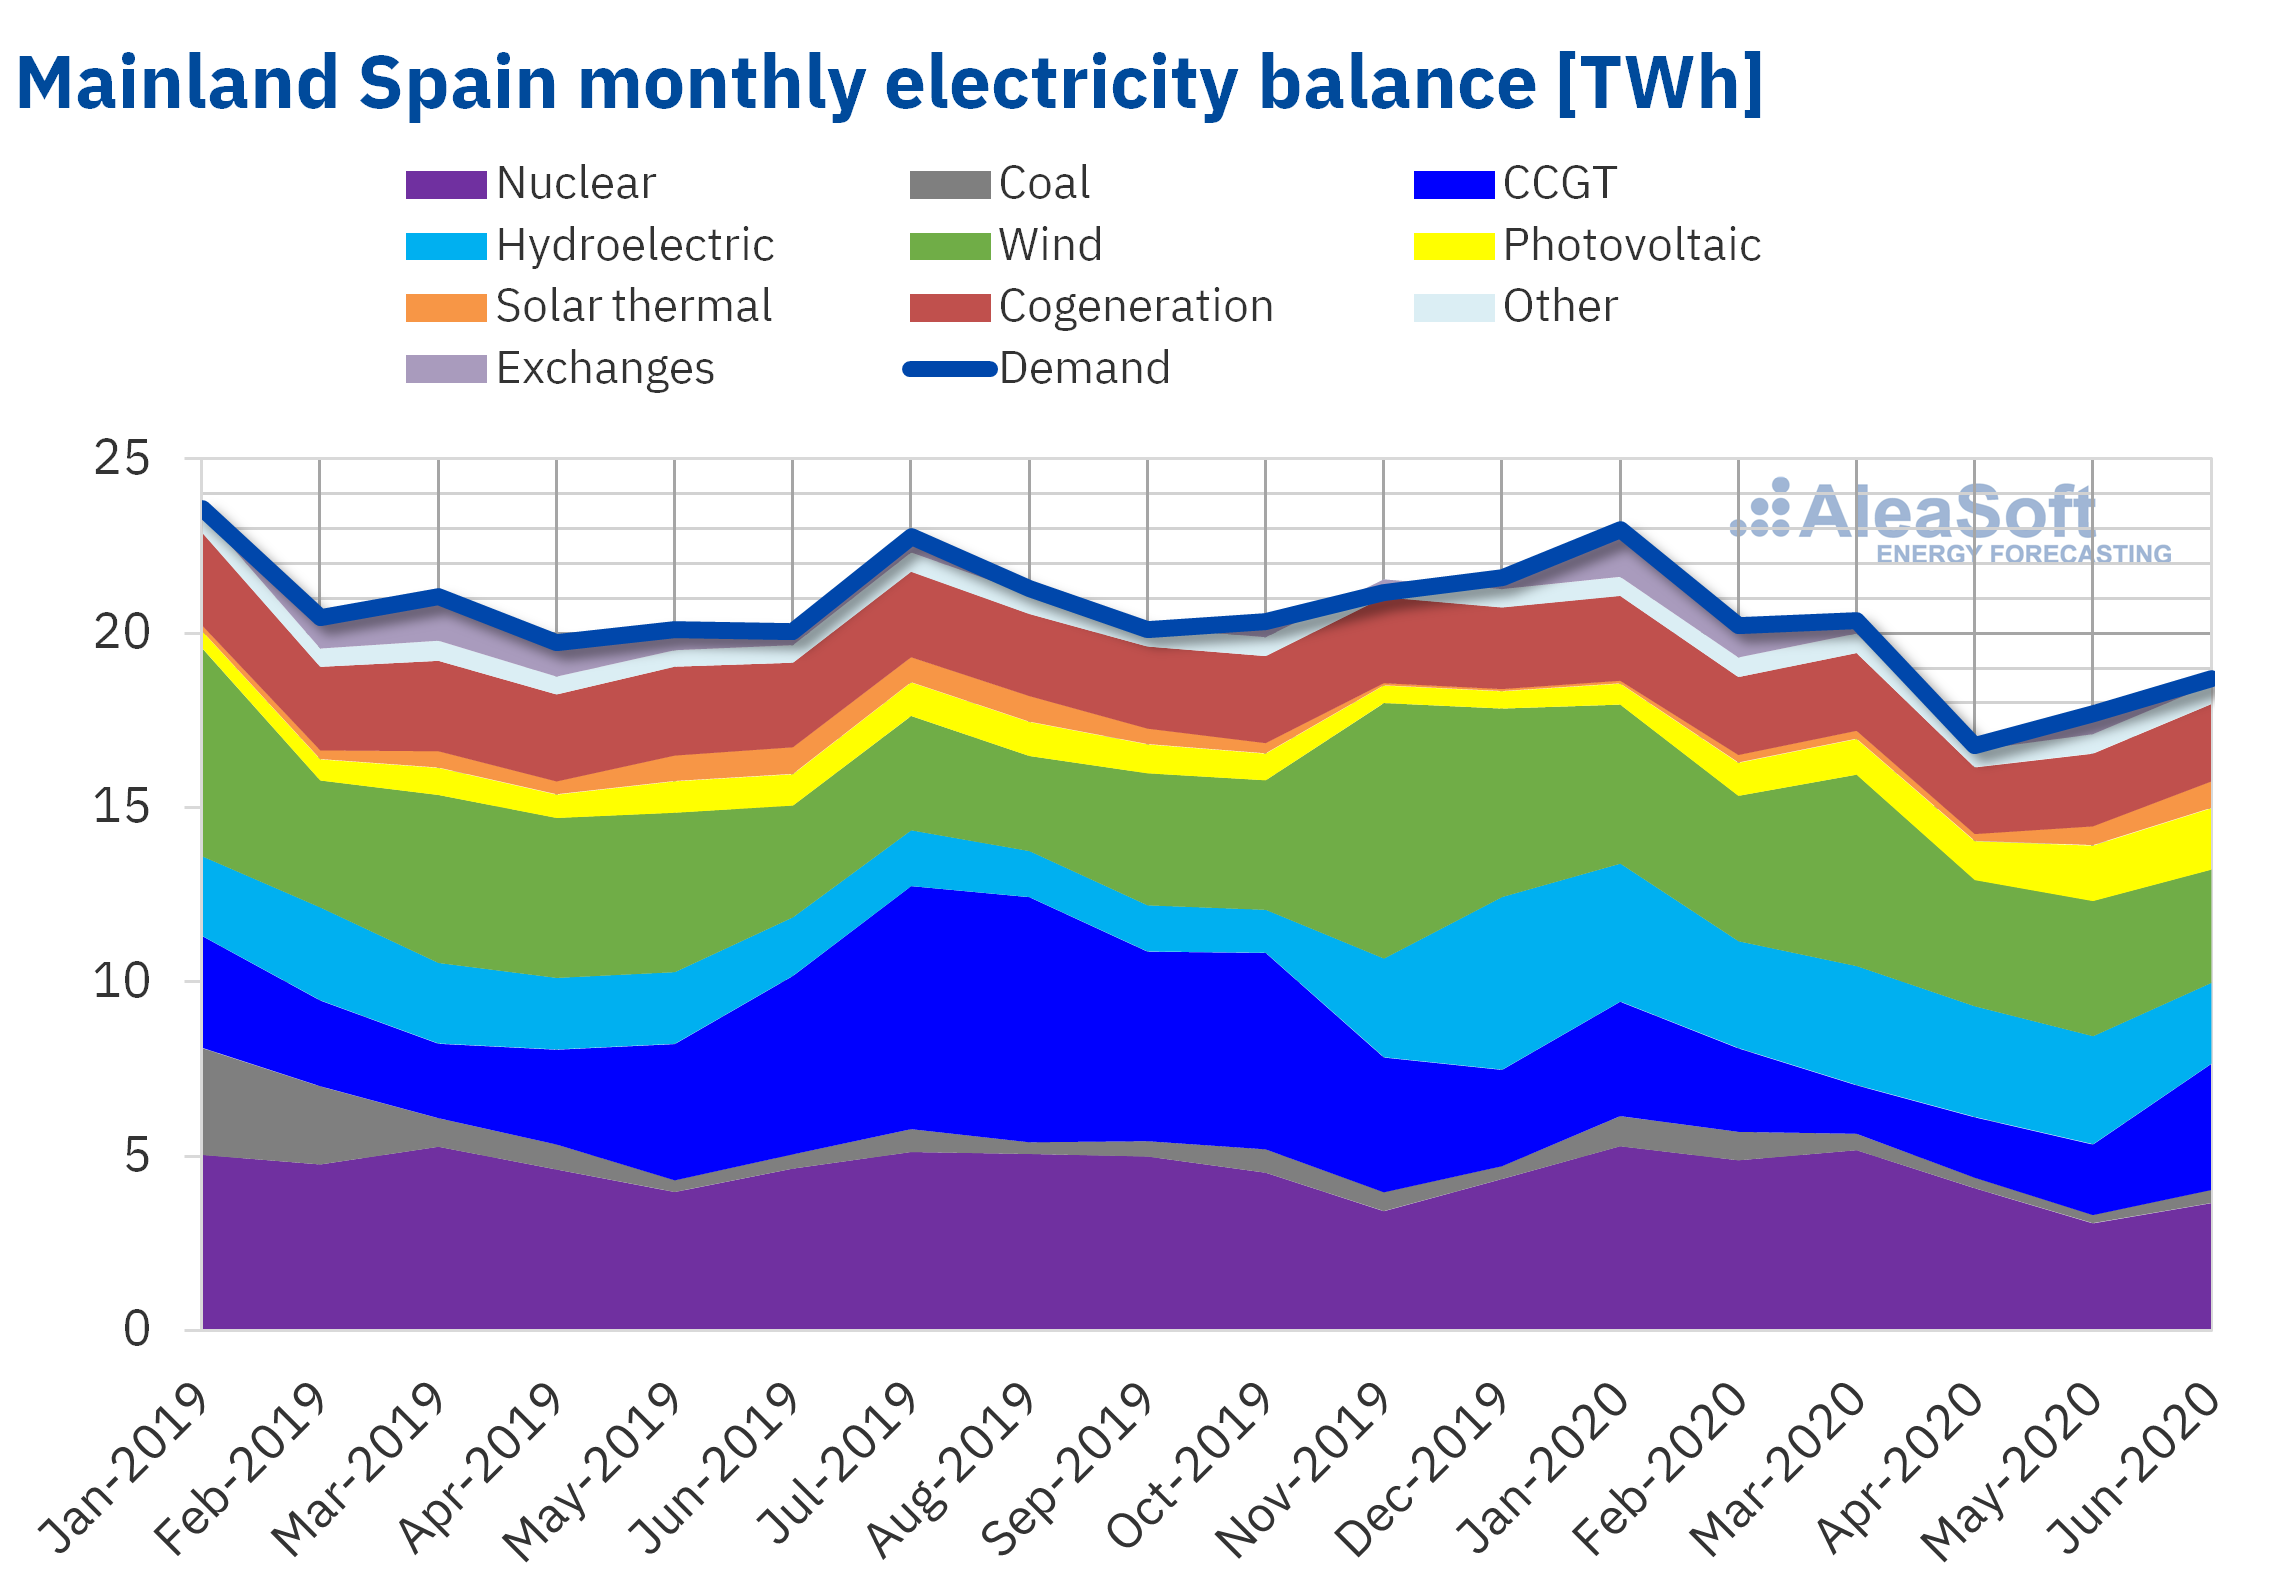
The electricity demand of Mainland Spain of the first half of 2020 fell by 8.3% year‑on‑year. During the first quarter of the year, the demand curve was very similar to that of 2019. It was from the week of March 16 that large differences began to be noticed, as a result of the declaration of the State of Alarm on March 14. In the months of March and April, the demand received the greatest impact due to the confinement measures, reaching in April the lowest demand value since 2001, almost 20 years ago. The State of Alarm in Spain was in force until June 21. In the first week of the “new normality” the demand rose 6.4% compared to the week of June 15, to which the increase in temperatures also contributed.
 Source: Prepared by AleaSoft using data from REE.
In the first half of the year, the renewable energies covered 47% of the generation of the electricity mix, which represents a recovery compared to the previous half when they covered 38%. In addition, it exceeds the percentage that it represented in the mix in each of the last four semesters.
At the end of the first half of 2020, the solar photovoltaic energy production of Mainland Spain increased by 57% compared to the previous semester and 61% in the year‑on‑year analysis. In contrast, the solar thermal energy production decreased by 11% compared to the previous semester and 26% compared to the first half of last year. Between January and May 2020, 611 MW of solar photovoltaic energy were installed, which represents an increase of 7.1% compared to what was installed at the end of 2019. Throughout the semester, the solar photovoltaic energy production gradually increased and a historical record of 102 GW was reached on June 21. It is also noteworthy that for the first time in the history in this semester, the solar energy production in Spain, which includes the photovoltaic and solar thermal technologies, surpassed the nuclear energy production on February 20 at 13:30.
During the first semester of 2020, the wind energy production of Mainland Spain decreased by 7.3% compared to the same semester of 2019.

The production with coal registered a significant decrease of 60% when comparing the data for the first semester of 2020 and 2019. At the end of June, eight coal‑fired power plants, totalling 5.5 GW, were closed. Likewise, the production with combined cycle gas turbines was reduced by 27% compared to the first half of 2019.
The nuclear energy production during the recently concluded semester decreased by 8.1% compared to the first semester of 2019. During this period, there was the disconnection from the electricity grid of the Trillo Nuclear Power Plant on May 18, of unit 1 of the Almaraz Nuclear Power Plant on April 14 and of unit 1 of the Ascó Nuclear Power Plant on April 28. The three plants are already in operation. Unit 1 of the Ascó Nuclear Power Plant was connected to the electricity grid in the first week of June, while the Trillo and Almaraz I plants were incorporated on June 20 and 21, respectively. Another significant event during the last semester was the support of the Plenary of the Nuclear Safety Council (CSN), on Wednesday, June 23, to the extension of the operating license of the Vandellós II plant until 2030. The current operating permit of this plant, which has 1 GW of capacity, was granted in the summer of 2010 and expires on July 26.
On the other hand, the hydroelectric energy production increased by 43% compared to that of the same semester of 2019.
 Source: Prepared by AleaSoft using data from REE.
The hydroelectric reserves are currently of 15 364 GWh, which represents 67% of the total capacity and 128% of that available at the end of the first half of 2019.
European electricity markets
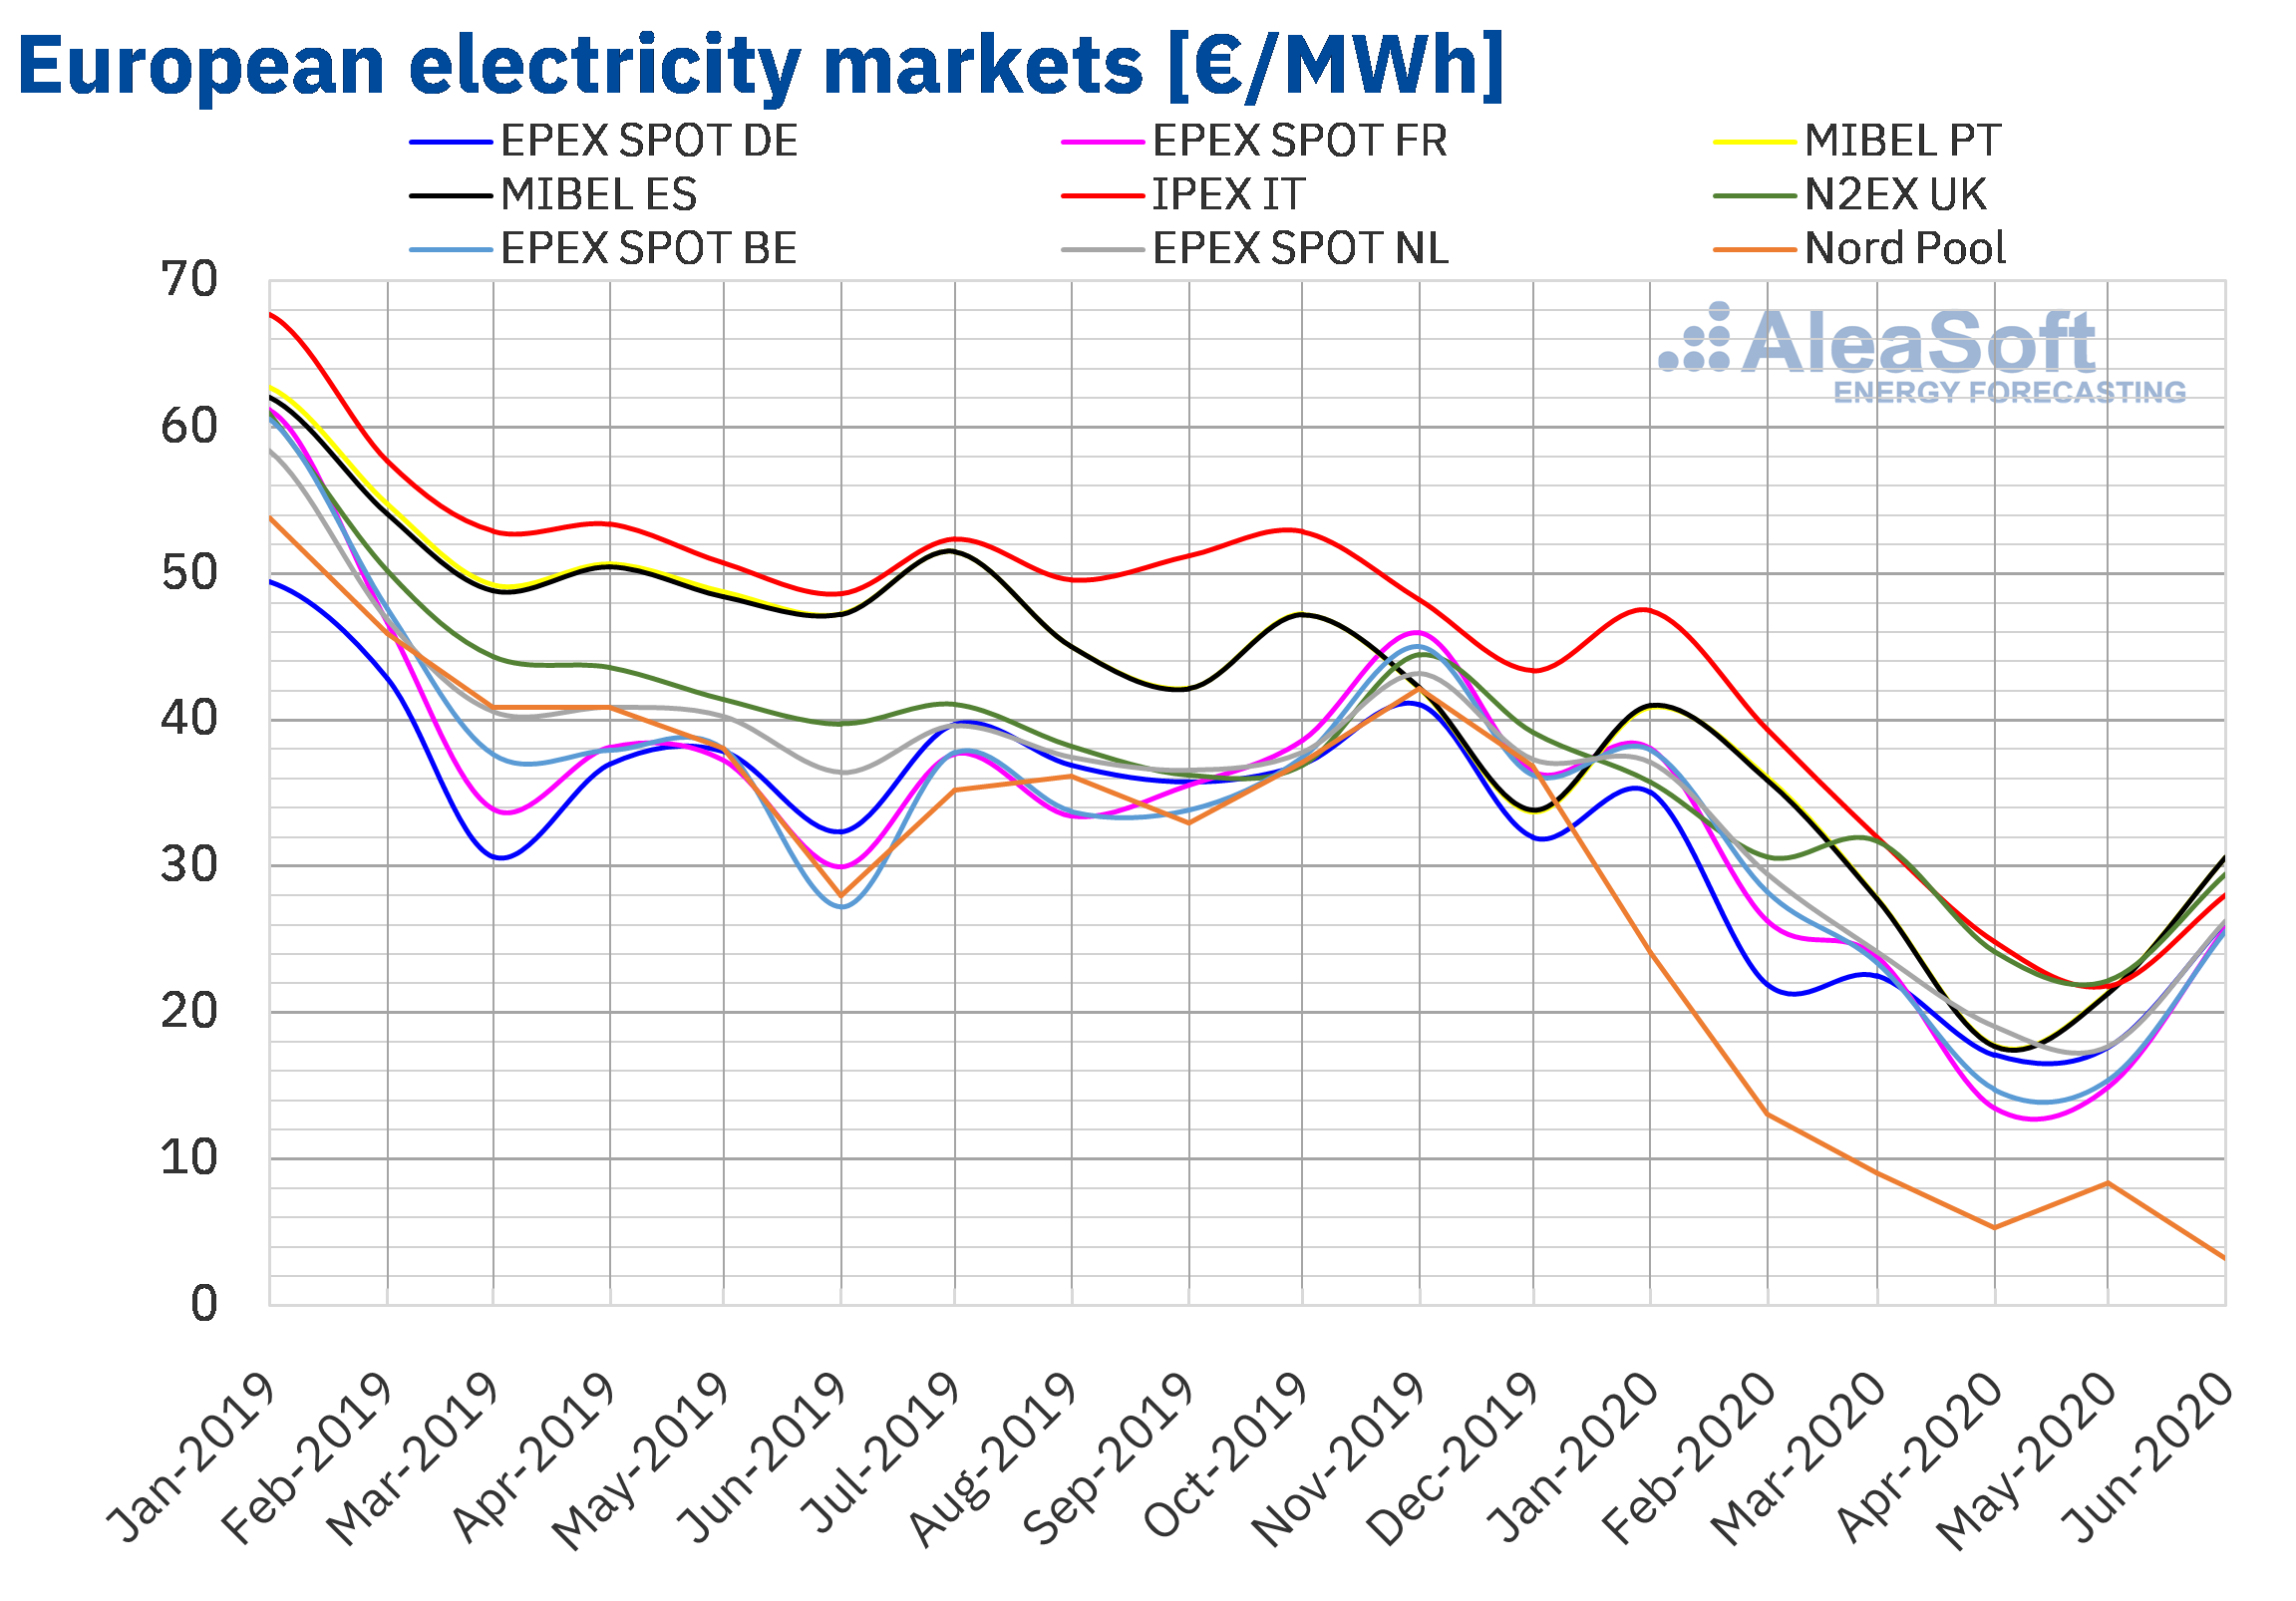
The European electricity markets showed a downward trend for most of the first half of 2020. In most of the analysed markets, the month with the lowest average was April, with a recovery in prices starting in May. But, in the case of the IPEX market of Italy, the N2EX market of Great Britain and the EPEX SPOT market of the Netherlands, they did not start the recovery until June. On the other hand, the Nord Pool market of the Nordic countries, after starting its recovery in May, fell again in June, thanks to the high hydroelectric energy production due to the thaw.
In the first half of 2020, the market in which the half‑yearly average price decreased the most, both with respect to the previous semester and with respect to the first semester of 2019, was the Nord Pool market of the Nordic countries, with drops of 71% and 74% respectively. While the market with the smallest decrease in prices compared to the previous semester, of 27%, was the British one. Compared to the first half of 2019, the smallest drop in prices, of 39%, corresponded to both the British and German markets.
As a consequence of these decreases, the half‑yearly average price was the lowest of all semesters since 2011 in all the analysed European markets and was lower than €30/MWh in most of them, with the exception of the IPEX and N2EX markets, which reached €32.21/MWh and €32.70/MWh respectively. In contrast, the Nord Pool market had the lowest half‑yearly average, of €10.52/MWh, followed by the EPEX SPOT markets of Germany and France, with €23.42/MWh and €23.71/MWh respectively.
In the first half of 2020, the evolution of the prices was strongly influenced by the development of the COVID‑19 pandemic and the confinement measures adopted in the different countries to combat the spread of the disease. These measures led to a general decrease in demand, as well as in gas, coal and CO2 emission rights prices, which favoured the price decreases in the different electricity markets.
But, in May, despite the fact that the gas and coal prices fell by 31% and 5.4%, respectively, compared to those of April, the decrease in renewable energy production in Germany and in nuclear energy production in countries such as Germany, France or Spain favoured the start of the price recovery in most European electricity markets. Another factor that favoured this behaviour was the recovery in CO2 prices. Furthermore, the increase in electricity demand in some countries due to the start of the de‑escalation of the confinement measures also contributed to the increase in prices. This deconfinement process continued in June and together with the increase in temperatures allowed the upward trend in prices of most markets to continue.
 Source: Prepared by AleaSoft using data from OMIE, , N2EX, IPEX and Nord Pool.
On the other hand, during the first semester of 2020, negative hourly and daily prices were reached on various occasions in some European electricity markets.
Among the negative hourly prices of the semester, the price reached in the Belgian market at the hour 15 of Monday, April 13, of ‑€115.31/MWh, stands out for its value. This price is the lowest since June 2019 in that market. The price of Sunday, April 5, at the hour 16, in Great Britain, of ‑€21.56/MWh, which is the lowest in the last ten years in the British market, also stands out.
On the other hand, among the negative daily prices, the price of Saturday, May 23, in the British market, of ‑€11.31/MWh, stands out as it is the first time that a negative daily price was reached in this market since January 1, 2010. In the case of the markets of France and the Netherlands, on April 13, the lowest daily prices of the last six and nine years, respectively, were reached.
Iberian market
The average prices of the first semester of 2020 in the MIBEL market of Portugal and Spain, of €29.06/MWh and €29.00/MWh respectively, were the third and fourth highest in the European markets after those corresponding to the N2EX and IPEX markets. Despite this, in the MIBEL market there was a sharp decrease in prices in this semester, as in the rest of the European markets, mainly influenced by the impact of the confinement measures to combat the spread of the COVID‑19 pandemic.
Compared to the previous semester, in the first semester of 2020, the average price decreased by 34% for Spain and by 33% for Portugal. While, compared to the first half of 2019, the decrease was 44% in both cases.
In the month of April, the minimum monthly price for the semester was reached, of €17.77/MWh in Portugal and €17.65/MWh in Spain. However, the monthly average price of the MIBEL market started to recover in May, increasing by 20%. In June, the increase was 43% in the Portuguese market and 44% in the Spanish market. This allowed the June price to be above €30/MWh in both countries, specifically €30.62/MWh in Spain and €30.64/MWh in Portugal.
The beginning of the deconfinement process, which caused an increase in demand, the recovery of the CO2 prices and the decrease in nuclear energy production, favoured the start of the recovery of the prices in the MIBEL market from the month of May.
Electricity futures
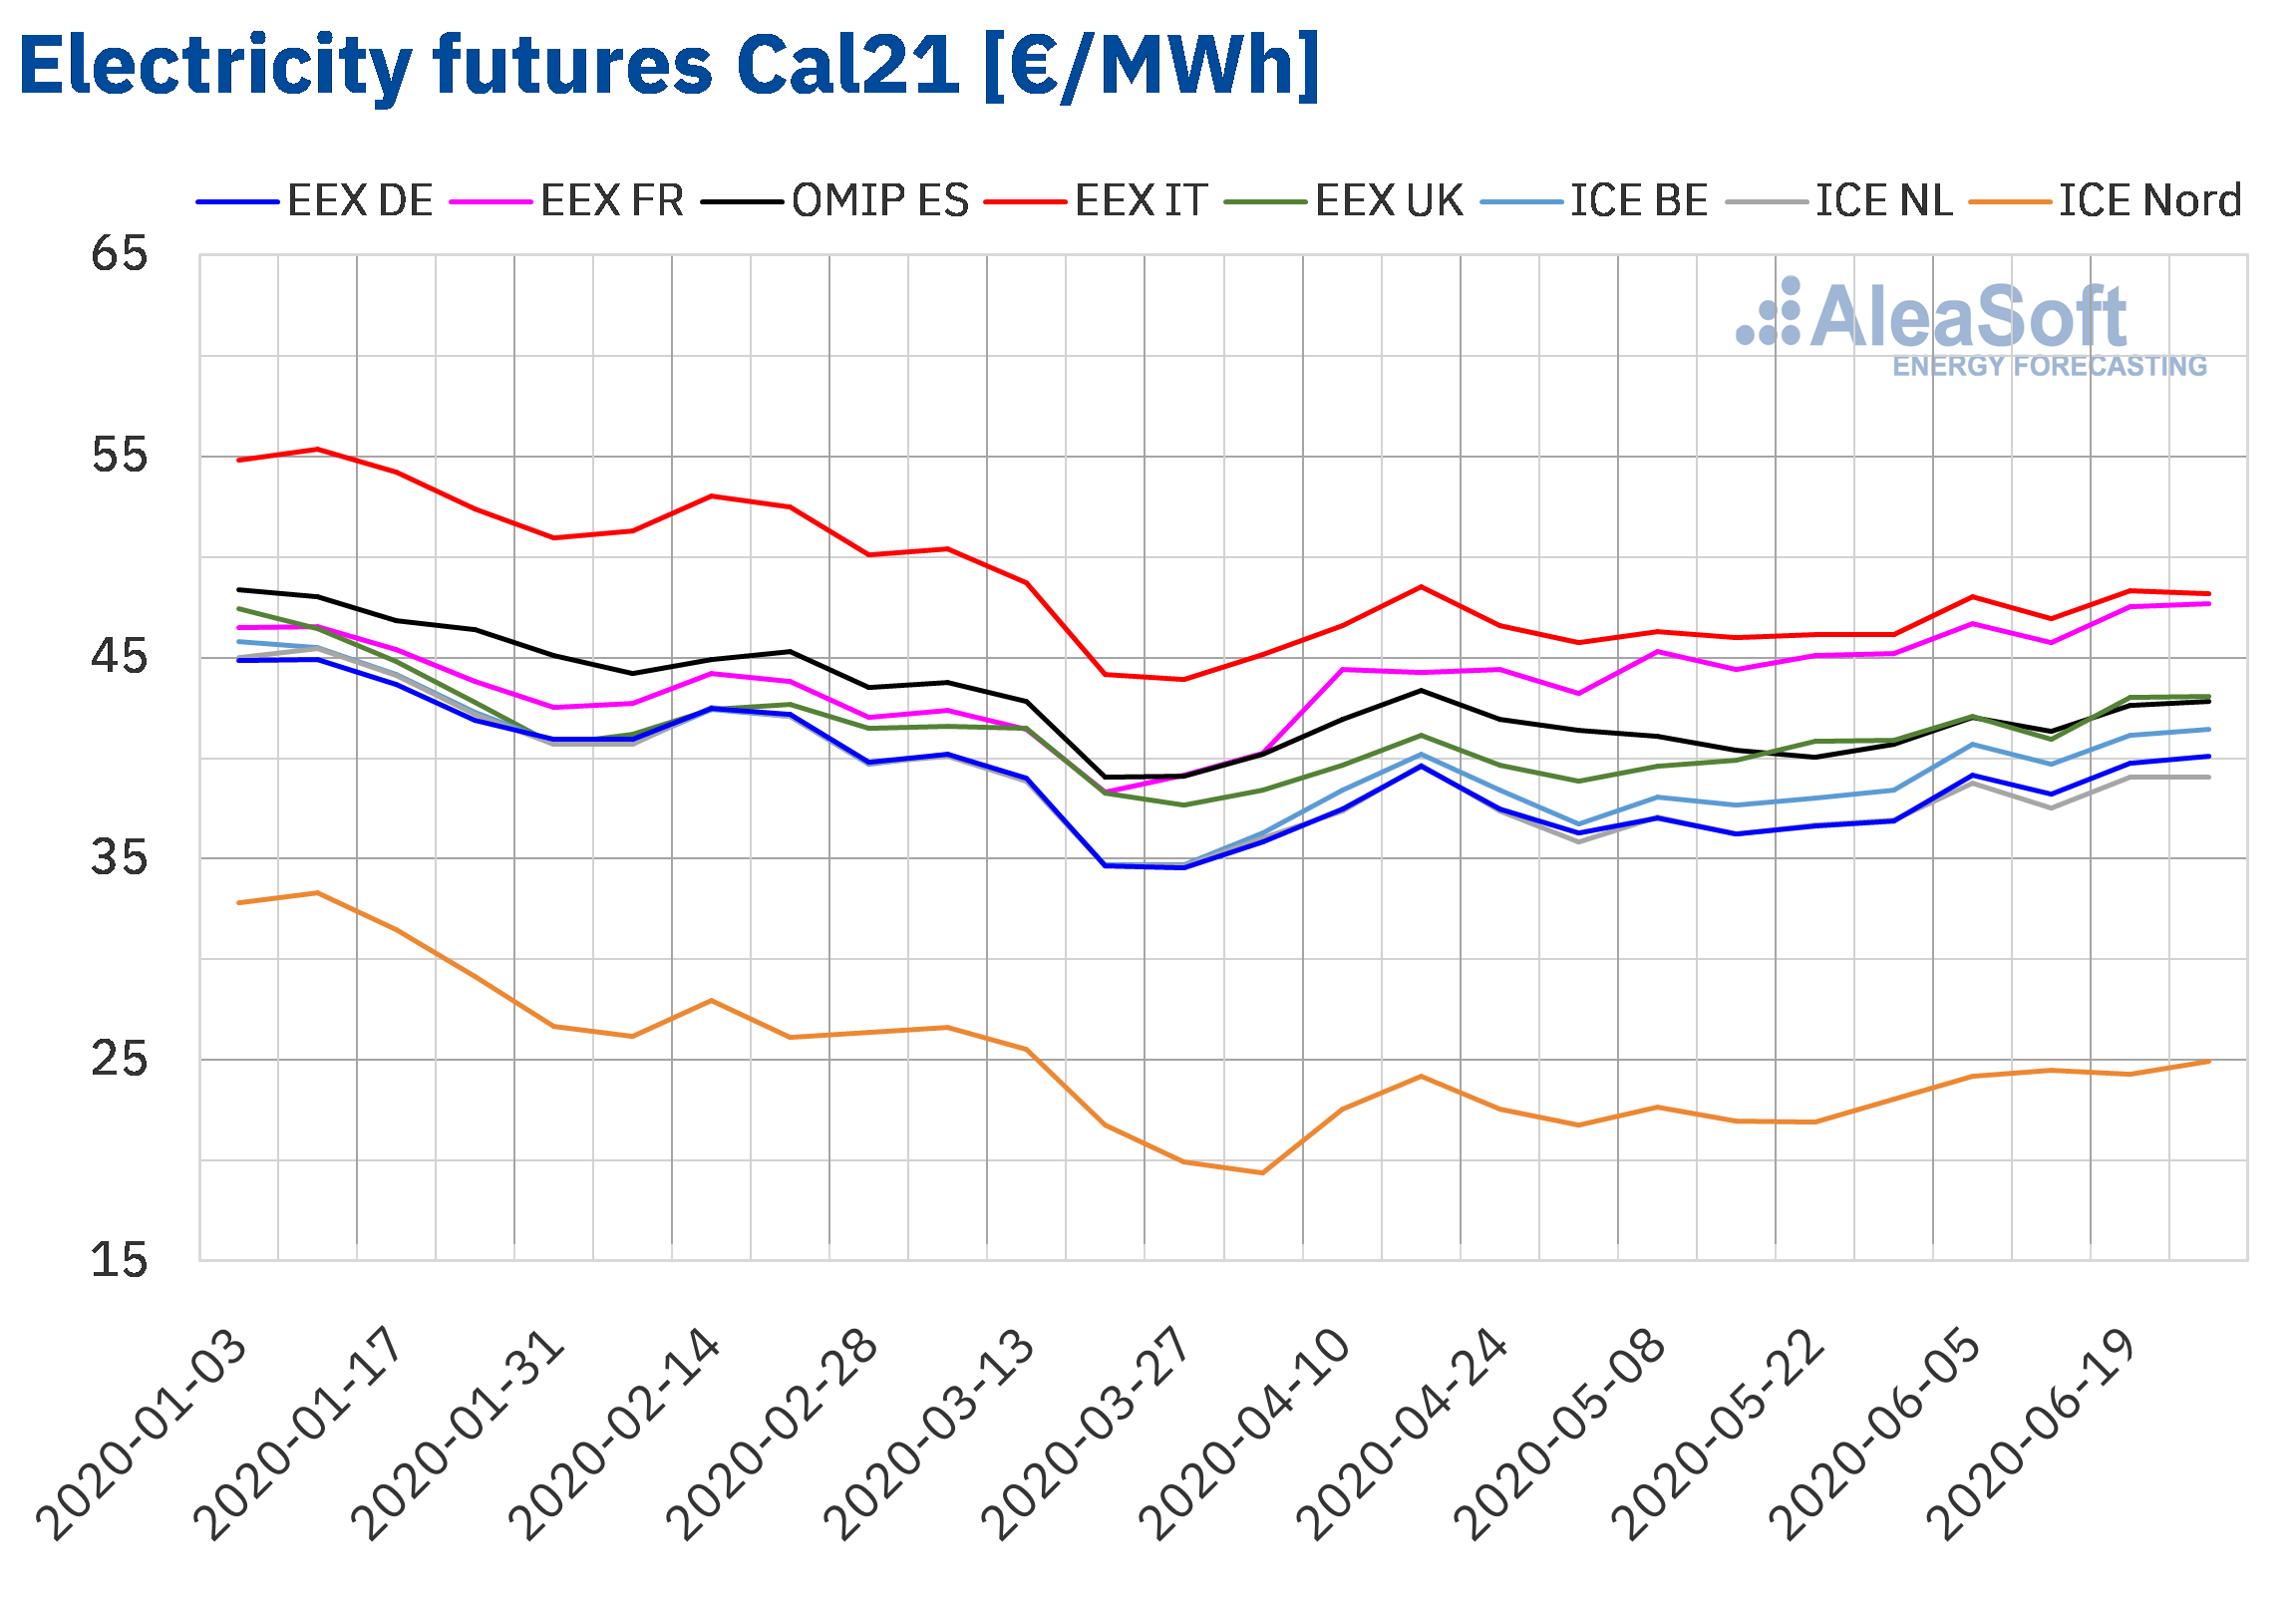
During the recently concluded first semester of 2020, the electricity futures prices for the next year 2021 had a generally downward behaviour, largely driven by the drop in gas prices. At the beginning of March, an abrupt fall was observed that responds to the health crisis of the COVID‑19 pandemic, a relationship that was established through the fall of the CO2 emission rights futures. The change in trend presented by the prices at the end of the period responds fundamentally to the stop of the fall in gas prices, to the signs of recovery of the spot electricity markets and to the relaxation of the measures imposed to stop the expansion of the coronavirus.
The highest priced electricity futures among the markets analysed at AleaSoft were those of the EEX market of Italy, which maintained this position throughout the semester. The EEX market of Germany, France, Spain, Great Britain, the OMIP market of Spain and Portugal and the ICE market of Belgium and the Netherlands remained during the first half of the semester in the group of markets with medium prices. However, in the EEX market of France, during the second half of the semester, the prices increased, separating from the rest of the markets, and at the end of the semester, it joined Italy as one of the markets with the highest price for this product.
This behaviour of the EEX market of France began when in mid‑April its prices rose compared to the general trend of the countries in the region. The root cause was the EDF’s announcement that it would expand the shutdowns of its nuclear park due to the pandemic.
The ICE market of the Nordic countries maintained prices much lower than those of the rest of the analysed markets throughout the period. It is noteworthy that during the days of the greatest drop in prices due to the coronacrisis, this market reached prices below €20/MWh for six consecutive days, the only days in the entire history of the trading of this product, since its beginning in January 2017, with such low prices. The settlement price of April 1, of €19.02/MWh, is the lowest so far.
 Source: Prepared by AleaSoft using data from EEX, OMIP and ICE
Brent, fuels and CO2
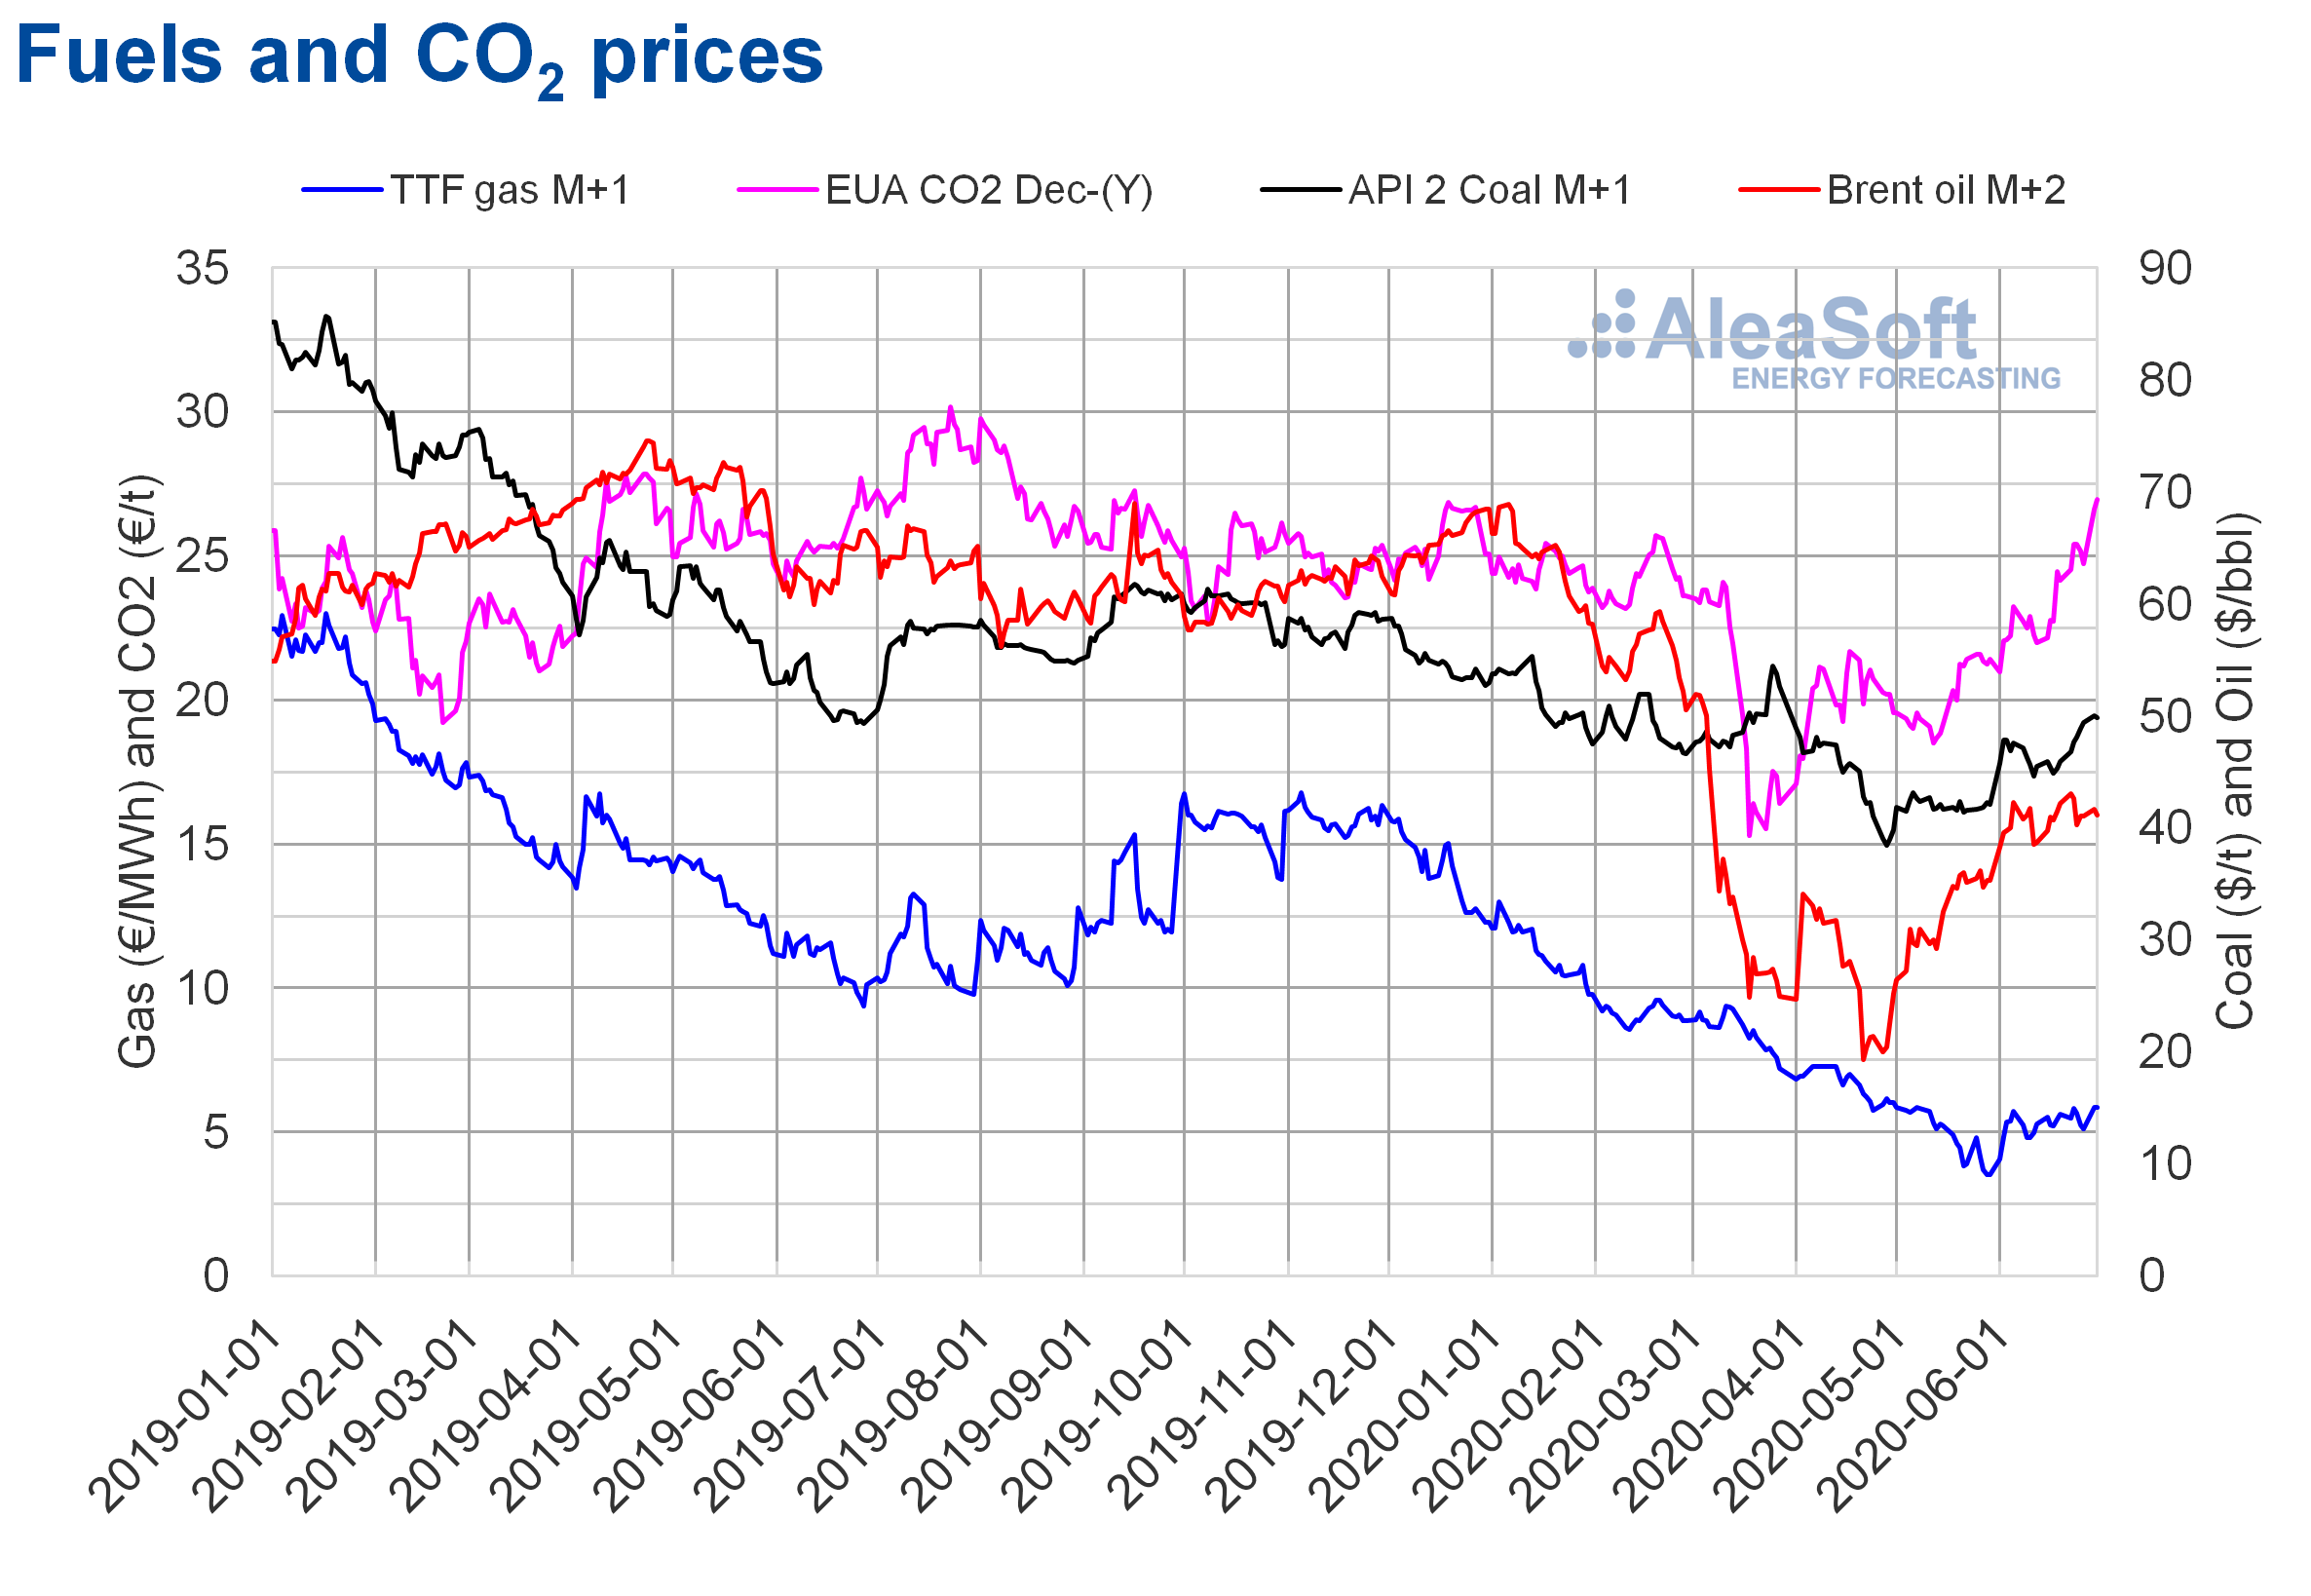
The Brent oil futures prices for the month M+2 in the ICE market reached their maximum settlement price for the first half of 2020, of $68.91/bbl, on January 6. But later they fell until reaching the half‑yearly minimum price, of $19.33/bbl, on April 21. The OPEC+ production cuts allowed the start of the price recovery in May and in the last fortnight of the semester the settlement prices already remained above $40/bbl. On the other hand, the half‑yearly average price was $42.41/bbl. This value is 32% lower than that reached by the futures for the month M+2 in the previous semester, of $62.19/bbl, and 36% lower than that corresponding to the M+2 futures traded in the first semester of 2019, of $66.17/bbl.
In the first half of 2020, the COVID‑19 pandemic and the measures taken to try to contain its spread exerted a downward influence on the Brent oil futures prices, due to the reduction in demand.
On the other hand, the OPEC+ failed to agree on a reduction in production that would stabilize the market at the meeting held in early March. In addition, Russia and Saudi Arabia launched a trade war, considerably increasing their production in April. In a context in which the storage capacity was very limited, the excess production caused prices to collapse, reaching historical lows.
However, the OPEC+ agreed to start production cuts from May, allowing the start of the price recovery. This recovery was also favoured by increased demand as many countries began to relax the confinement measures.
In the first semester of 2020, the TTF gas futures in the ICE market for the month M+1 reached their maximum price, of €12.98/MWh, on January 3. During most of the semester, the prices followed a downward trend and reached the half‑yearly low, of €3.51/MWh on May 28, which was the lowest in the last two years. Subsequently, the prices began to recover, until being above €5/MWh in June. On the other hand, the average value registered during the semester was €7.63/MWh. Compared to the futures for the month M+1 traded in the previous semester, this decreased 42% from €13.18/MWh. When compared to the M+1 futures traded in the first half of 2019, when the average price was €15.76/MWh, the decrease was 52%.
In the case of the spot market, in the first half of 2020, the TTF gas prices reached their maximum index price of €12.40/MWh on January 7. While the half‑yearly minimum index price, of €2.76/MWh was registered on May 23, 24 and 25 and it was the lowest index price since October 2008. On the other hand, the average price for this semester was €7.52/MWh, 34% lower than that of the previous semester, of €11.38/MWh, and 52% lower than that of the first semester of 2019, of €15.74/MWh.
The API 2 coal futures in the ICE market for the month M+1, the first half of 2020, registered the half‑yearly maximum price of $55.35/t on January 13. The floods in the mining areas of South Africa and the increase in demand in China, after the restrictions on imports of 2019, led to this maximum being reached in the first fortnight of the year. Later, the coronavirus epidemic in China caused the prices to drop. But, in the second half of March, they recovered to reach $54.45/t on the 25th, before falling again. This recovery was due to fears of a shortage of supplies due to the closure of mines and ports due to the spread of the coronavirus pandemic and the recovery of industrial production in China. But, finally, there was no shortage and the demand in the rest of the countries decreased with the advance of the pandemic, causing the prices to drop. The half‑yearly low, of $38.45/t, was reached on April 28 and the low prices were maintained in May. But, in June, the prices were above $45/t most of the time and on June 29 a settlement price of $50.05/t was reached. On the other hand, the average price of the semester was $47.24/t, 18% lower than the average price of the API 2 coal futures for the month M+1 traded during the previous semester, of $57.53/t, and 29% lower than that of the first semester of 2019, of $66.31/t.
The CO2 emission rights futures in the EEX market for the reference contract of December 2020 started the semester with prices around €24.50/t. But, in March they declined until on the 18th of that month they registered the minimum price of the semester, of €15.30/t. This decline was due to the confinement measures taken to curb the spread of COVID‑19 in Europe. But, despite the confinement, the announcement of reductions in French nuclear energy production in April allowed the start of the price recovery. This recovery continued favoured by the deconfinement process until reaching the half‑yearly maximum settlement price, of €26.97/t, on June 30. The average price of the semester was €22.08/t, 16% lower than that of the previous semester for the 2019 product, of €26.14/t. When compared to the average price of the futures traded during the first half of 2019 for December of that year, of €24.22/t, the average for the first half of 2020 is 8.8% lower.
 Source: Prepared by AleaSoft using data from ICE and EEX.
AleaSoft analysis on the effects on the electricity markets due to the coronavirus crisis
The first semester of 2020 was marked by the coronavirus pandemic, mainly due to the human cost that it entailed. The energy markets were also affected by the measures taken to try to contain the spread of the virus. In order to report on the market monitoring at this stage, at AleaSoft various initiatives were developed. One of them is the energy observatories, where the main variables of the European electricity, fuels and CO2 markets can be visualised with daily updated data.
Also during this period a series of webinars on the “Influence of coronavirus on electricity demand and the European electricity markets” was organised, the last one held on June 25. In them, the evolution and prospects of the prices and demand in the electricity, gas, oil and CO2 emission rights markets was shown, and there were presentations and analysis tables on the impact that this crisis is having on the financing of renewable energy projects in Spain and Europe in general.
The next webinar “Energy markets in the recovery of the economic crisis” will be held after the summer, on September 17, and it will address the following topics:
- Evolution of European energy markets in the economic recovery
- Financing of renewable energy projects
Source: AleaSoft Energy Forecasting.