AleaSoft, July 1, 2021. The first half of 2021 was characterised by the increase in CO2 and gas prices to historical highs and by the effect this had on the spot and futures electricity markets, where prices also rose in a generalised way. In June, the highest monthly price in history or in recent years was reached in almost all European markets. Solar energy production increased in all markets and wind energy production, in most.
Photovoltaic and solar thermal energy production and wind energy production
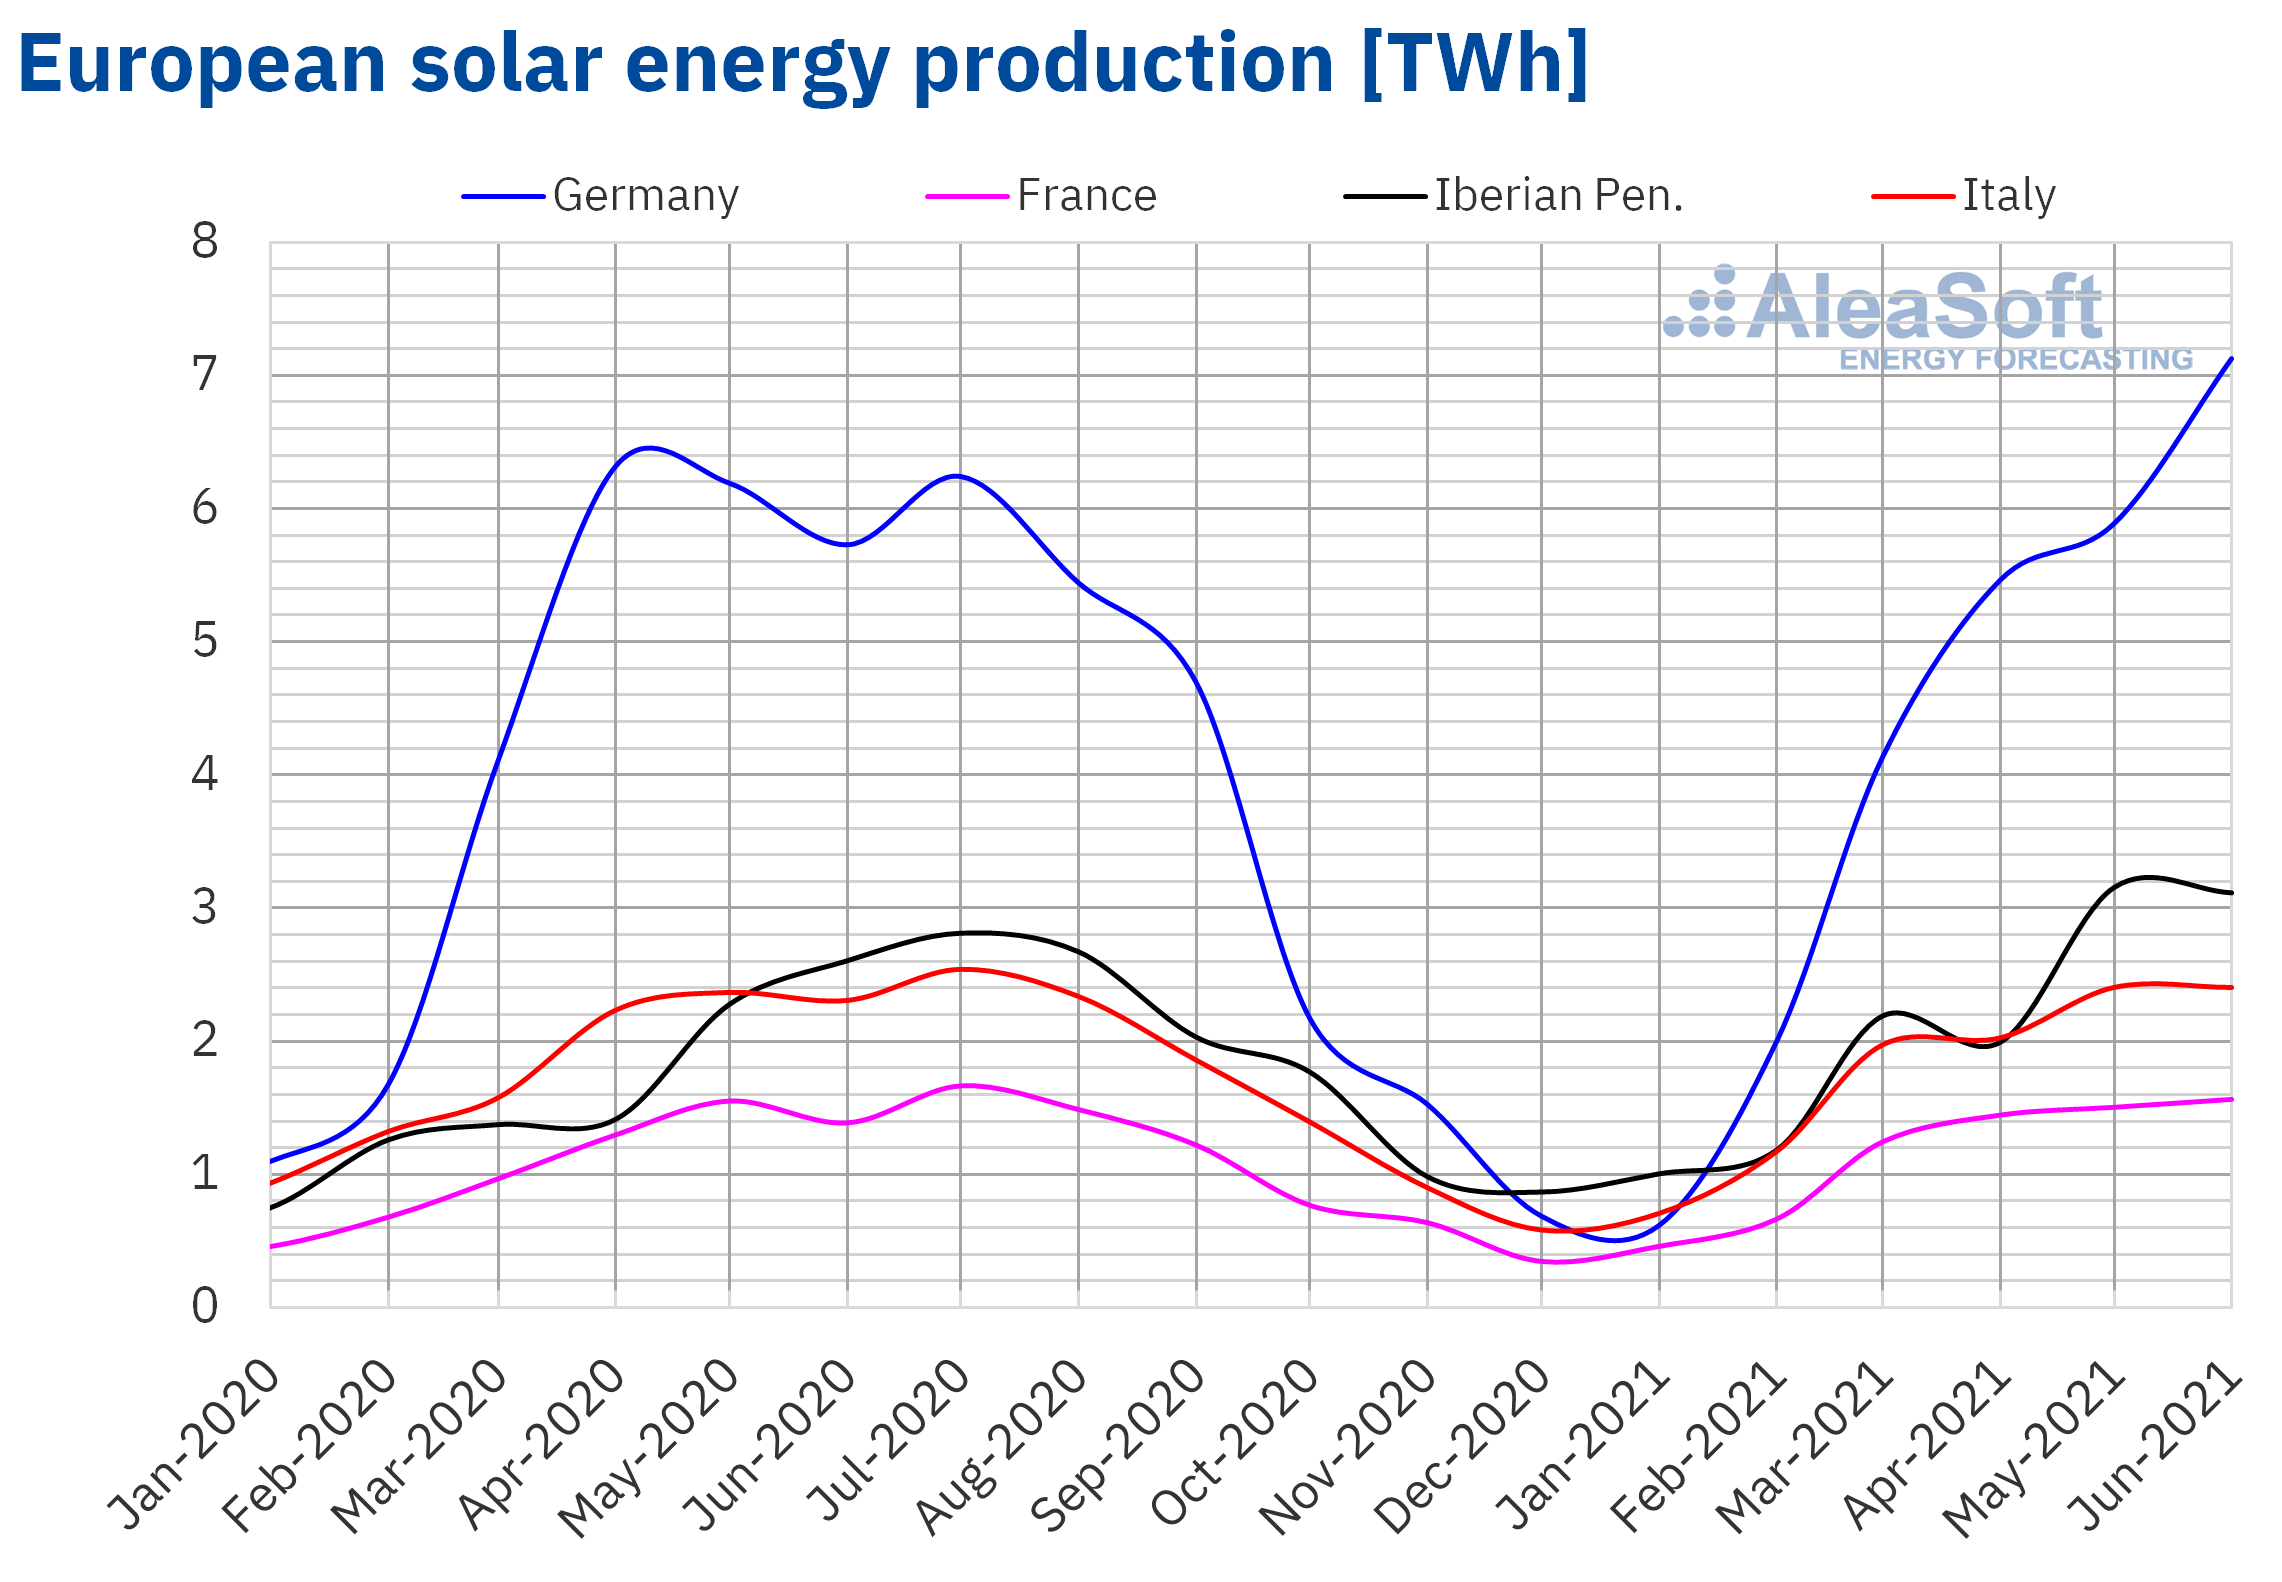
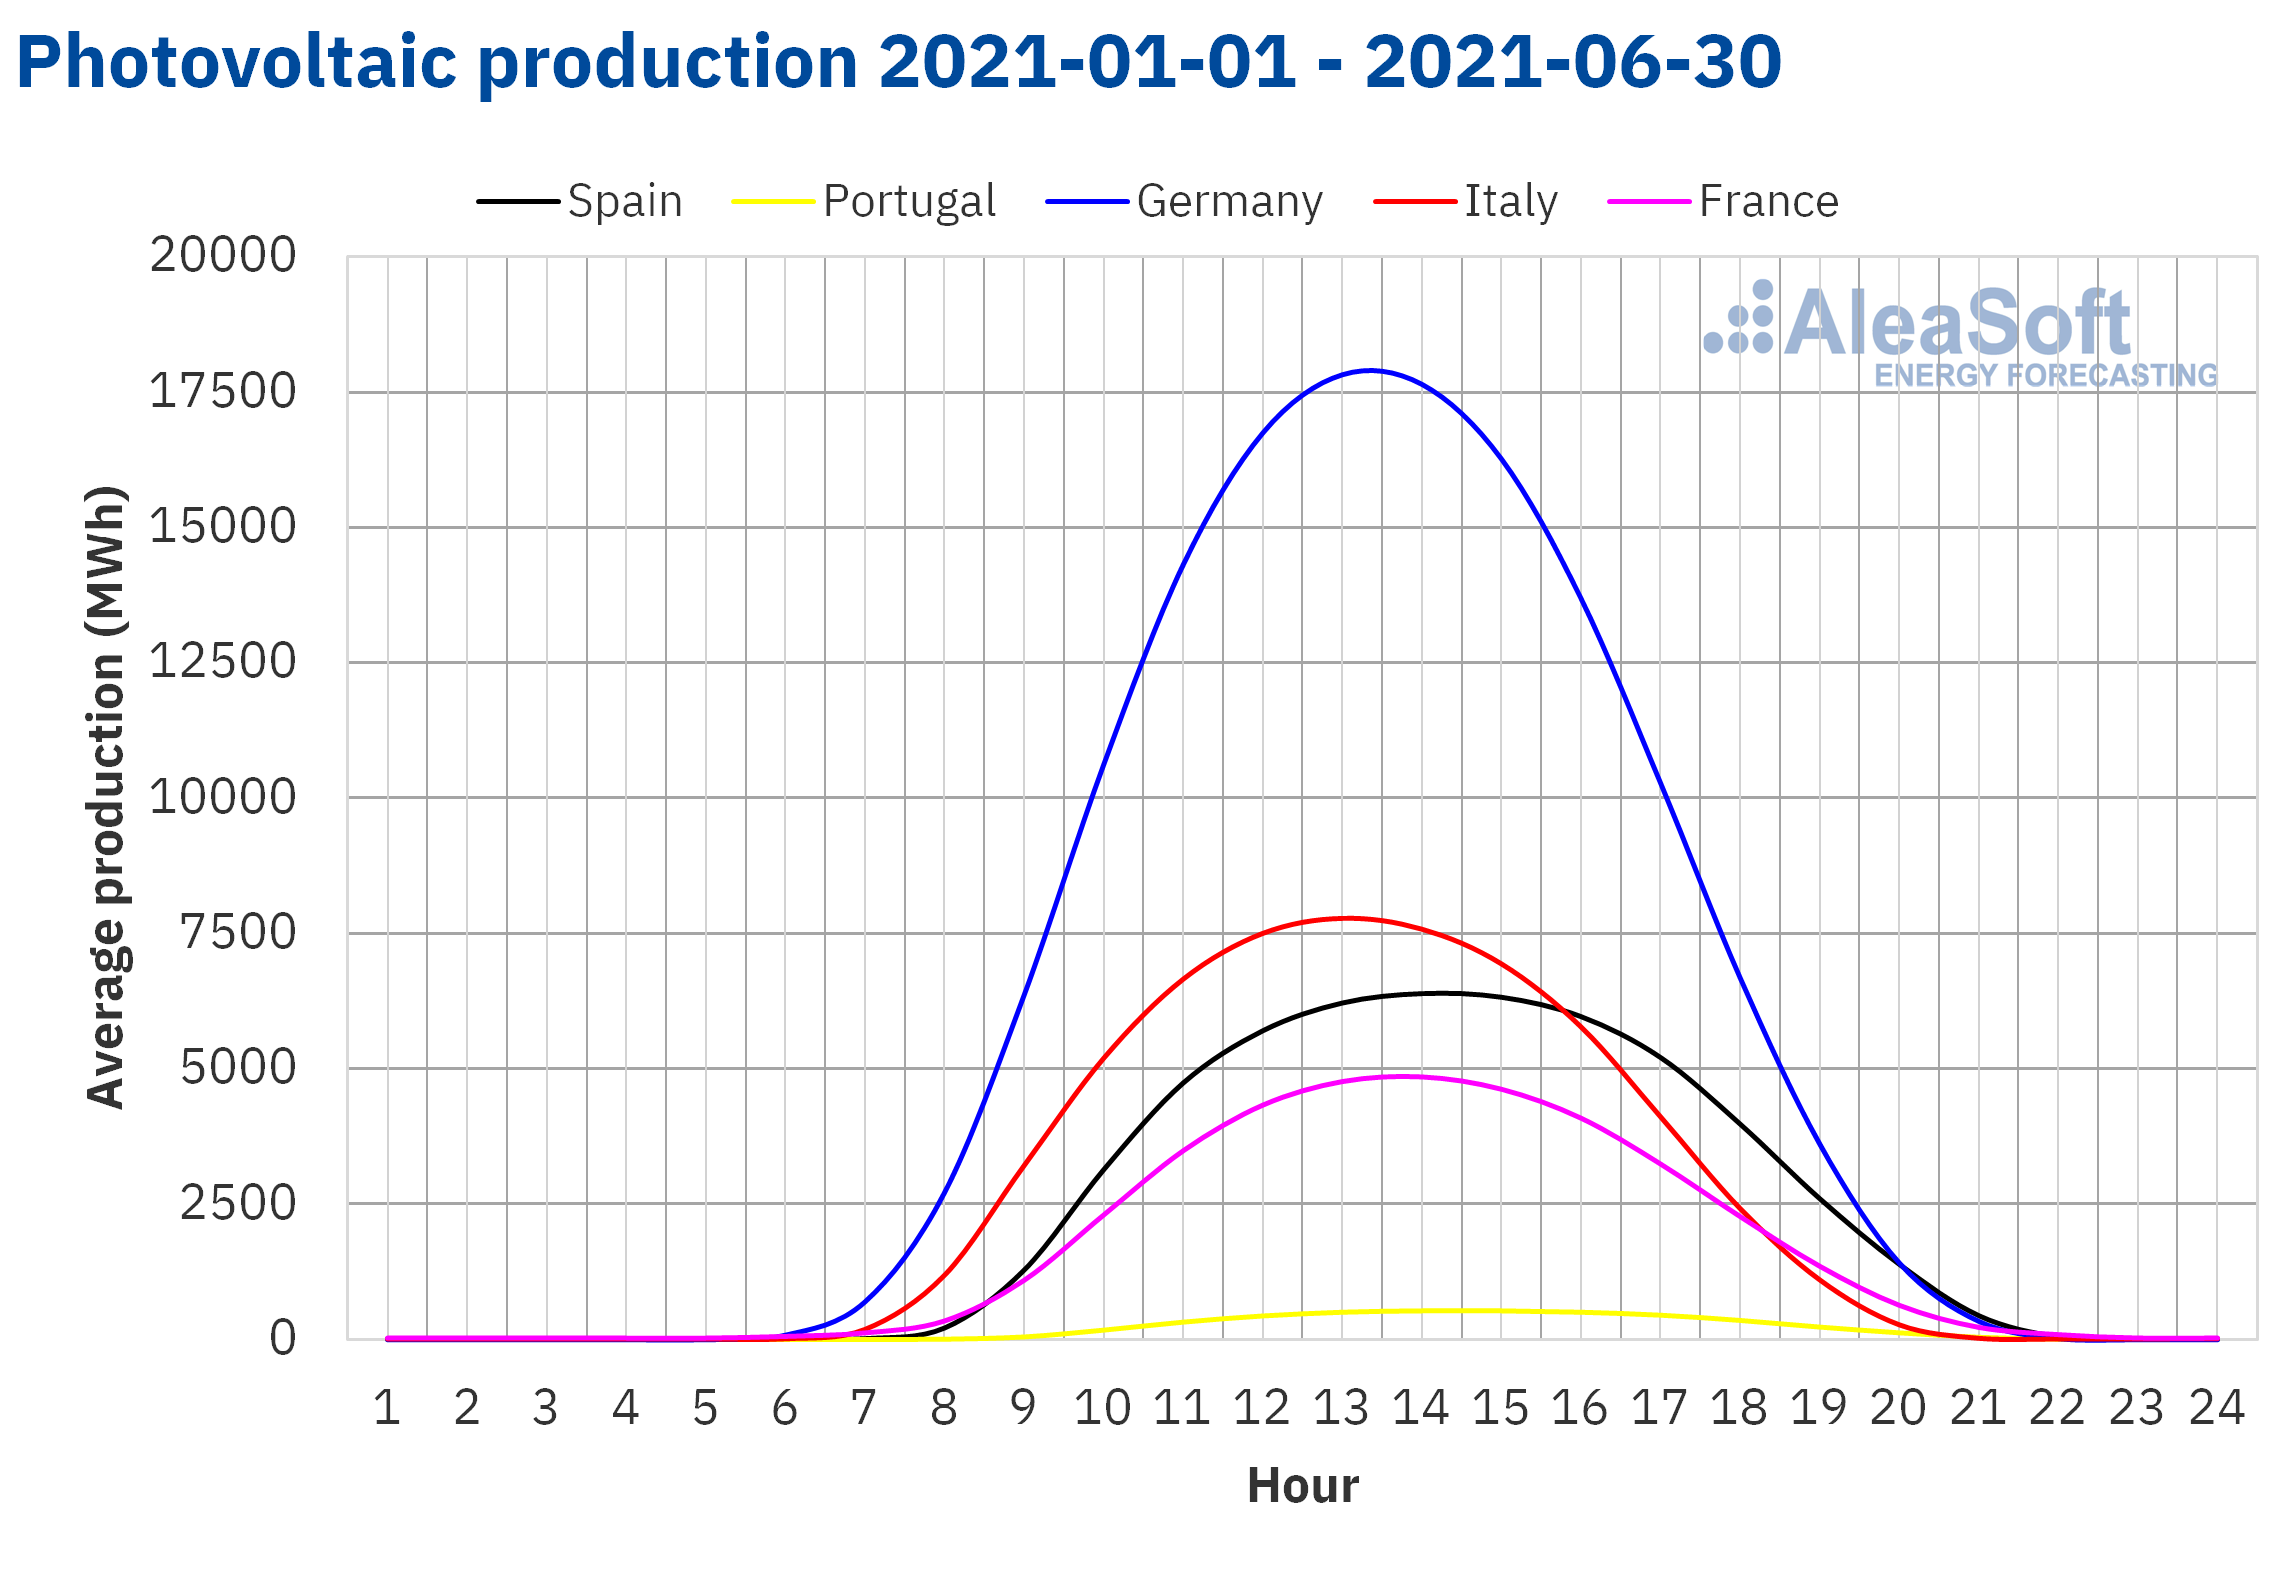
The solar energy production increased in all European markets analysed at AleaSoft during the first half of 2021. In the German market, the production increased by 0.4% compared to the first half of 2020. Although the percentage increase does not seem significant as it is lower than 1.0%, it should be noted that in June 2021 the highest historical monthly production was registered for this market. In the French market, the production compared to the first half of 2020 grew by 8.5% while in Italy the increase was 0.4%. The largest increase was registered in the Iberian Peninsula, which was 28%. In the Spanish market, the production of May with this technology was the highest in the history, a record that was reached in June in Portugal.
Compared to the second half of 2021, the solar energy production also increased in all markets, with the highest increase in the German market, which was 21%. In the rest of the markets analysed at AleaSoft, the increase was between 11% and 13%.
 Source: Prepared by AleaSoft using data from ENTSO-E, RTE, REN, REE and TERNA.
 Source: Prepared by AleaSoft using data from ENTSO-E, RTE, REN, REE and TERNA.
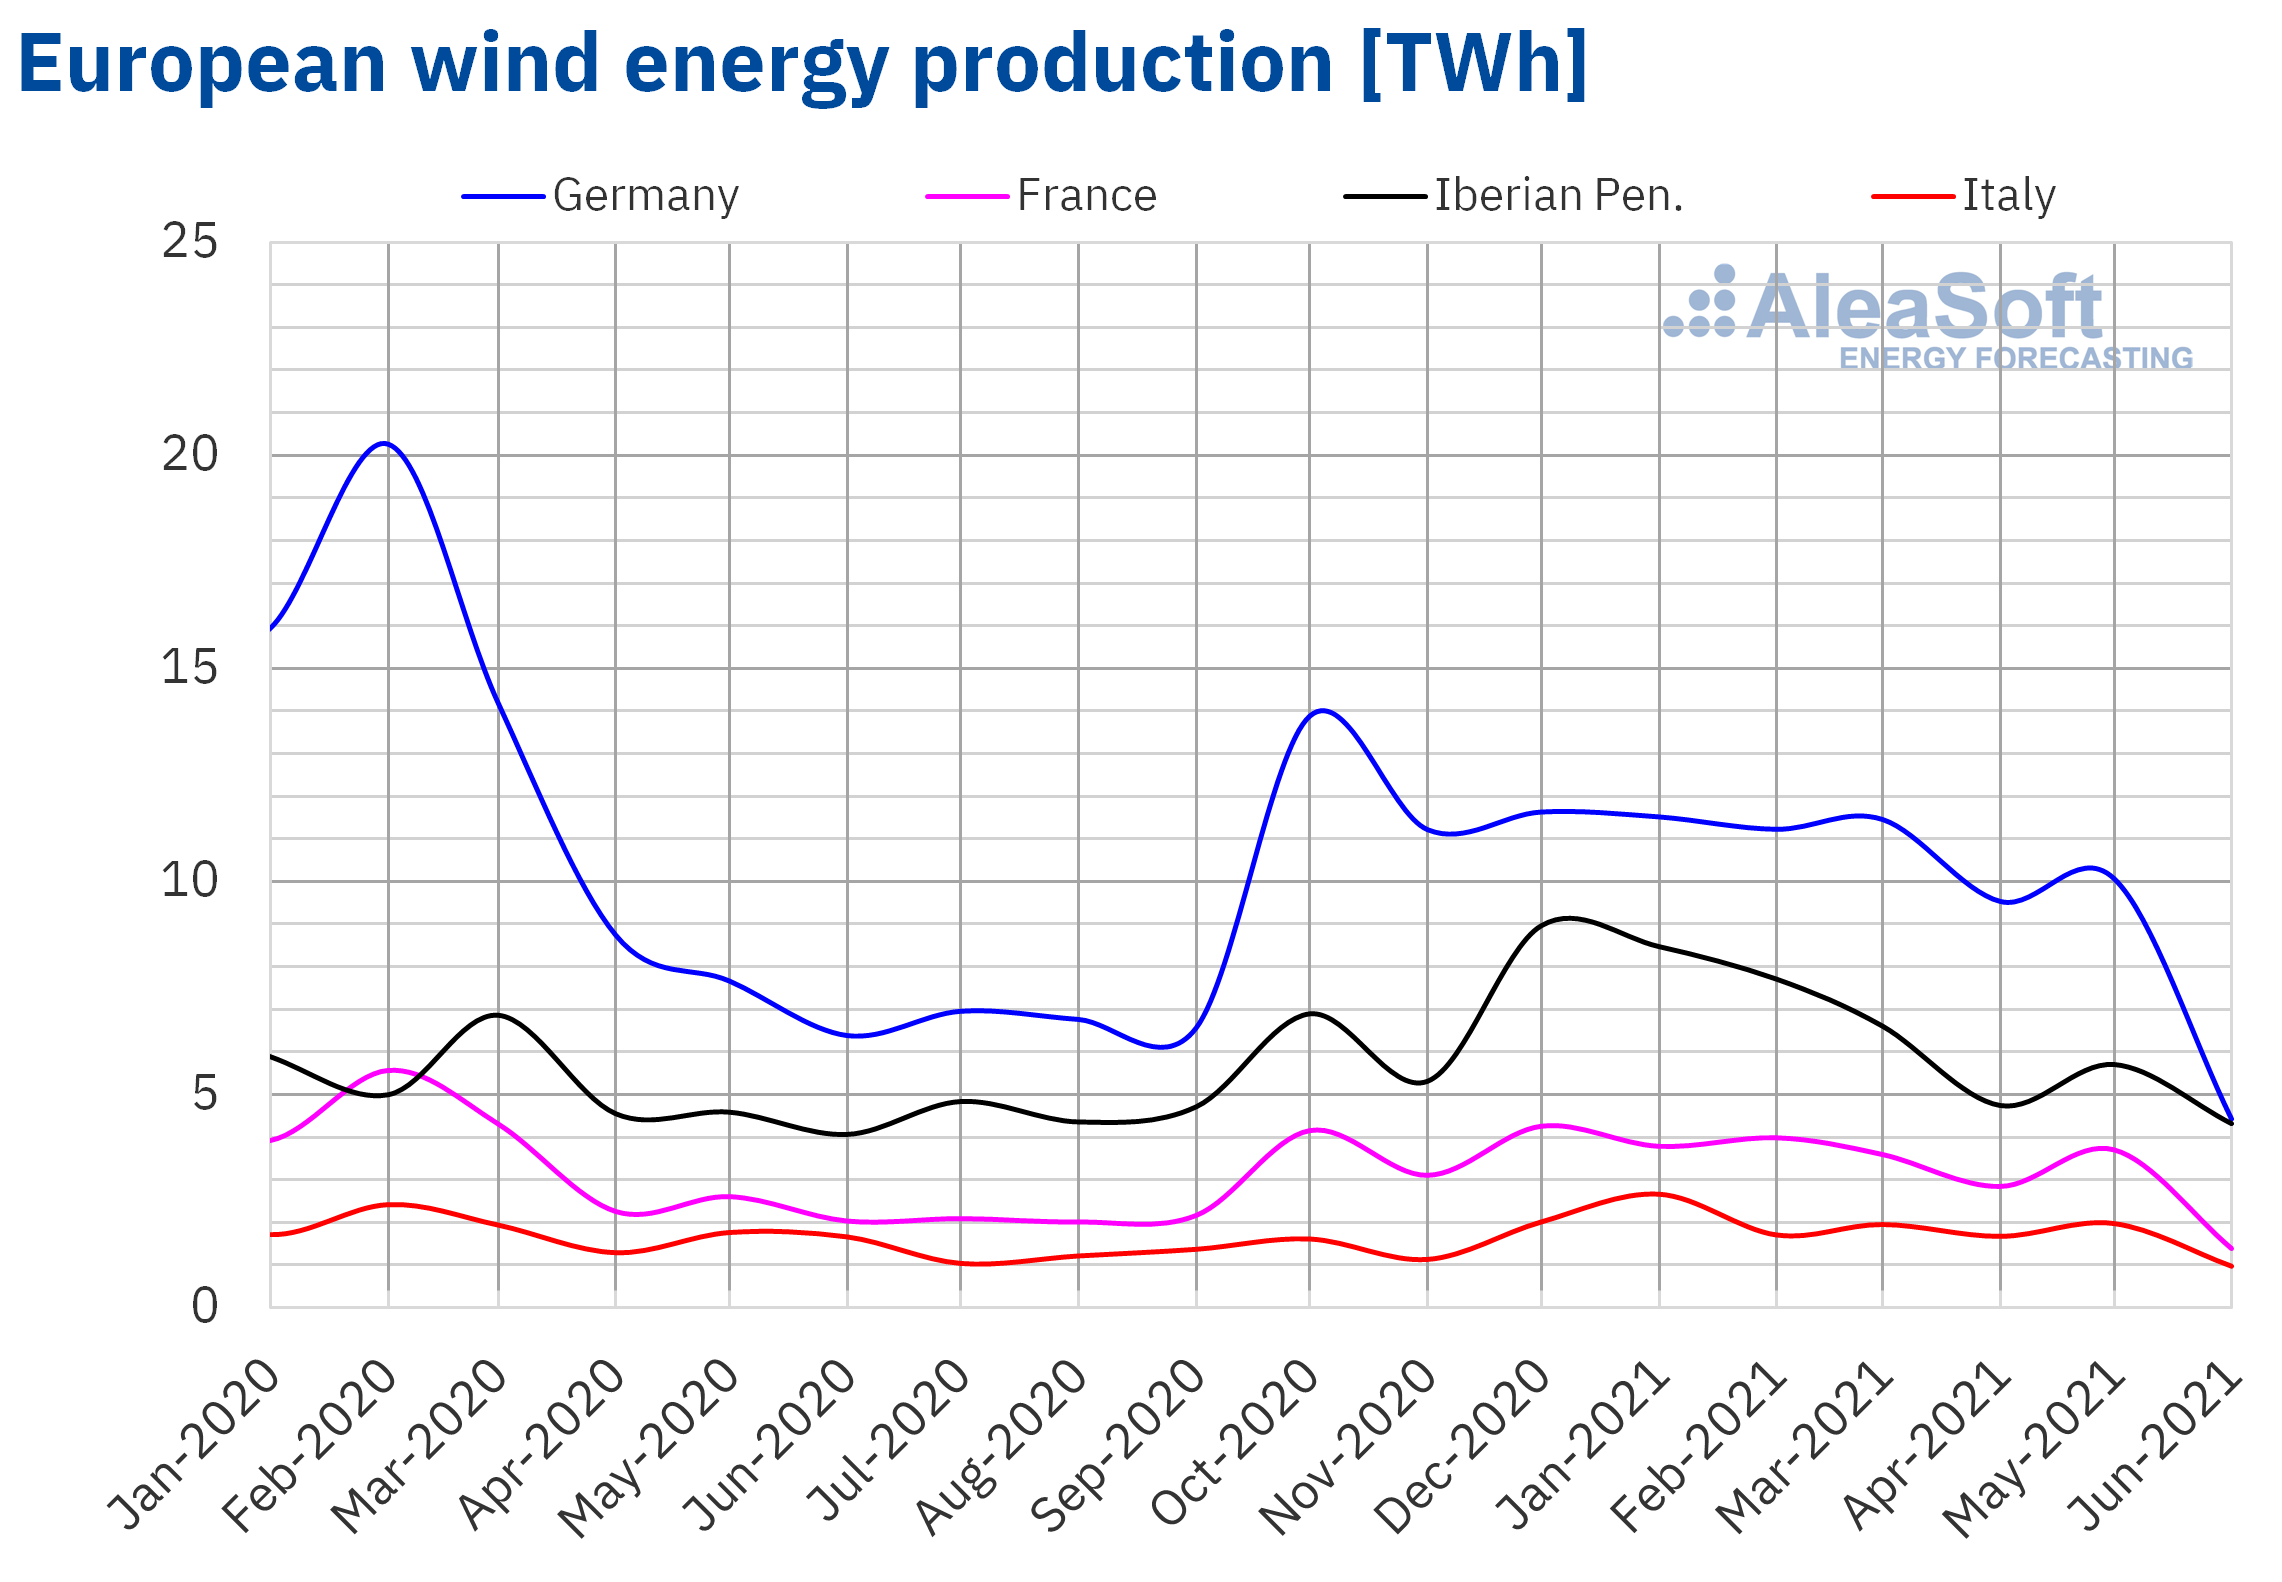
Regarding the wind energy production, during the first half of 2021 it increased by 22% in the Iberian Peninsula compared to the first half of 2020. In the Italian market the increase was 1.6% while in the markets of France and Germany, the production with this technology reduced by 6.0% and 20% respectively.
If the comparison is made with respect to the second half of 2020, the wind energy production increased in all markets in the first six months of 2021 as a whole. The increases were between 2.1% of the German market and 31% of the Italian market.
 Source: Prepared by AleaSoft using data from ENTSO-E, RTE, REN, REE and TERNA.
Electricity demand
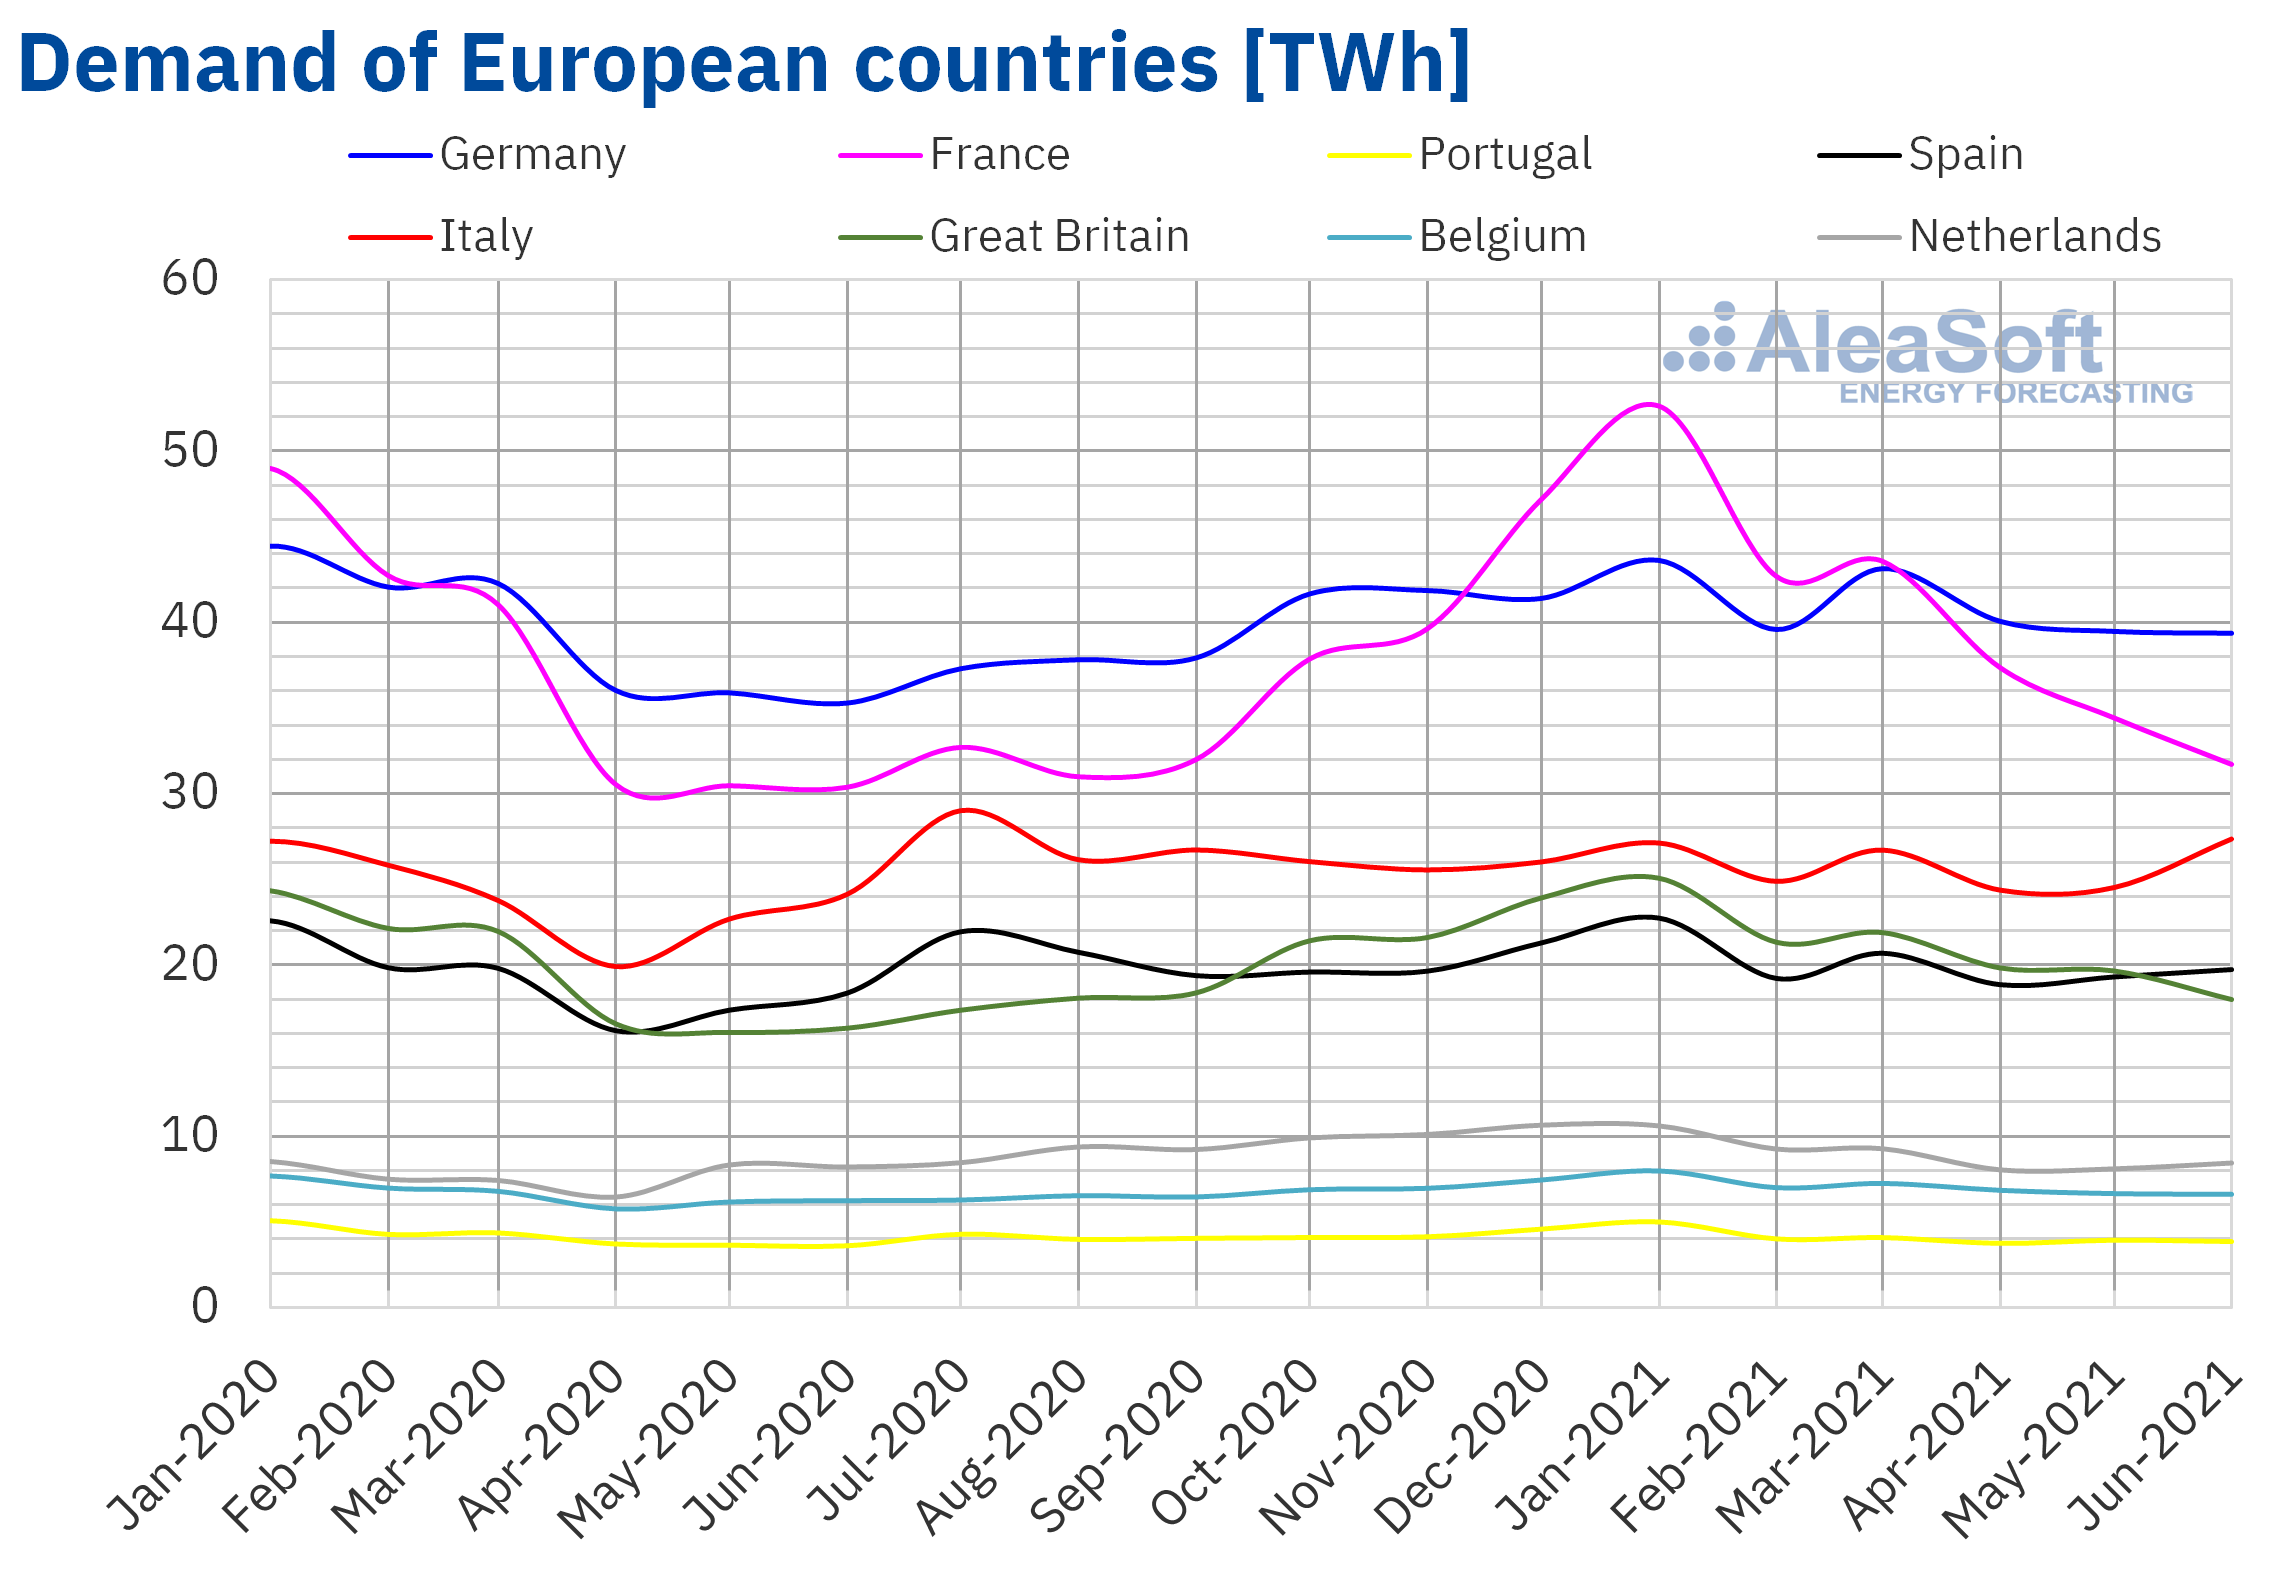
The increase in labour and industrial activity compared to the first six months of 2020 was the main factor in the general year‑on‑year rise in electricity demand in the first half of 2021 in European markets. The increases in France and Italy, of 8.1% and 7.9% respectively, stand out. The markets of Belgium and Great Britain also registered significant year‑on‑year increases, which were around 7.0%. Regarding the average temperatures of these first six months of 2021 compared to the same period of 2020, most markets registered decreases of more than 1.5 °C.
The month of April 2021 represented the largest jump compared to 2020, because most markets registered increases that exceeded 15%. In the Belgian market, the demand for each month of the first half of 2021 was higher than that of the same month of the previous year. Similarly, in Spain, France and the Netherlands, the monthly demand of five of the months elapsed in 2021 was higher than that of 2020. The monthly evolution of the electricity demand in Europe is available for analysis in the energy markets observatories of AleaSoft.
In the comparison with the second half of 2020, the demand behaved unevenly in the markets of Europe. On the one hand, in France it rose by 10%, as well as there were increases in Belgium, Great Britain and Germany, which reached up to 4.3% in the first of these markets. While, on the other hand, there were decreases in the markets of Spain, Italy and Portugal of between 1.5% and 3.0%.
 Source: Prepared by AleaSoft using data from ENTSO-E, RTE, REN, REE, TERNA, National Grid and ELIA.
European electricity markets
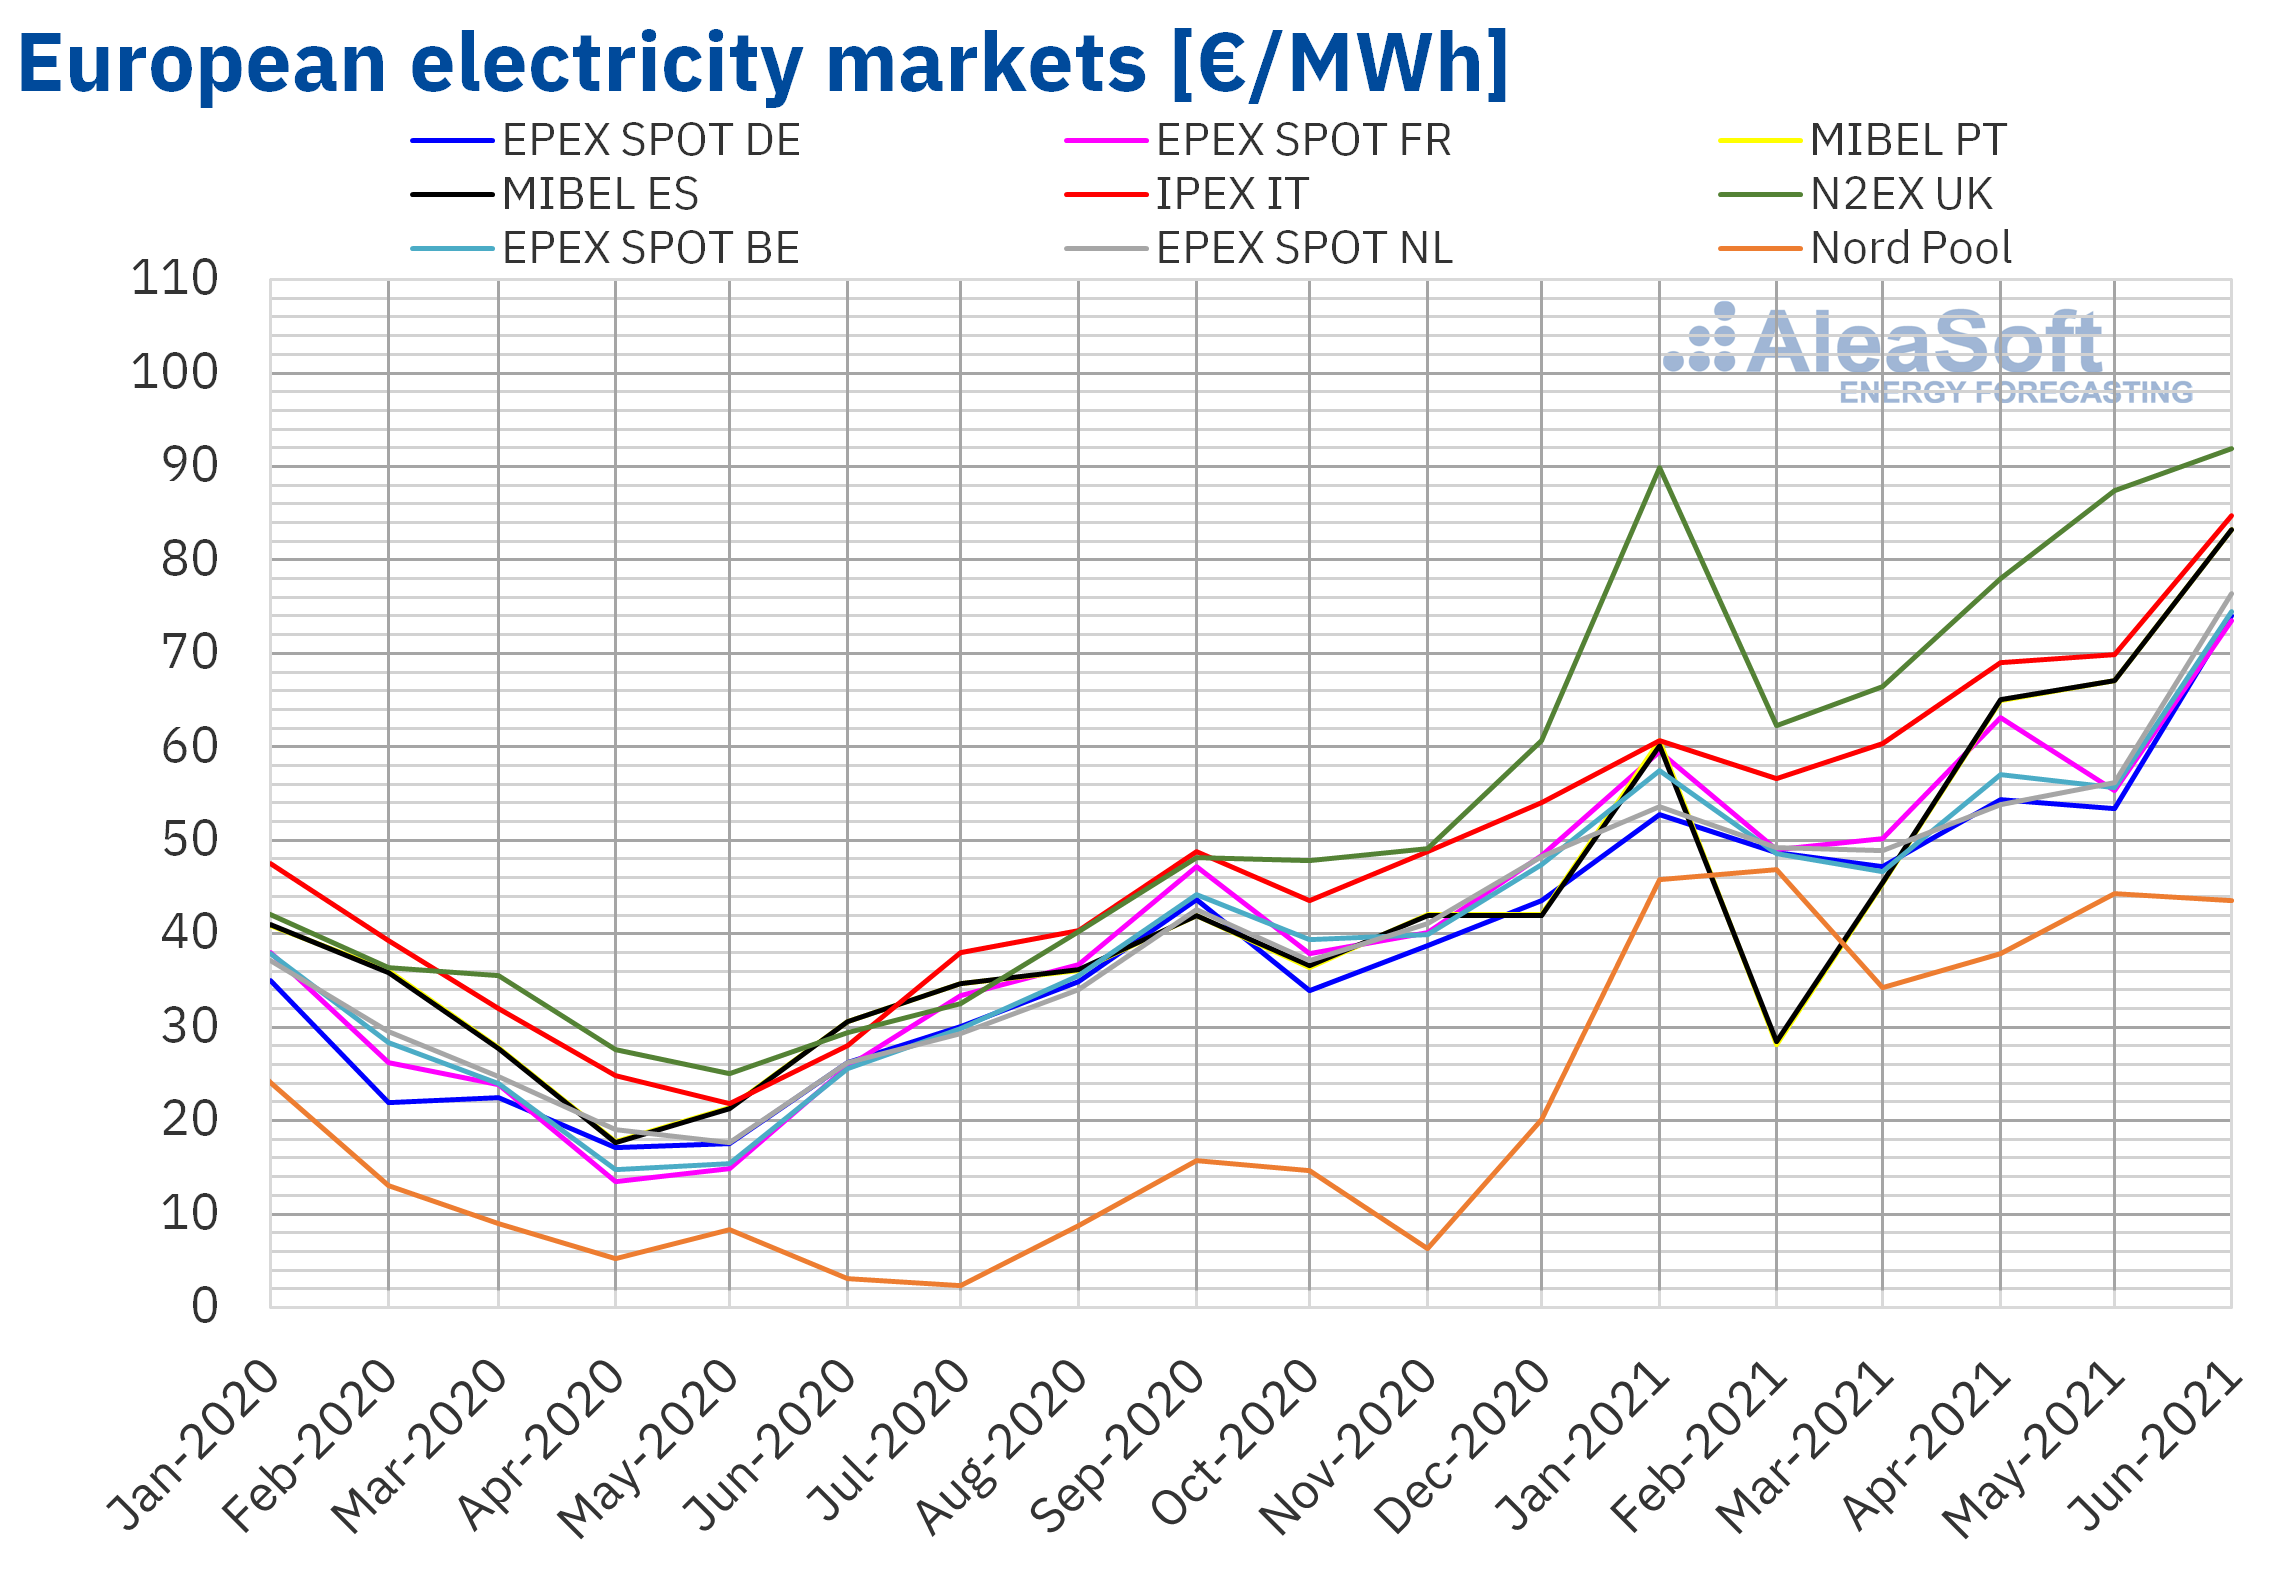
In the first half of 2021, the prices of all European electricity markets analysed at AleaSoft increased both compared to the previous semester and compared to the first semester of 2020. When comparing the prices with those of the previous semester, the largest increase was that of the Nord Pool market of the Nordic countries, of 271%, followed by that of the N2EX market of the United Kingdom, of 71%. On the other hand, the lowest price increases were those of the EPEX SPOT market of France and Belgium, of 44% in both cases. In the rest of the markets, the increases were between 46% of the EPEX SPOT market of the Netherlands and 51% of the MIBEL market of Spain and Portugal.
On the other hand, the average prices of the first six months of 2021 were above double those registered during the first half of 2020. In this case, to the rise in prices registered in the months elapsed in 2021 it is added that in the first half of 2020 the prices were low due to the consequences of the restrictions carried out at the beginning of the COVID‑19 pandemic. Once again, the Nord Pool market registered the highest price increase, of 299%. While the markets with the lowest increases were the MIBEL market, with an increase of 102%, and the IPEX market of Italy, with 108%. The rest of the markets had price increases between 119% of the Netherlands and 147% of France.
As a consequence of these increases, the half‑year average price was above €50/MWh in most of the analysed European electricity markets. The exception was the Nord Pool market, which averaged €42.03/MWh, despite being the market with the highest percentage price increases. This is due to the low prices registered in 2020 in this market, to which a high hydroelectric energy production contributed. On the other hand, the highest half‑year average price was that of the N2EX market, of €79.53/MWh, followed by the IPEX market average, of €66.96/MWh. In the rest of the markets, the prices were between €54.96/MWh of the German market and €58.60/MWh of the Portuguese market.
In addition, in the first half of 2021, historical maximum monthly average prices were reached in all analysed European electricity markets, in most cases in June. The average price for this month was the highest in the history in the markets of Spain, Portugal and the Netherlands, reaching values of €83.30/MWh, €83.29/MWh and €76.46/MWh respectively. In the case of the markets of Germany, Belgium, France and Italy, in June 2021, the highest averages were registered since October 2008, November 2018, January 2017 and August 2012, respectively. In the case of the United Kingdom, although the average for the month of June was the highest in the history if the data are analysed in Euros, the record monthly price in this market, of £80.26/MWh, was reached in January 2021. While the Nord Pool market reached in February 2021 the highest monthly price since January 2019.
On the other hand, the British market reached the highest half‑year average price in its history in the first half of 2021. In the case of the German market, the half‑year average was the highest since the second half of 2008. The rest of the markets had the highest average in the last five semesters.
In the first half of 2021, the rise in gas and CO2 emission rights prices were the most important causes of the increase in European electricity markets prices. In addition, the recovery in demand, especially compared to the same semester of 2020, also contributed to the price increases.
However, less cold temperatures and the increase in renewable wind and solar energy production in February slowed the increases during that month in most of the European electricity markets. In this period, the MIBEL market stood out because of registering the lowest monthly averages, of €28.19/MWh for Portugal and €28.49/MWh for Spain.
 Source: Prepared by AleaSoft using data from OMIE, EPEX SPOT, Nord Pool and GME.
Electricity futures
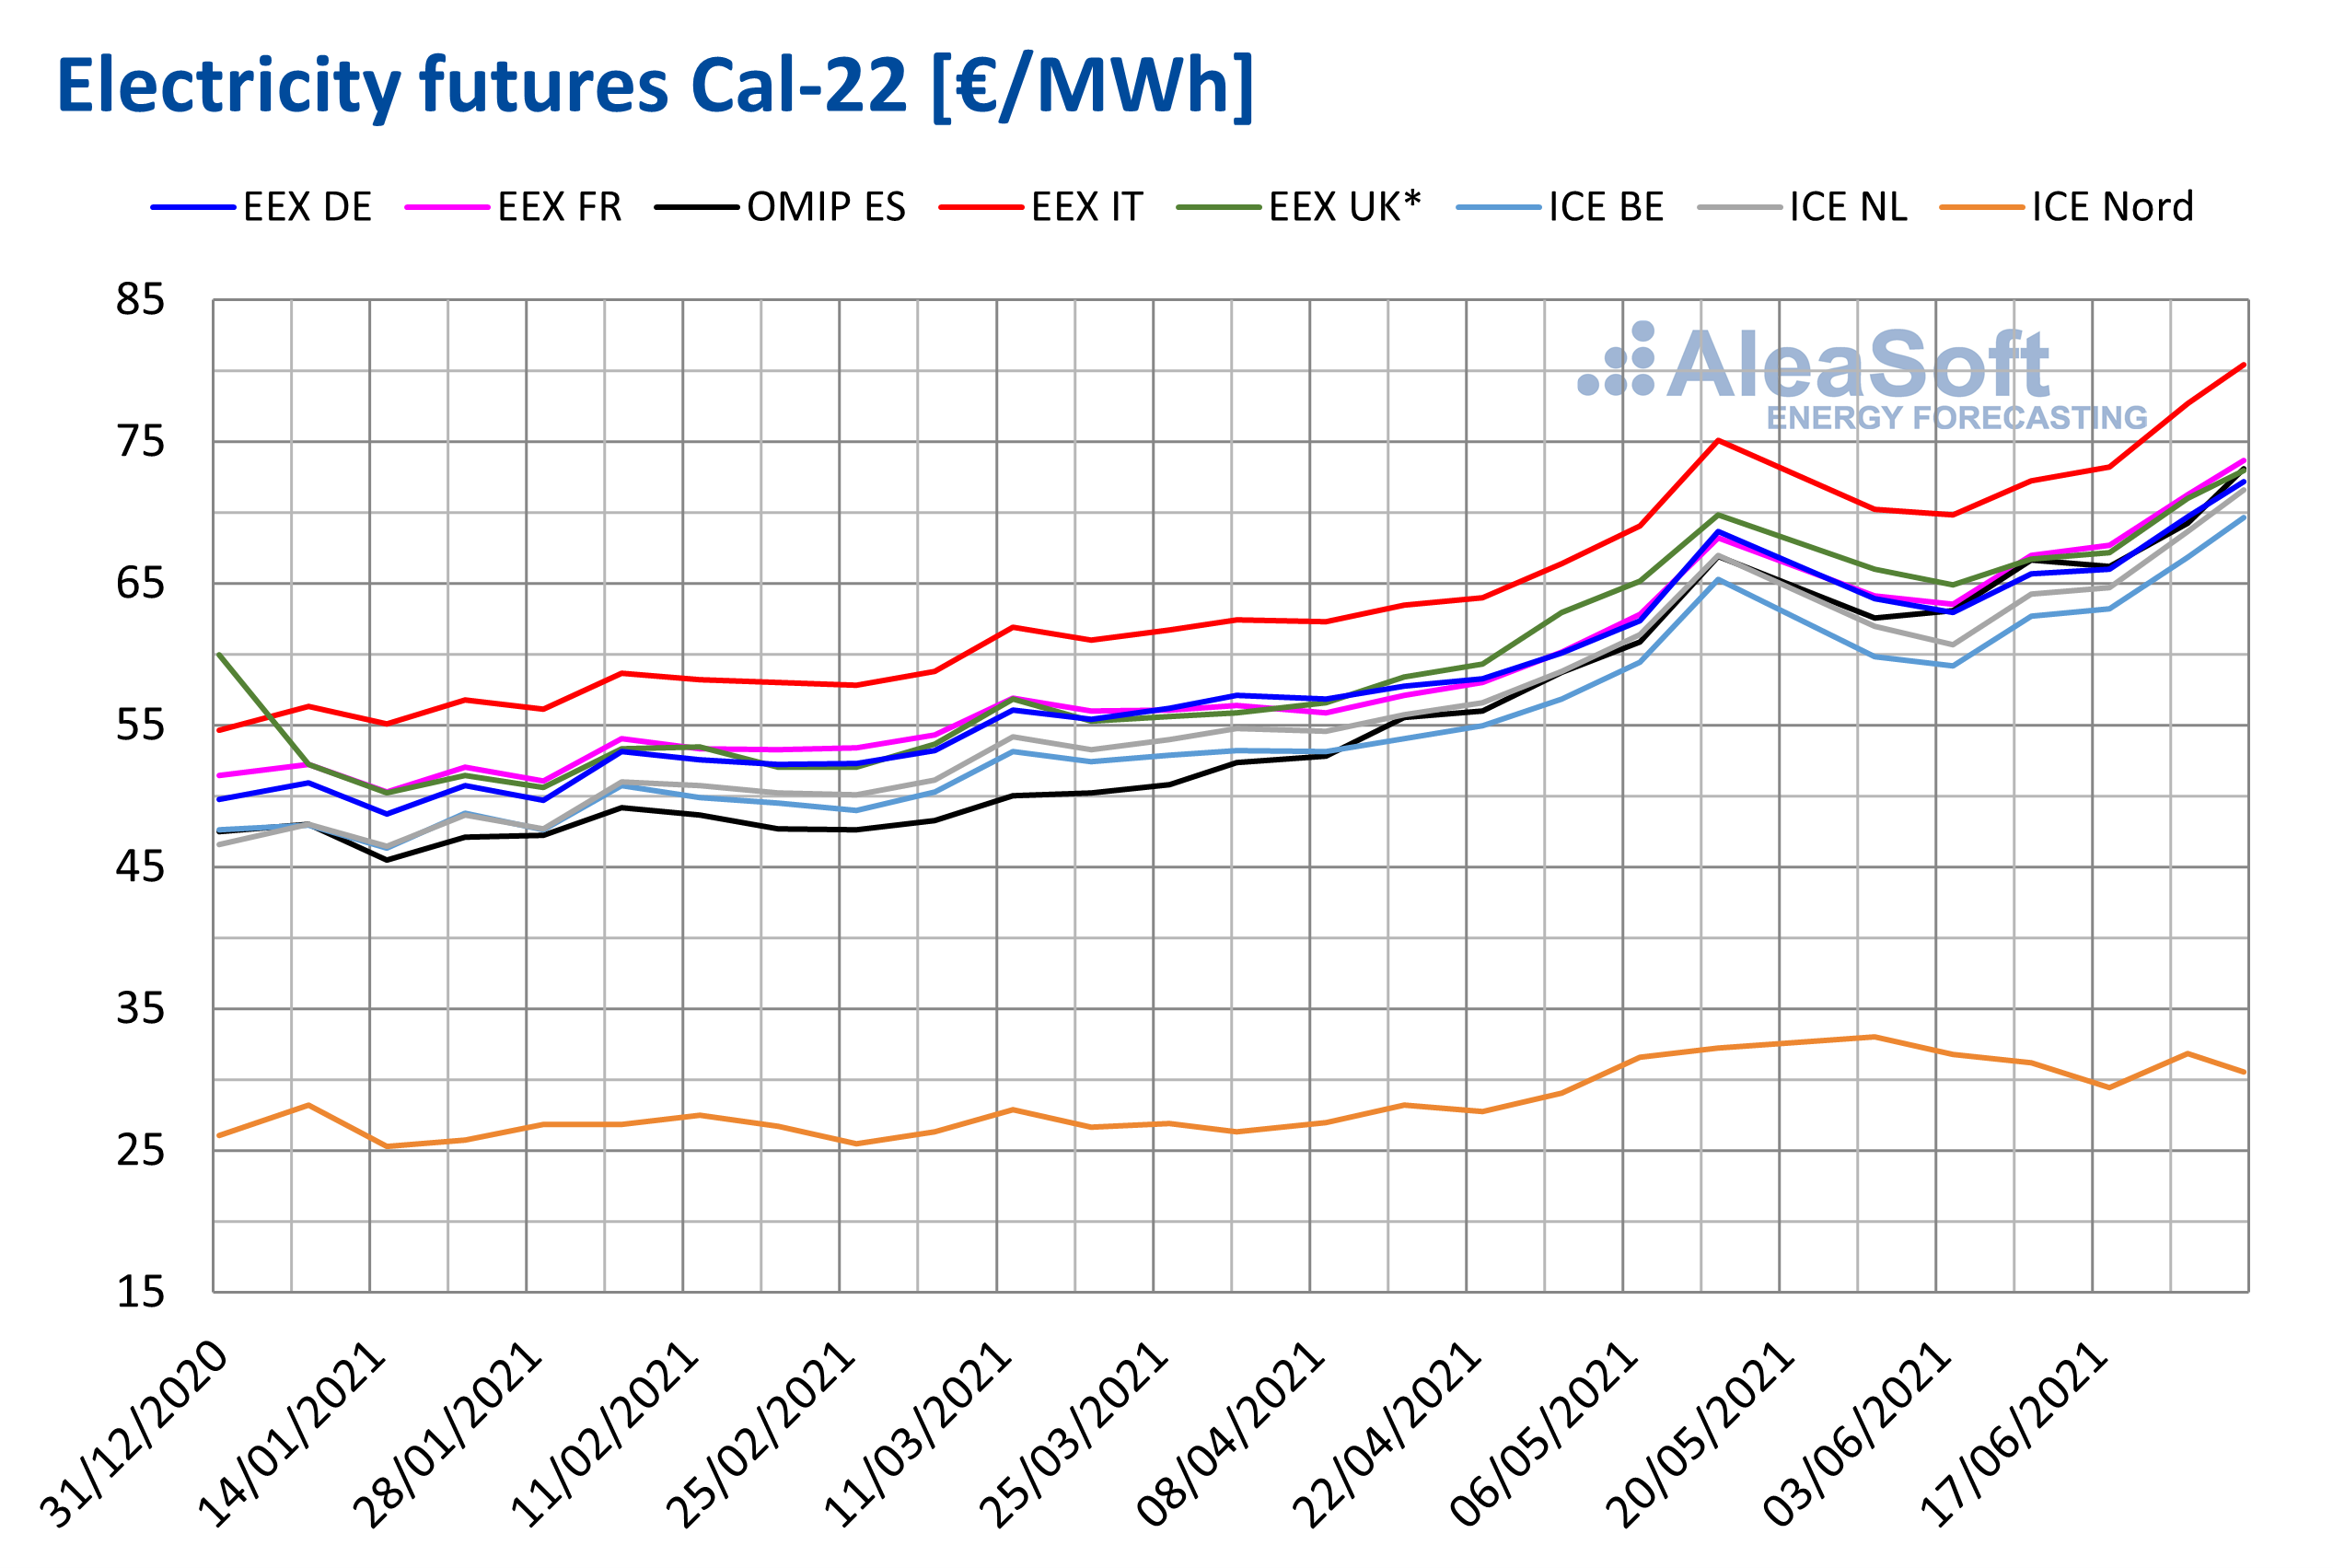
During the first half of 2021, the electricity futures prices for the next calendar year 2022 had a predominantly upward behaviour in almost all markets analysed at AleaSoft. The Nordic countries region is where the prices behaved more stable, staying in the range of €25/MWh to €30/MWh throughout the period.
On the other hand, in the rest of the markets, the prices began an escalation in mid‑January that did not stop until mid‑May. During the second half of May and until the first days of June, the prices fell in most markets. However, during the rest of June, the prices rose again and more rapidly.
 Source: Prepared by AleaSoft using data from EEX, OMIP and ICE
* The UK EEX market data are expressed in £/MWh
The last market session of the first semester ended with most of the markets registering their highest price in this period. The EEX market of Italy was the one with the highest price during practically all that elapsed in 2021 and its record price in the first semester was €80.41/MWh reached in the June 30 session. The ICE and NASDAQ markets of the Nordic countries remained very marked as those with the lowest prices, with very similar values and their minimum during the period was €25.30/MWh and €25.20/MWh respectively, registered in the January 15 session.
Brent, fuels and CO2
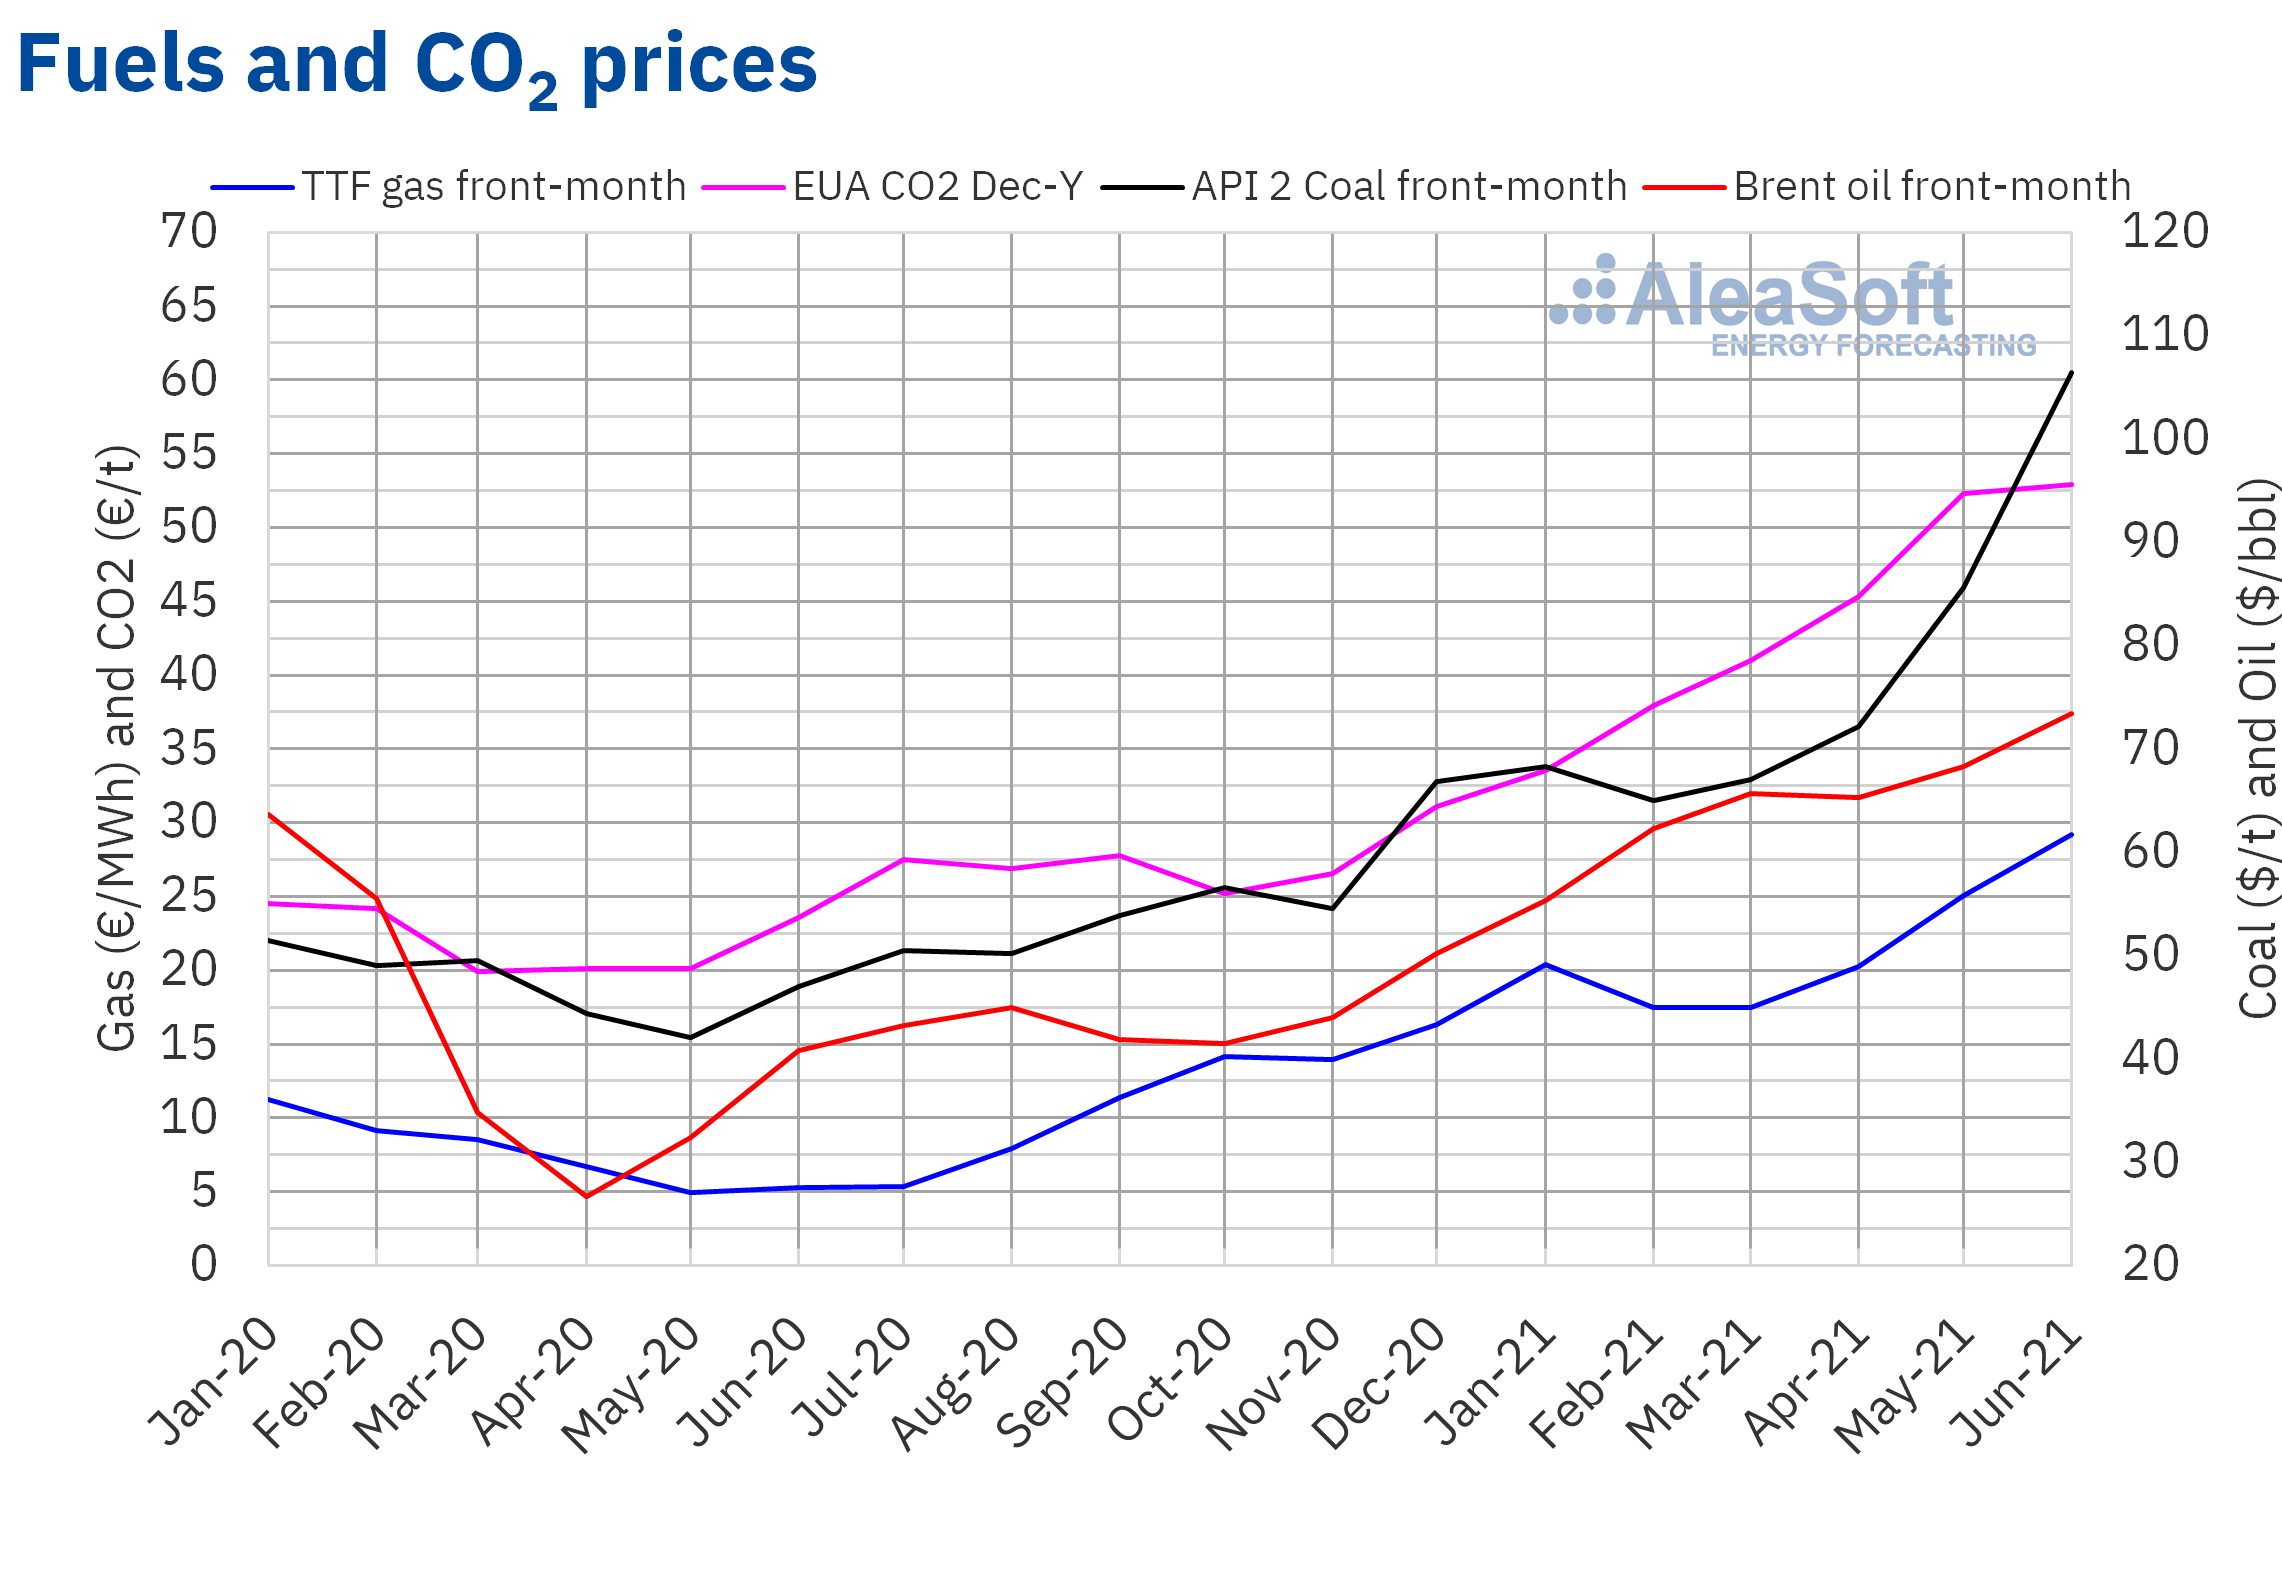
The Brent oil futures prices for the contract with the closest expiration in the ICE market had a generally increasing trend during the first half of 2021. They registered their minimum settlement price, of $51.09/bbl, in the first session of the semester, on January 4. On the other hand, the half‑year maximum settlement price, of $76.18/bbl, was reached on June 25, which was also the highest settlement price since October 2018.
On the other hand, the half‑year average price was $65.05/bbl. This value is 47% higher than that reached by the futures for the contract with the closest expiration in the previous semester, of $44.29/bbl, and 54% higher than that corresponding to the futures traded in the first semester of 2020, of $42.30/bbl.
During the first half of 2021, the progress in vaccination campaigns against COVID‑19 and the expectations of economic recovery favoured the increase in Brent oil futures prices. The OPEC+ also adapted its production to the pace of the demand recovery.
In the first half of the semester, despite the mobility restrictions established by the pandemic, the decline in production in the United States due to the low temperatures in February, the attacks on Saudi oil facilities and the blockade of the Suez Canal in March also exerted their upward influence on prices.
But, in the second half of the semester, the talks to reach an agreement on nuclear matters that would allow the lifting of sanctions on Iran’s crude oil exports and the expansion of the Delta variant of the coronavirus, which seriously affected a large oil importer such as India, exerted their downward influence on prices.
In the last part of the semester, the confinement measures were lifted in many countries and the mobility increased in the United States and Europe, which contributed to the recovery in demand. However, the expansion of the more contagious Delta variant is still a source of concern. In addition, in the coming days, prices are expected to be influenced by the results of the OPEC+ meeting of July 1, where they will decide their production levels for the next few months.
For most of the first half of 2021, the TTF gas futures prices in the ICE market for the closest expiration contract followed an upward trend. As a consequence, they reached their maximum price, of €34.62/MWh, on June 30. This price was the highest in, at least, the last seven years.
On the other hand, the average value registered during the semester was €21.68/MWh. Compared to the futures for the closest expiration contract traded in the previous semester, it increased by 88% from €11.51/MWh. If compared with the futures for the contract with the closest expiration traded in the first half of 2020, when the average price was €7.63/MWh, the increase was 184%.
The episodes of low temperatures and of high gas demand in Asia contributed to the price increases. These led to a price spike in the first half of January. In the last part of the semester, the low levels of the reserves and the maintenance works, which caused declines in gas flows from Norway in May and June, also favoured the price increases. In general, the gas demand rose, with a great boost by China, and also favoured by the increase in demand for this fuel for the electricity generation to replace coal, whose prices also increased considerably and are at levels not seen since September 2011, and which is also more affected by the increase in CO2 prices. Gas supply is not sufficient to cover all demand and restore the reserves, which is driving the upward price trend.
The CO2 emission rights futures in the EEX market for the reference contract of December 2021 registered, in general, an upward trend during the first half of the year. The half‑year minimum settlement price, of €31.62/t, was registered on January 18. On the other hand, the half‑year maximum settlement price, of €56.65/t, was reached on May 14. The main cause of this rise in prices is the speculation in the market. Also in April, the demand increased because at the end of that month the deadline for companies to deliver the rights corresponding to 2020 was met.
On the other hand, the average price of the semester was €43.83/t, 59% higher than that of the previous semester for the 2020 product, of €27.50/t. If compared with the average price of the futures traded during the first half of 2020 for December of that year, of €22.05/t, the average of the first half of 2021 was 99% higher.
 Source: Prepared by AleaSoft using data from ICE and EEX.
AleaSoft’s analysis on the prospects for energy markets in Europe
The gas prices are at historical highs and the futures point that they will remain that way until the first quarter of 2022. The CO2 prices also remain high and exceeded €56/t again on the last day of June. In this context, AleaSoft is making a special promotion of the long‑term prices forecasting reports of the European electricity markets. These forecasts are made using a scientifically‑based methodology endorsed by the more than 20 years that AleaSoft has been working for the main companies of the energy sector. The following graph shows an example of the quality and coherence of a long‑term forecast of the MIBEL market that was carried out at AleaSoft in 2010.
Source: Long term price forecast made by AleaSoft in October 2010. The forecast shows monthly data from November 2010 to June 2021
A special promotion of the short‑ and mid‑term prices forecasting services for European markets is also being carried out. The forecasts with these horizons are useful, for example, in the operation of wind and photovoltaic energy parks and in the energy management by retailers, large consumers, utilities and traders.
The analysis of how the first half of 2021 was in the European electricity markets will be one of the topics of the next AleaSoft webinar, which will be held on July 15. In addition to the markets that are usually analysed in these webinars, others that may represent opportunities for the energy sector agents, such as those of Poland, Greece, Romania and Serbia, will be addressed. The prospects for the energy markets for the second half of the year and what will be, according to AleaSoft‘s vision of the future, the role that green hydrogen will have in the energy transition, especially in the decarbonisation of sectors that have a great weight in terms of the polluting gases emission in the European Union, such as transport and industry, will also be analysed.
Source: AleaSoft Energy Forecasting.

